
An Introduction to Google Analytics (GA3) Universal Analytics
In this article we will be discussing Google Analytics 3 (GA3) otherwise known as Google Analytics. If you would like to learn more about Google Analytics 4 (GA4) then you can go to our Google Analytics 4 guide. Think of this article as a Google Analytics for beginners guide.
One of the first things that you will want to do on a brand new website is set up a tool to collect important metrics like the number of people who are visiting your site. There are many online tools that let you do this. By far the most popular is Google Analytics.
Much of the content that you will find online about Google Analytics contains complex jargon that is aimed at people who have been using the tool for a while. This introduction to Google Analytics will provide a beginners’ overview of the platform. It will cover how Google works and provide information on the type of insights that Google Analytics can provide. That’s whether you’ve used one of the available website builders to knock up your first ever site, or own an established domain.
What Does Google Analytics Do?
Fundamentally, all Google Analytics does is provide you with information regarding the actions taken by a person visiting your website. The information it can collect covers everything from the really general stuff like which website they came from – for example Facebook or Google – through to very specific metrics like how much of the content on a page visitors viewed.
Google Analytics processes all of this data and turns it into reports, with graphs and stats that you can analyze. A lot of people will only ever use the main reports the tool generates, which is fine. In this sense, Google Analytics is a very simple solution. Where Google Analytics gets complex is when it comes to the advanced functions that experts can use to collect additional insights.
The next few sections of this guide will cover in a bit more depth how Google Analytics collects data, how the data is processed, and the kind of reports you can get access to. There will be a couple of technical terms, but we’ll do our best to explain them.
Collecting Data
As mentioned earlier, Analytics gathers data about visitors to your website. It records things like how many visitors you get and what they do on your site. What lets it do this, is a small piece of code that you add to your site. You need to add it to every page, but we’ll cover this in more detail in a later post.

The code enables Google Analytics to drop a cookie in the browser of each site visitor. The cookie is what lets Analytics track what the visitor does on your site. Each time a person does something on your site the Cookie tells Google Analytics.
These actions are called a hit. There are three main types of hit involved with using Analytics:
- Pageview Hit – This is the most common. It’s sent to Analytics when someone visits a page on your site. It will contain information like which page is visited. As well as which browser and device the visitor is using.
- Event Hit – These are sent when a visitor performs a certain action on your site. That might be playing a video, clicking a specific link or filling in a contact form.
- Ecommerce or Enhanced Ecommerce Hit – These are hits to do with making purchases. They tell you what products get purchased. They can also record the pages visited before a customer bought a product.
When you review the type of hits Google Analytics can collect you get a sense of the information that you can access through the tool. So that’s how Google Analytics collects data.
Processing Data
The data provided by the hits mentioned above, is then processed by Google Analytics. One of the first things the tool does is to arrange the data by users and sessions.
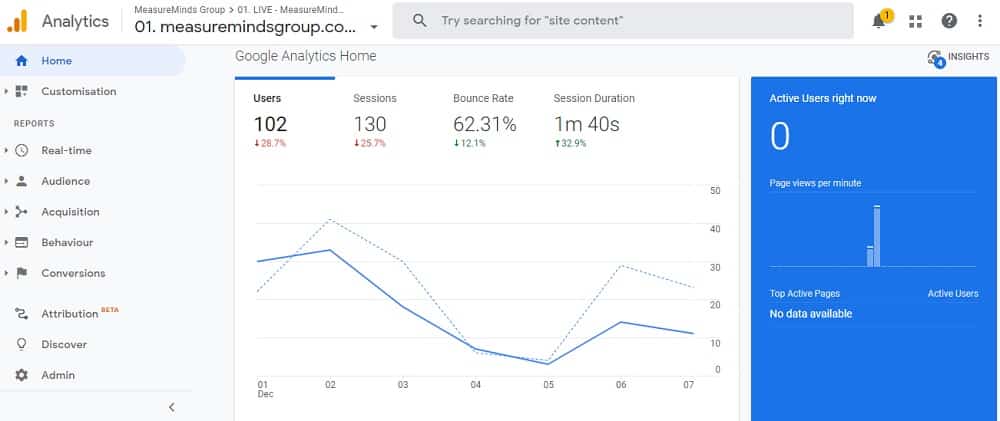
As you might expect user data concerns an individual visitor to your site. When someone visits one of your pages, Google Analytics creates a random and unique tracking code for them. This happens the moment a person arrives on your site.
The time that a user spends on your site before leaving is called a session. When a person leaves your site the cookie is left in the browser. If they return later on, then Google Analytics will recognize that this is a return visitor rather than a new visitor.
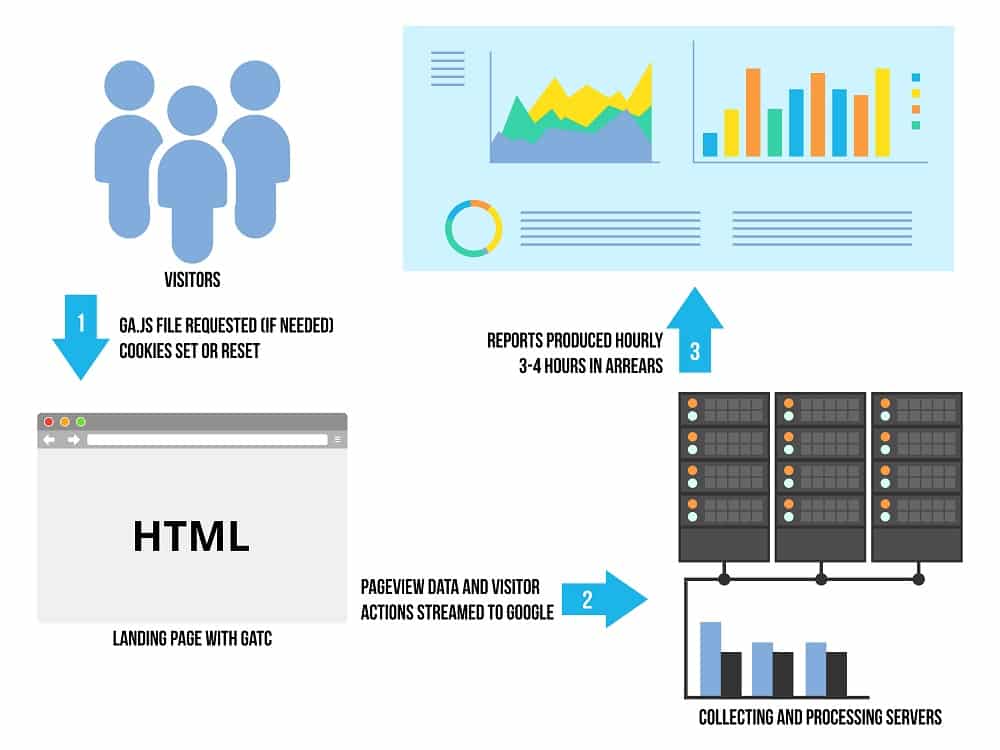
During a session, Google Analytics can collect information based around each of the three main types of hits (pageview hits, event hit, ecommerce hit), and more. This will provide information like time on site, how many pages they viewed, and plenty of other insights.
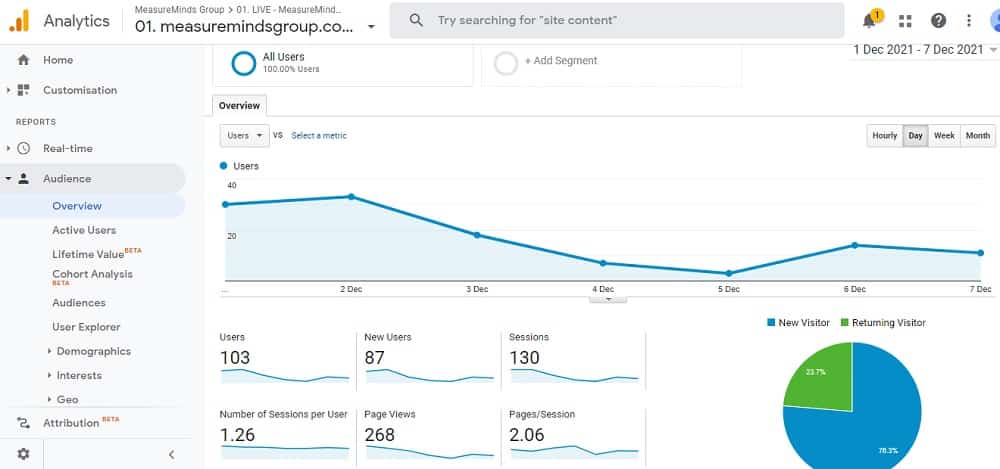
Each user session on your site ends after 30 minutes of inactivity. The point of session data is to give you an insight into what visitors do on your site. If a user returns to your site within 30 minutes, their activity is counted as part of the same session.
How Analytics processes data is a little more complex than that. Or at least, there are other elements involved. There’s no real need to drill down too deeply at this stage. Once you’ve got your head around users and sessions, you can start thinking about the reports Analytics provides.
Generating Reports
Reports are how Google Analytics presents you with the data that it collects and processes. At the most basic level, they’re tables and graphs to help you make sense of the data. Every Analytics report combines dimensions and metrics.
- Dimensions – This is information about the user. For example, a common dimension is what city a person comes from, or what device they were using when they accessed your site.
- Metrics – This is the number of something. For example, the number of visitors to your site or the amount of time people spend on average on your site.
On Google Analytics, reports displayed as tables almost always list dimensions in rows and metrics in columns. For instance, a report combining ‘City’ and ‘Sessions’ might look like this.
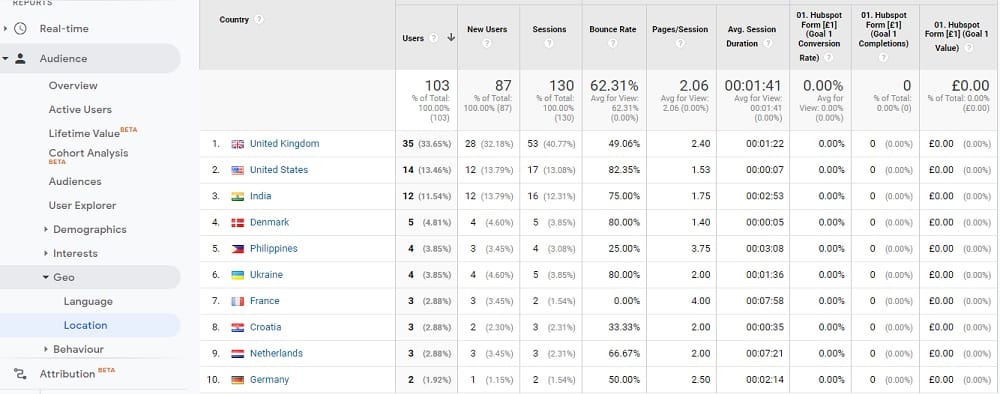
By default, Google Analytics will provide you with a set number of standard reports that combine dimensions and metrics to provide you with insights into your website. If you choose to, you can create your own custom reports that combine dimensions and metrics in different ways.
Hopefully, at this point, you should have a good overview of how Google Analytics works and the kind of information you can access through the dashboard. Let’s now turn to how you can use this information.
What Can You Use Google Analytics For?
Google Analytics can provide you with insights into the performance of your website. The best way to offer you the kind of insights you can get is with a handful of examples. The following are some common insights that Google Analytics can offer. They’re simplified examples but should give you an idea of how valuable a tool it can be.
How’s Your Marketing Working?
Analytics is crucial for understanding how well your different marketing efforts are working. For example, you can view Analytics reports that display the site which a person came to your website from. By default, Google Analytics will helpfully group traffic by source.
The three traffic sources you want to pay most attention to are:
- Organic Search: This is how much traffic you are getting from a search engine like Google. The more traffic you are getting the better your SEO is performing.
- Referral: This is where someone came from a different website to yours. If you are getting traffic from a site then they are linking to your content. It might be worth making friends with that person.
- Direct: This is where a person enters your website name and goes straight to your website. Generally, when you are getting a lot of direct traffic it means you are offering a great service or producing good content.
- Social: These visitors are coming from social media like Facebook, Twitter, etc. If you are getting a lot of followers on social media then you have a good social media strategy.
Below is an example of a report. You can see how dimensions and metrics are used in the report.
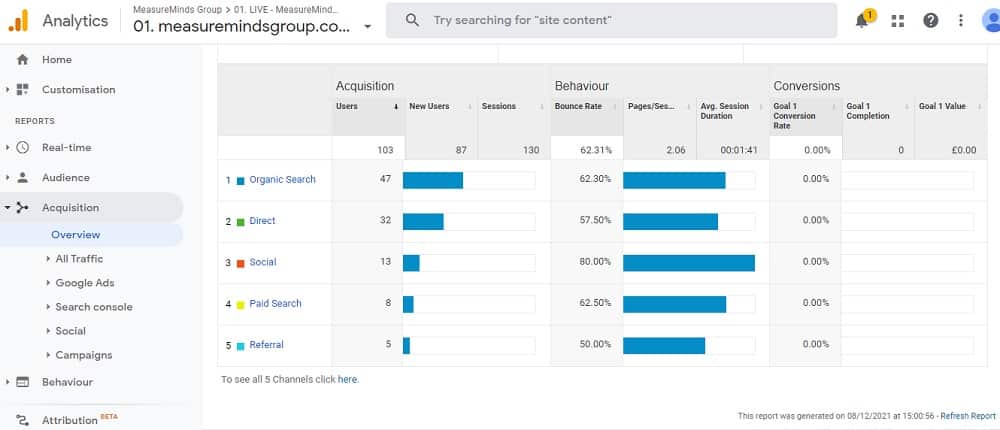
You can break each of these groups down and look at the individual sources. For example, by clicking on referral you would be able to see each individual website that a visitor came from.
By analyzing this information you can gain insights into the effectiveness of your marketing. You can see what is working for you, and prioritize channels on which to focus.
What Parts of Your Site Do or Don’t Users Like?
Tracking user behaviour on your site can also be really useful. Ensuring top-notch customer experience is a priority for all modern businesses. There are a lot of ways you can use Google Analytics to improve the experience your website visitors have. One of the simplest ways of doing this is analyzing time on-page.
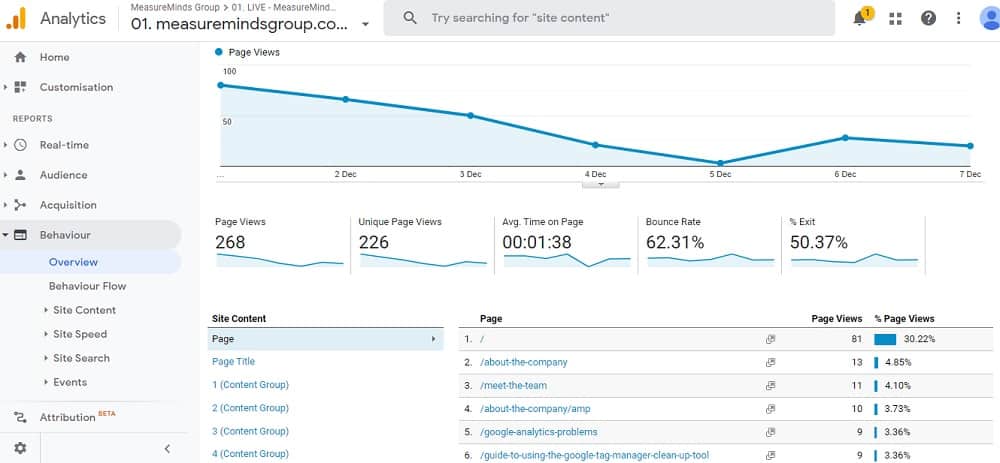
The average time on a page is a good guide to how interesting or useful the content on that page is. If people spend more than one minute on average on a page it’s a good sign. It means that people think the content is useful. If, on the other hand, the time on the page is very low – say 12 seconds – you can assume the information on the page is not useful.
You can use this information to identify content on your site that needs to be improved. Making updates based on these insights will help you provide a better experience for your users. This is just one way that you can use the information Google Analytics provides to analyse what people like or don’t like on your site.
Is Your Site Good at Converting Visitors Into Customers?
Google Analytics also lets you track goals and conversions on your site. A later post will get into this in a bit more detail. At the simplest level, it means you can assess how well your site performs in guiding a visitor through to a sale. Or another action that you want them to take.
You can see and analyse how visitors move through your site, toward your goal. You can then pinpoint the stages along the process where you lose visitors. With that information, you can work to make the process more efficient.
Conclusion
You should now have a good idea of how Google Analytics works. You will hopefully also have some ideas about how you might benefit from using it. This post was just the start of a series focussing on Google Analytics. In the future instalments, you’ll learn more about using the service, and how to get it working for you.
- GTM Tag Diagnostics: Check the Quality of Your GTM Container - 03/07/2024
- Adobe Launch vs Google Tag Manager: GTM vs DTM - 01/07/2024
- The Future of GA4: Where do we go From Here? - 25/06/2024