Google Analytics Device Tracking | Generate Reports in GA4

Google Analytics is the most widely used platform for cross-device tracking and optimising website performance. That’s because of the breadth of user data it allows you to analyse. Now we need to start to understand Google Analytics device tracking.
In addition to analysing how visitors interact with your site, it is essential to consider what devices people use to access it. Device-specific data is vital to have, as people browse the internet on many varied smartphones, tablets, and more. A report from Statista revealed that 60% of people in the UK now rate a smartphone as their favoured device for accessing the internet.
When people use their phones to access a website, they use it differently. As such, sites and apps must be optimised for mobile devices, tablets, and desktops. The only way for you to know how best to optimise your site, and understand how people are using your site, is by finding out the devices your site visitors are using.
This article assumes you’ve already set up cross-device tracking. You’ll learn how to get insights from the Google Analytics devices report. You’ll also learn the ins and outs of the platform’s diverse information about user devices and some of the implications this can have.
Finding cross-device data on Google Analytics
You’ll be able to find device usage data on the platform. Once logged in, you need to click the ‘Reports’ tab on the dashboard and then ‘Tech’ under ‘User‘.
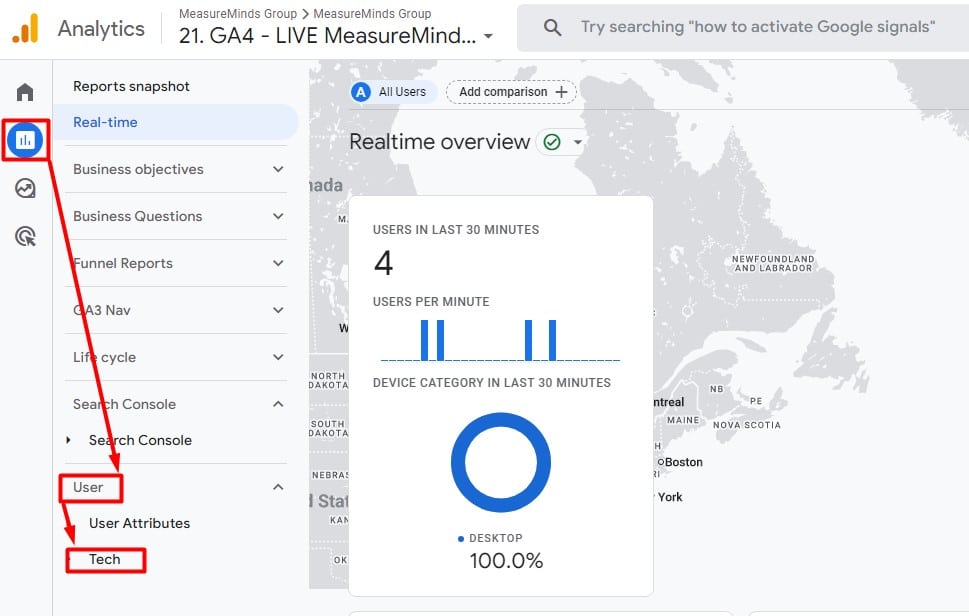
You then have a choice of selecting either ‘Overview’ or ‘Tech details’. When you select ‘Tech details’, you’ll see the following report:
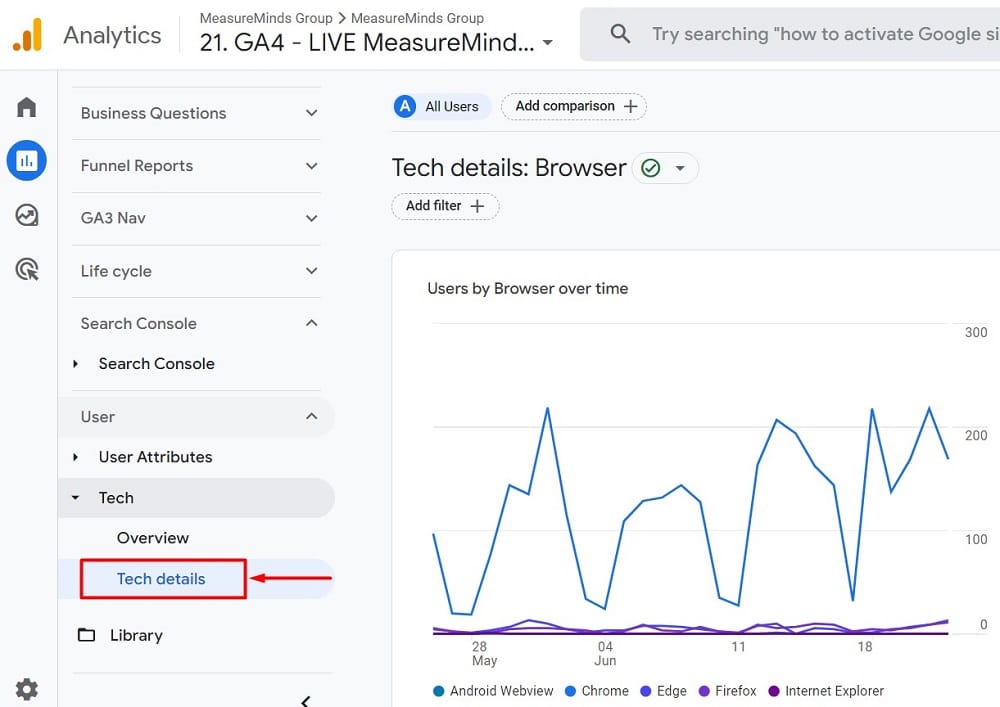
By default, the above report shows you the web browser users use to access your website or app. This information can be helpful for optimising your website or app for the most popular browsers.
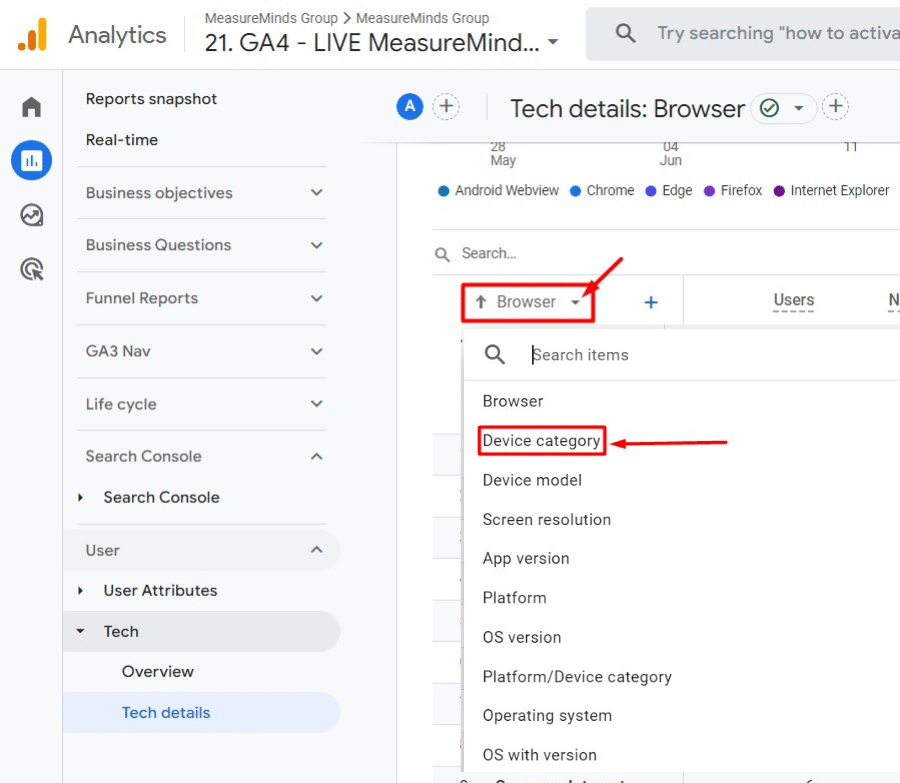
Change from browser to device category dimension
To see cross-device data, click on the Dimension dropdown menu and change the dimension from ‘Browser‘ to ‘Device category‘ from the dropdown.
Once you’re done with the above-mentioned steps, You’ll be presented with a report like the following:
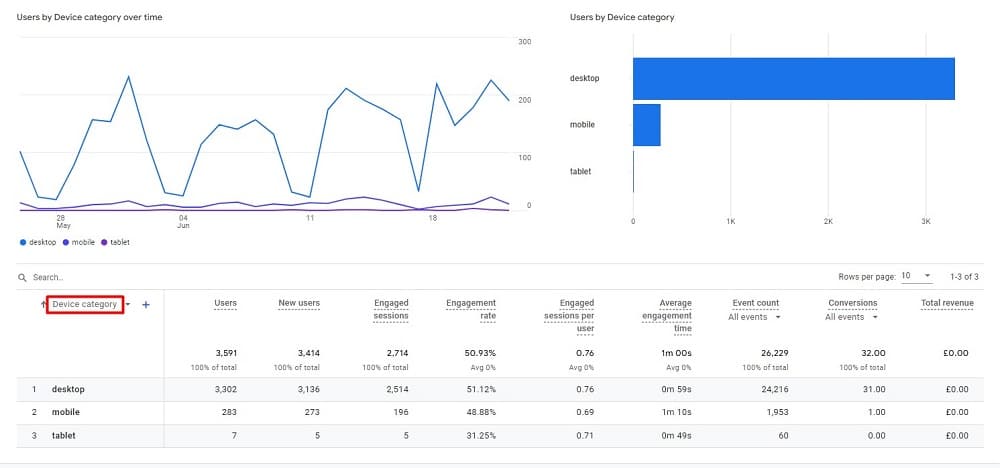
The above google analytics devices report provides a simple breakdown of different devices used as a proportion of your visitors. You can see your number of desktop, mobile, and tablet users. It also displays relevant data regarding how people interact with your website by device.
The initial Google Analytics devices report provides a broad overview of device use. You could dig a little deeper to see some more specifics. For example, You can select the ‘Device model’ rather than the ‘Device category‘ dimension mentioned earlier. It’s on the same list of dimensions.
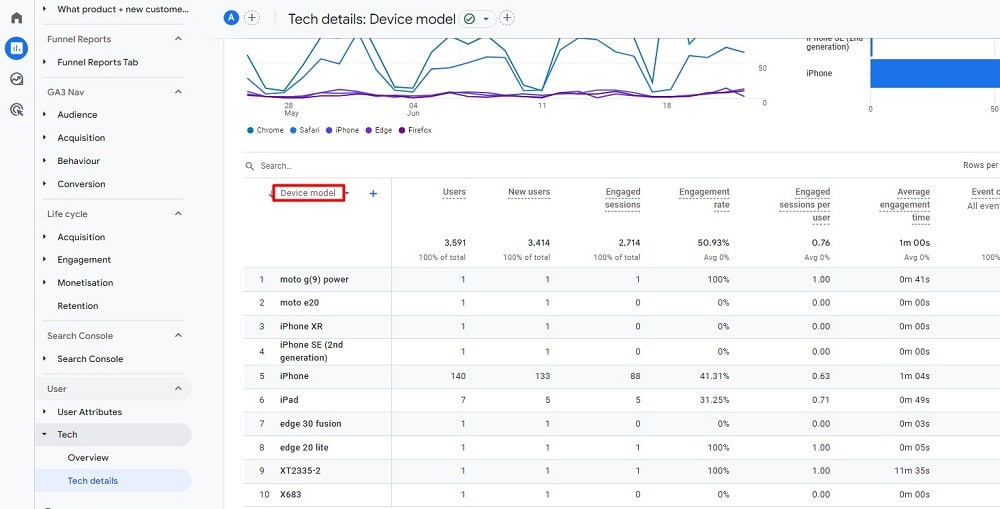
Rather than simply dividing users by type of device, this google analytics devices report splits them by device model. You can see the exact handset or tablet used by everyone who visits your site.
What can you learn from Google Analytics device tracking?
There are many levels to what you can learn from the google analytics device tracking report. The insights it offers will significantly impact any site and its business. Let’s look at some insights you might draw from the report and what they may mean for your business.
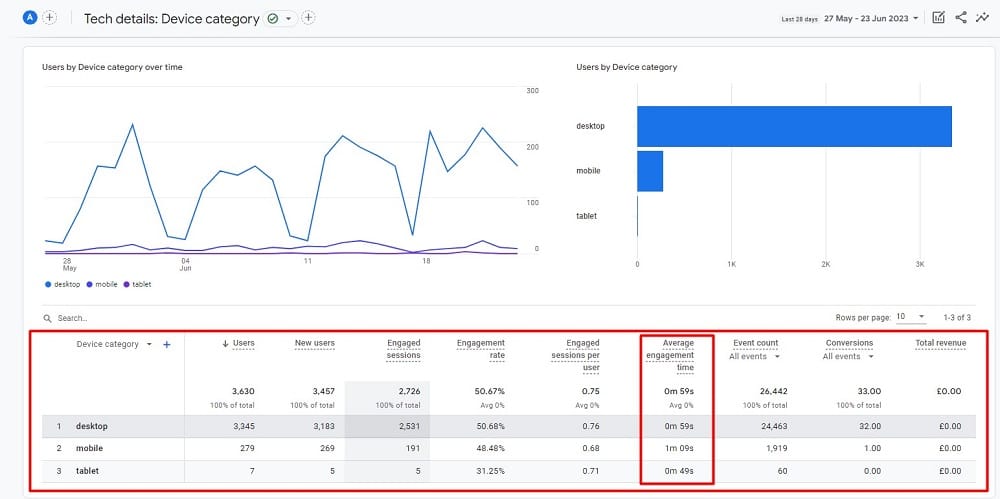
The Tech Details report with the ‘Device category‘ selected as a dimension displays information on how many people access your site and which device they use. You may find that a higher percentage of site visitors are using desktop devices. You might also notice, however, that the time spent on site for a visitor using a mobile phone is higher than desktop.
This is an important insight to gain. It shows you that you may need to spend more time optimising your site for desktop devices. You might have to build a desktop-specific site or de-clutter some pages to suit smartphones and tablets better. Certain site designs, for instance, are more engaging on bigger screens than others.
Engaged sessions, engagement rate, engaged sessions per user, & average engagement time
The google analytics devices report also reveals other essential metrics related to the type of device used. This information can help you draw more detailed conclusions. Some of the most useful metrics include ‘Engaged Sessions’, ‘Engagement rate’, ‘Engaged sessions per user‘, and ‘Average engagement time’.
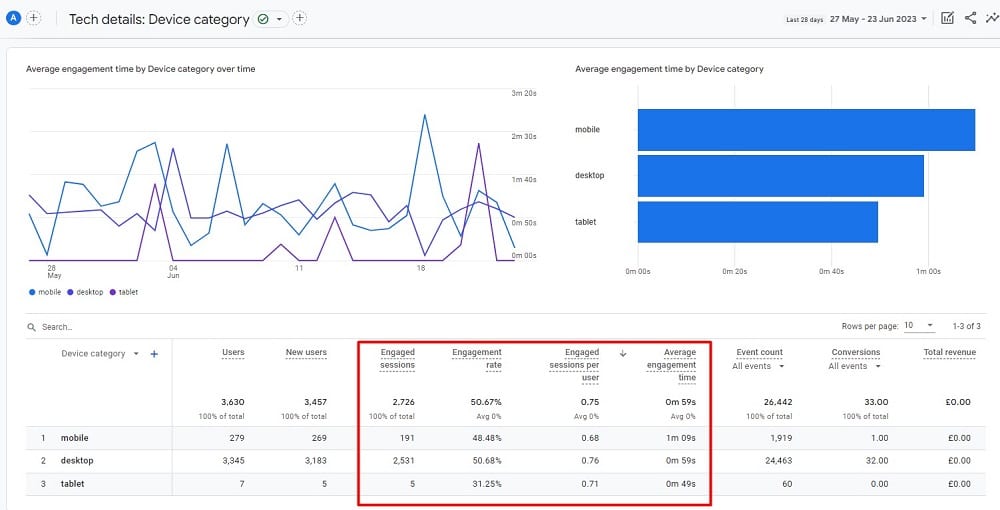
These metrics can be helpful for troubleshooting problems and improving the performance of your website or app. They reveal how your website users behave when they visit the site. A large variance between devices for these metrics can be informative. Let’s take the engagement rate as an example.
The engagement Rate is the percentage of sessions that were engaged sessions. This metric can help you measure the overall level of engagement with your website or app. A high engagement rate means users spend time on your site and interact with your content. A low engagement rate could indicate that you must make changes to improve the user experience.
If you see that the engagement rate is low, you can try to make your website or app more engaging by adding more content, improving the user interface, or making it easier to navigate. If you see that the number of engaged sessions per user is low, you can try to encourage users to return to your website or app by offering discounts, exclusive content, or other incentives. You can use average engagement time to compare different pages or features on your website to see which ones are the most engaging.
Google Analytics devices conversions metric
The “Conversions” metric in the Tech Details report is another crucial metric to note. It measures the number of times users trigger a conversion event. Conversion events are custom events you define as important to your business. For example, you might define a conversion event as a user signing up for your email list, making a purchase, or downloading your app.
In Universal Analytics, the Conversions metric was calculated by counting the number of times users completed a goal. But in Google Analytics 4, there are no goals, so the Conversions metric is calculated by counting the number of times users triggered a conversion event.
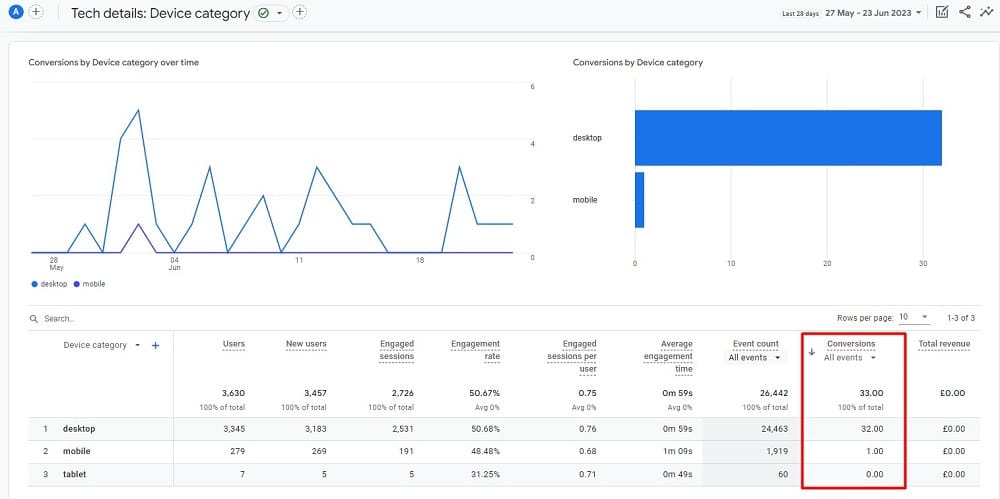
In the above example, desktop users have triggered most of the conversion events. Based on the data presented from the above Google Analytics 4 report, Let’s come up with a few insights:
Desktop conversions
There were 32 conversions recorded from desktop users. Given that there were 3,345 desktop users, this gives a conversion rate of approximately 0.96%. While this might seem low, typical website conversion rates can range from 1% to 3%, depending on the industry and nature of the conversion event.
Mobile conversions
Only 1 conversion was recorded from mobile users. With 279 mobile users, this results in a conversion rate of approximately 0.36%. This is lower than the rate for desktop, which could indicate that your site’s mobile experience may not be as optimised for conversion.
Tablet conversions
No conversions were recorded from tablet traffic. This could be due to a variety of reasons, such as a very small user base, poor tablet optimisation, or simply the target audience doesn’t use tablets that much.
However, it’s important to consider other factors when making this type of analysis. Specifically in regard to how people use a device. For example, people tend to browse the internet more on mobile but then purchase on a desktop or laptop.
Google Analytics devices model report interface
The Google Analytics ‘Tech details’ report with the ‘Device model’ as a dimension offers similar insights but for single device models rather than device types:
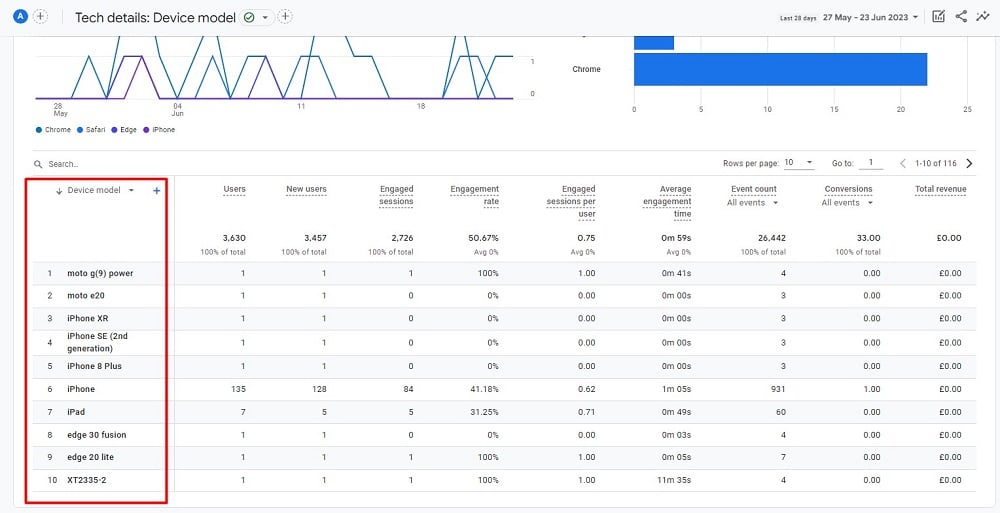
Knowing the exact devices visitors use can help you optimise your site. For instance, you may learn that most mobile device visitors use iPhones. When you try to make your site more mobile-friendly, you can then focus on features suited to iOS.
Optimising for mobile users – UX & AMPs overview
The above has shown the range of insights that Google Analytics device tracking can provide. The information available goes beyond a rundown of the types of devices site visitors use. It is worth taking a more in-depth look at what it means if your site isn’t sufficiently mobile-friendly.
In that area, things boil down to two critical acronyms; UX and AMP. UX stands for user experience. Your site needs to deliver a good user experience for mobile users. Particularly if they make up a high proportion of site visitors. Those users will spend less time on your site if it doesn’t.
A key element of mobile UX is how long it takes pages to load on mobile devices. Modern internet users are not a patient bunch. They will likely leave the site if a page doesn’t load immediately. That’s where Accelerated Mobile Pages (AMPs) come in.
AMPs are designed for almost instant loading on mobile devices. As such, they deliver a smooth, high-quality mobile UX for site visitors. If your site’s Google Analytics mobile report shows a high bounce rate for mobile users, AMP implementation is something to consider.
Conclusion
Google Analytics devices report can offer you a lot of insights regarding how people interact with your site. One key way it can help you assess site performance is by providing details on the type of devices visitors use. Knowing how visitors split between mobile, tablet, and desktop users is critical. It helps you identify whether you need to focus more on conversion optimisation for a specific device type.
The Analytics Mobile report can also provide you with more detailed insight. You can learn if your site converts better on some devices through metrics such as ‘Engagement rate’, ‘Conversions’, and more. You can even discover if any mobile optimisation needs to focus on specific devices.
This post should have shown you precisely where to get those invaluable insights. It should also have demonstrated how and why those insights matter to your business. It’s now up to you to explore your Analytics and elevate your customer experience.
- Top 24 Google Analytics Chrome Extensions & Sheets Add-ons - 21/05/2026
- Best Consent Management Platforms (CMP) - 19/05/2026
- Google Signals and Consent Mode: What This GA4 Change Really Means - 23/04/2026