A Guide to Bounce Rate & Engagement Rate in Google Analytics 4

As some of you start migrating to Google Analytics 4 (GA4), you will naturally start to see that it is very different from Universal Analytics (UA or GA3). It’s left people asking a lot of questions. As Google originally left out bounce rate, one of those questions being ‘what happened to bounce rate in Google Analytics 4’. But GA4 bounce rate is now here.
We will cover, what bounce rate and engaged sessions are, how you can find bounce rate in GA4 and what other metrics are useful for your landing pages.
Where is GA4 bounce rate?
For those of you already familiar with bounce rate and engagement rate and looking for a quick answer, bounce rate is still available and can be added to reports easily. It’s just defined slightly differently to how it used to be in Universal Analytics.
How to add GA4 bounce rate to reports
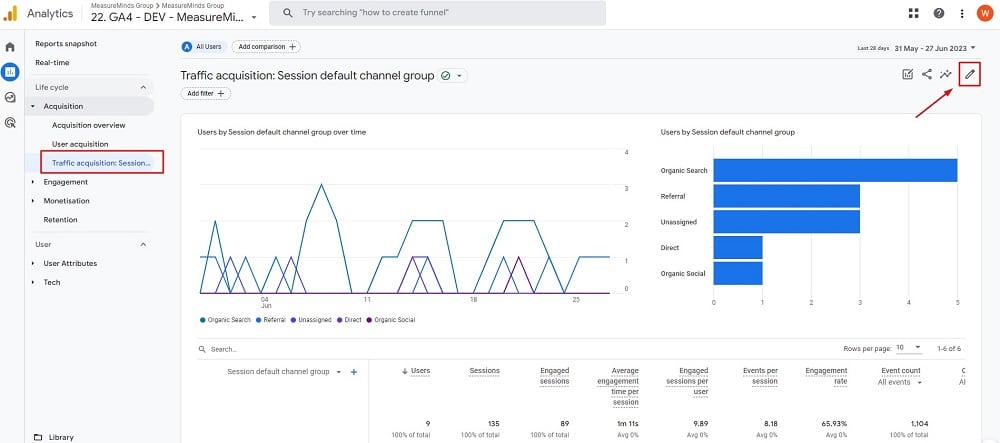
1. Go to a report and select customise reports
Navigate to the GA4 reports you want to add bounce rate to. I’m using the traffic acquisition report in this example. Then select ‘customise reports’.
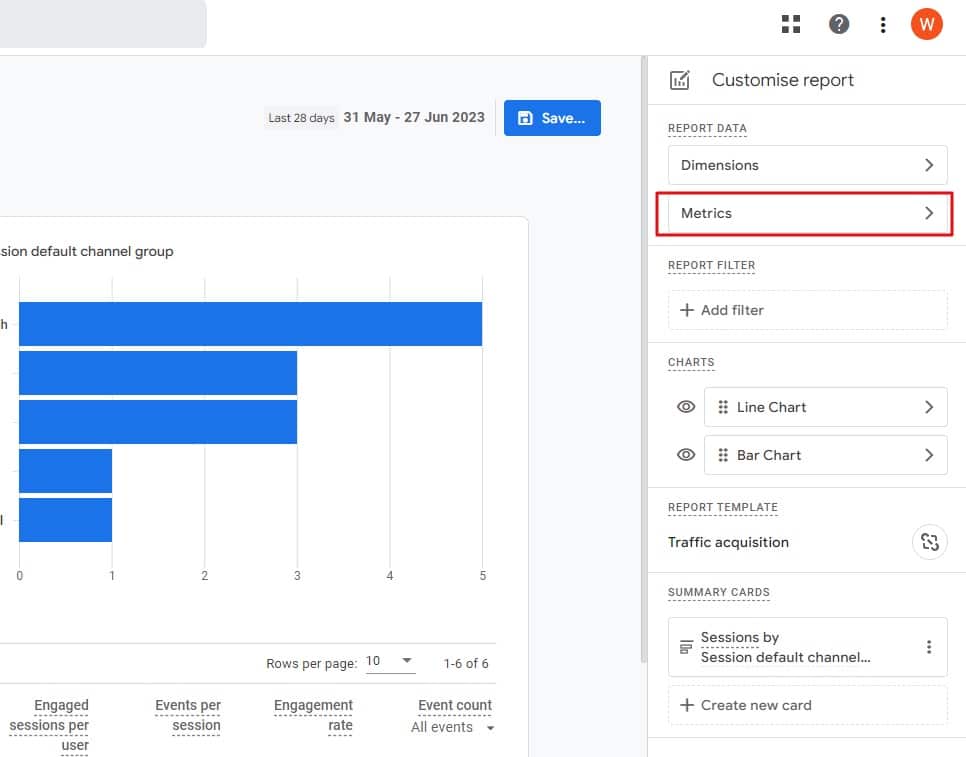
2. Select metrics from the customisation tab
Now select metrics from the customisation panel.
3. Click add metric and add GA4 bounce rate
Click add metric at the bottom and then type in bounce rate. Select bounce and click the blue ‘apply’ button.
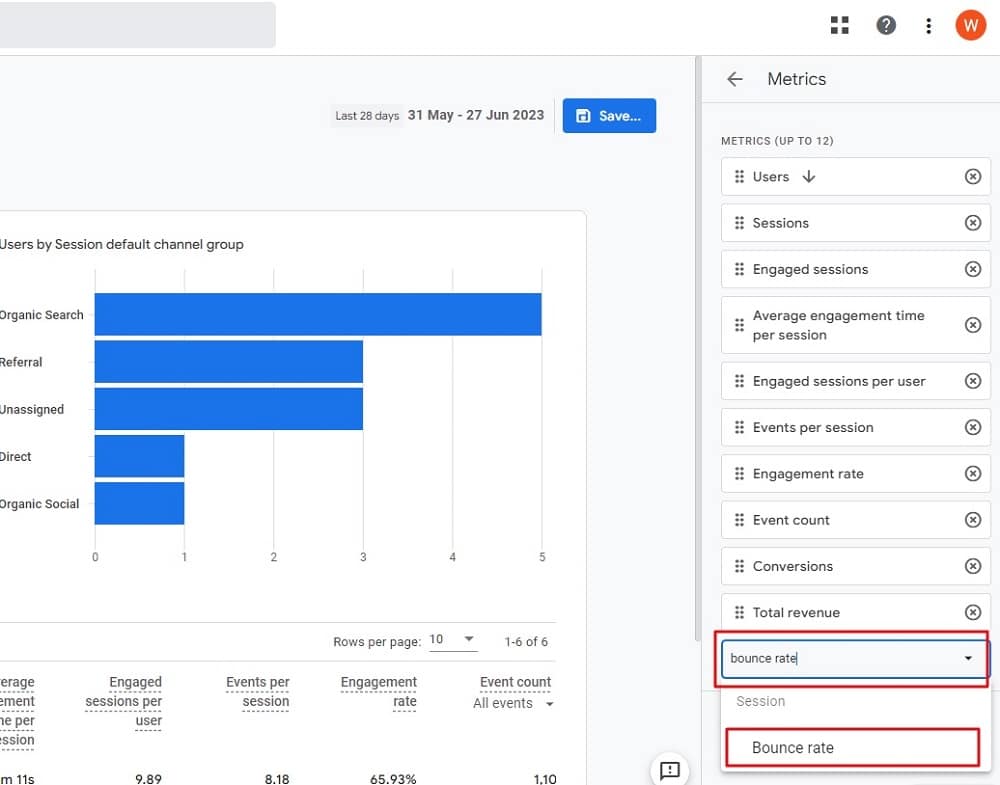
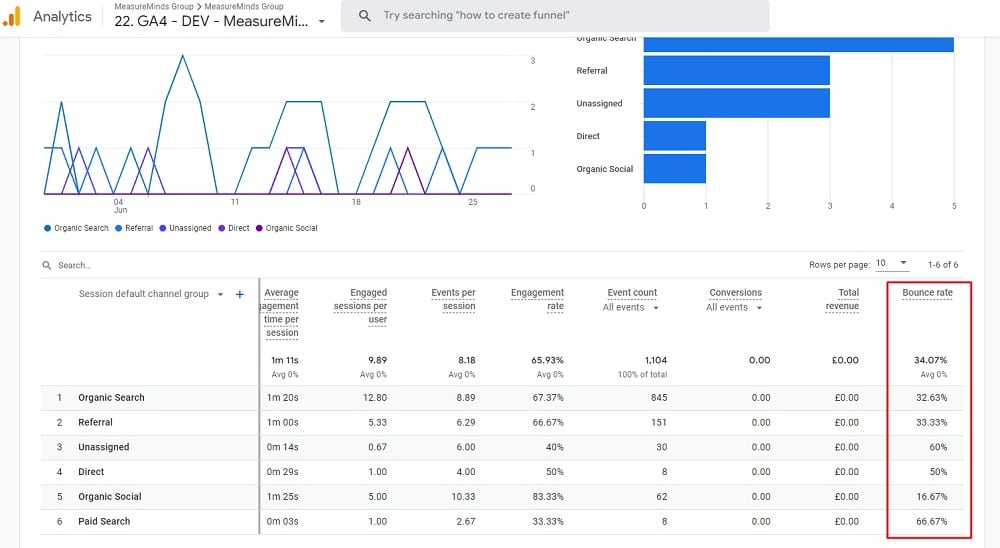
GA4 bounce rate should now be in your reports as long as you haven’t reached the limit of 12 metrics. You can move its placement around in tables by clicking the six dots next to where it says bounce rate in the metrics customisation panel, once it has been added.
If there is a report that doesn’t include bounce rate or engagement rate, or any other metric for that matter, than you can go through this same process to add them to individual reports. Just as long as the data you’re analysing is appropriate for that metric.
For those of you that don’t know what bounce rate is, aren’t familiar with engagement metrics and don’t know the difference between GA4 and UA bounce rate, please read on.
What was bounce rate in Universal Analytics?
Bounce rate in Universal Analytics was defined by the percentage of sessions that only had one pageview. Anybody that visited your website and left was categorised as a bounce.
What is GA4 bounce rate?
Before we can explain bounce rate, you need to have an understanding of how sessions work in Google Analytics 4.
What are sessions?
Sessions are the way in which GA tracks user interactions on your site. Like Universal Analytics, Google Analytics 4 records each of a user’s interactions from the moment they land on your site, up until the moment they leave it.
What are engaged sessions?
The difference between Google Analytics 4 and Universal Analytics when it comes to bounce rate, is the introduction of ‘engaged sessions.
A pages session is counted as an engaged session when a user has a conversion event, stays on the page for 10 or more seconds (this can be changed in settings) or has 2 or more screen or page views.
What is bounce rate in Google Analytics 4?
In Google Analytics 4, bounce rate is the percentage of sessions that weren’t engaged sessions.
Bounce rate is something that you should be concerned about. You want to be creating engaging content that promotes your brand and hopefully encourages users to explore more of your website or come back at a later time.
What is engagement rate?
GA4 bounce rate initially wasn’t part of Google Analytics 4’s rollout. We instead had engagement rate. Which is simply just the inverse of bounce rate. It is the percentage of sessions that were engaged. Where again, an engaged session is a session that:
- Lasted more than ten seconds (this can be changed to 30).
- Contained a conversion event (when a user completes an activity that is important to your business).
- Contained views of more than two web pages.
Is UA or GA4 bounce rate better?
The way that GA4 measures engagement means that arguably GA4 bounce rate is a lot better. This is because you have a broader set of rules that identify engagement in GA4.
Yes someone may leave the page after visiting it, but that doesn’t mean people weren’t engaging with your content. UA’s bounce rate was binary, whereas GA4 is multi-dimensional.
You could argue that UA’s bounce rate was better because of that though. You can’t split how people actually engaged, whether it was because they spent 10 seconds on the site, visited 2 or more pages or made a conversion, despite those being very different types of engagement that give different insights. But these types of engagement can be analysed in different ways using different metrics in GA4 anyway.
UA bounce rate was good for showing what types of content drove people to keep exploring your site ONLY. Not that GA4 bounce rate doesn’t do that, it just mixes it in with other types of engagement. But this can still be seen by analysing the ‘views per user’ metric in GA4
So really, GA4 bounce rate is better.
What other engagement metrics are there?
Along with the ‘Engaged Sessions’ measurement, Google has introduced a couple of other metrics built to calculate engagement. These include:
Engaged sessions per user
This is calculated by dividing the number of engaged sessions by the number of users.
Engagement time
This measures the amount of time that a user was engaged on your website or app.
Average session duration
The total time of all sessions divided by the number of sessions.
Average engagement time
Average engagement time per active user.
Why is bounce rate useful?
A particularly useful feature is the ability to see our bounce rate in relation to our marketing campaigns and different channels. When you’re trying to bring new traffic to your site, you obviously want as low a bounce rate as possible.
In short, bounce rate is an extremely handy tool in informing how successful your website is at engaging visitors. It helps you answer these sorts of questions:
- What types of content are most engaging?
- Where does our most engaged audience come from before entering the site?
- Which device are people most engaged on? Do we need to optimise or fix a problem for that specific device?
In short, don’t panic!
Bounce rate hasn’t gone. When you look more closely at the features included in the engagement rate metric, you’ll see that the GA4 bounce rate is better.
Recommendation: one mistake not to make when migrating to GA4 is forgetting to change session timeout from 10 seconds to 30 seconds. Having the default 10 seconds can make your engagement look worse than it is.
Only make this change when you initially migrate though. If you already have lots of data, it’s not worth skewing your data.
Want more?
Take a look at our blog for more tips on Google Analytics and more.
- Top 24 Google Analytics Chrome Extensions & Sheets Add-ons - 21/05/2026
- Best Consent Management Platforms (CMP) - 19/05/2026
- Google Signals and Consent Mode: What This GA4 Change Really Means - 23/04/2026