How to Create Landing Pages Report In Google Analytics 4

While GA4 has a default “Pages and screens” report, many marketers and analysts prefer to build a custom Landing Page report instead. The default “Pages and screens” report doesn’t isolate true entry pages or tie them clearly to conversions, traffic sources, or session-specific behavior.
A custom report gives more control, clarity, and flexibility for analyzing how users first interact with your site.
There are two methods of creating a landing page report in Google Analytics 4:
Method -1 (suggested):
The first method: use the exploration report template. This option provides pre-built reports. You can customize this to your needs.
Method -2:
The second method for creating its report is customizing the pages and screen report. This option isn’t ideal for making it as it often suffers from tracking issues.
Creating Landing Pages report of Google Analytics 4 by the exploration report template.
Here is the step-by-step guide to making a landing pages report of google analytics 4 by the exploration report template:
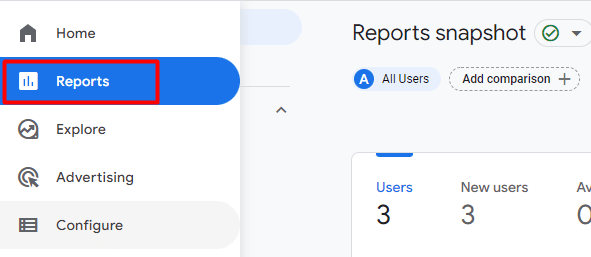
Step-1: Login to your Google Analytics 4 account and click on the “ Explore tab.”
Step-2: Click on the Blank report template.
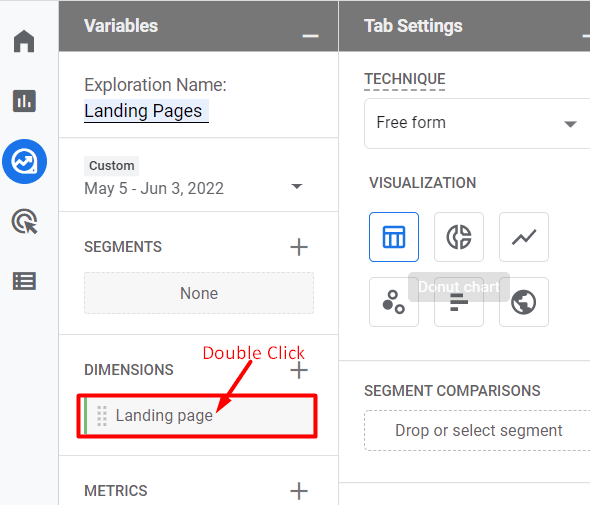
Step-3: Give your report template name ‘Landing pages.’

Step-4: Click on the + button next to “ DIMENSION.”
Step-5: Find the Landing Page dimension, click on the checkbox next to it, then click Import.
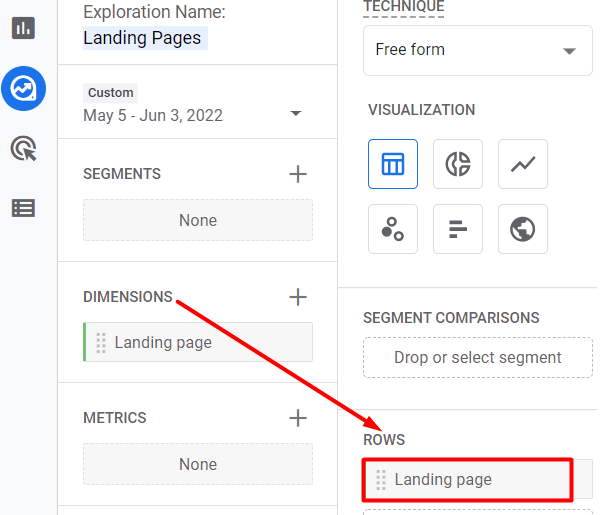
Step-6: Double-click the landing page dimension to automatically add it to the Rows section.
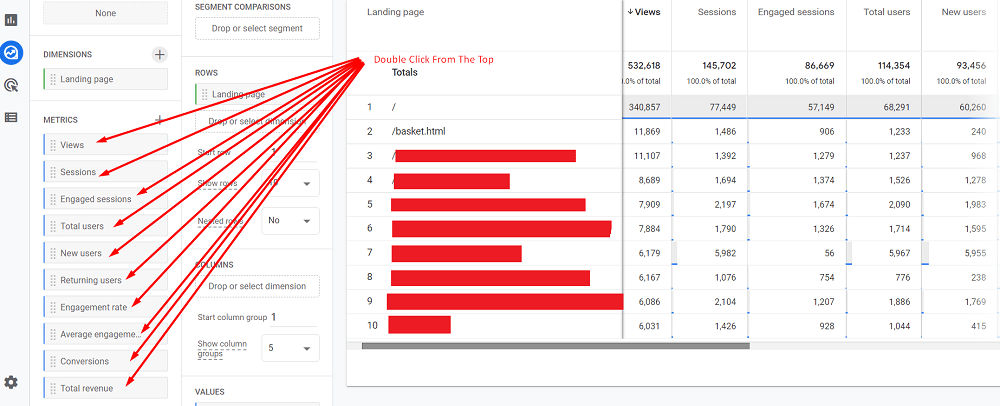
Step-7: Click on the + button next to “METRIX”.
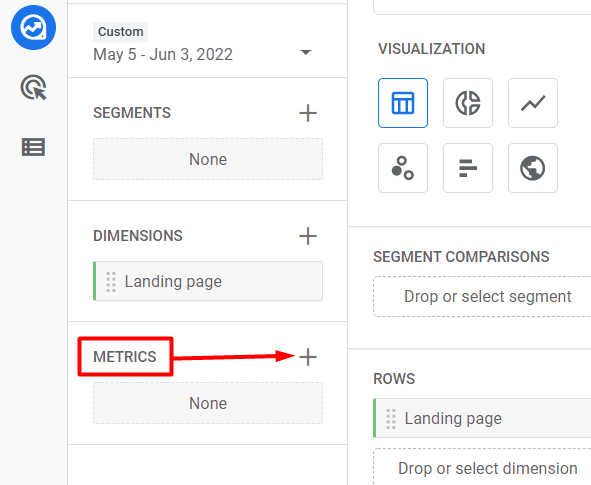
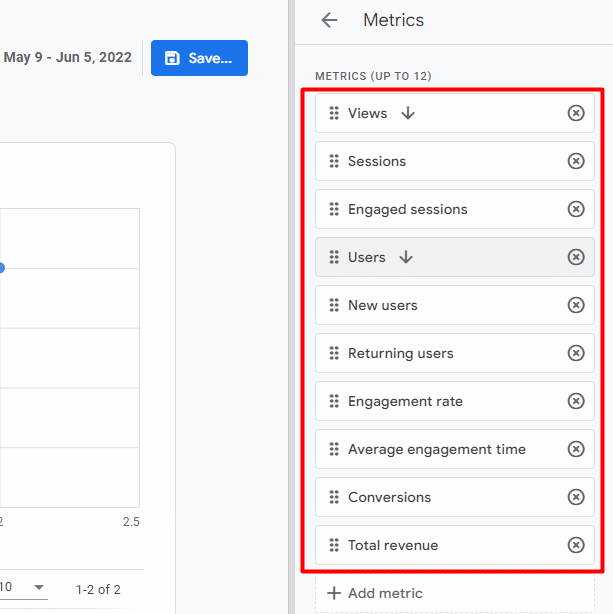
Step-8: Then, add the following metrics one by one.
- Views
- Sessions
- Engaged sessions
- Total users
- New users
- Returning users
- Engagement Rate
- Average Engagement Rate
- Conversions
- Total Revenue
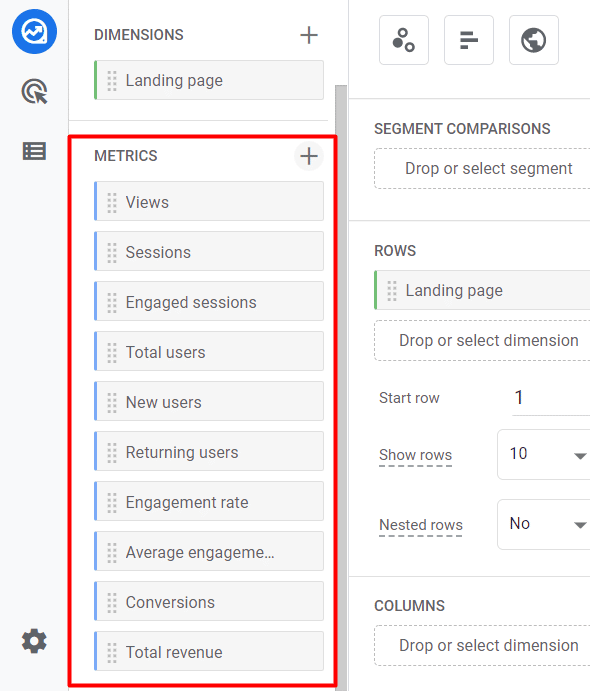
Step-9: Double click on the indicators; starting from the top, they are automatically added to the blank canvas on the right
That is how you can create a report in Google Analytics 4 by the exploration report template.
Creating Landing Pages Report by customising the ‘Pages and Screenshot’ report.
Note: This is not suggested for the Standard Report Template. It is another way of creating a report template.
Here is the step-by-step guide for creating landing page reports by customising the pages and screen reports:
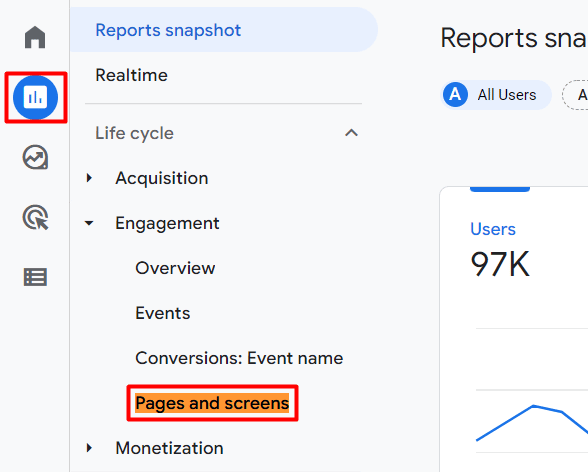
Step-1: Navigate to the “pages and screens’ report in your GA4 features
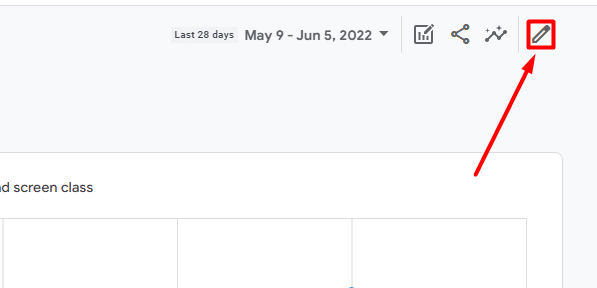
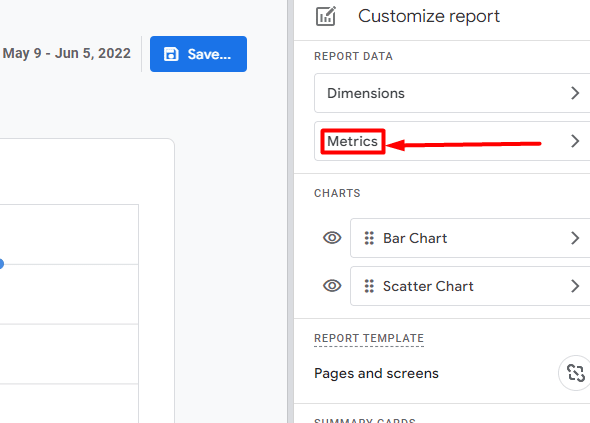
Step-2: Search and click on the pencil icon on the right side of your screen for customising this report.
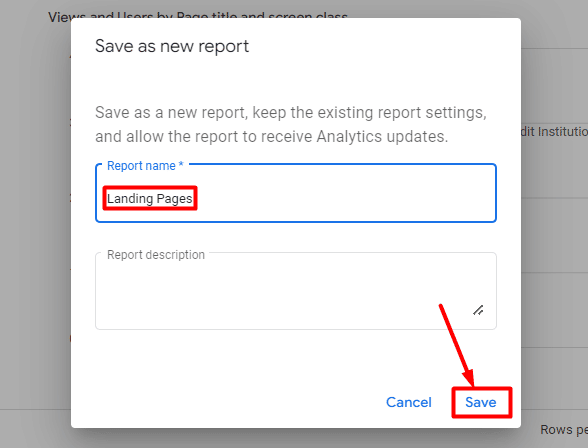
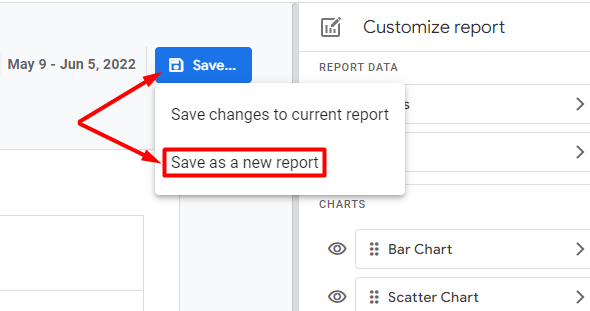
Step-3: Click on the ‘Save..’ button and then click on ‘Save as a new report’.
Step-4: Give your report template the name ‘Landing pages’ and save it.

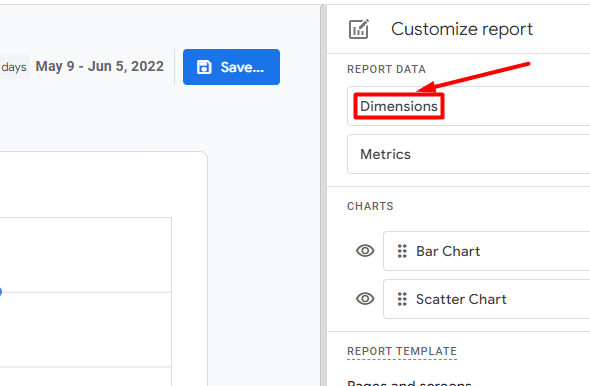
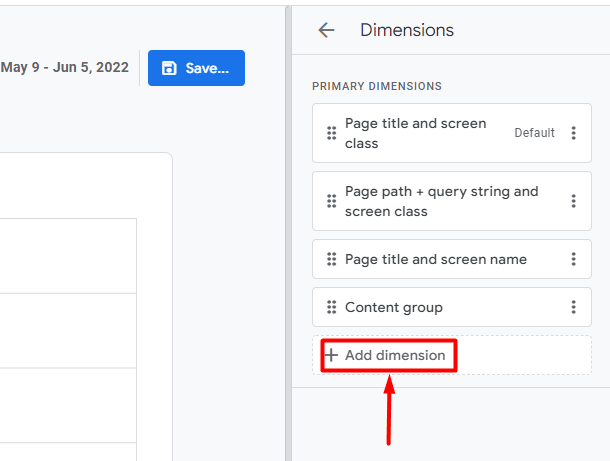
Step-5: Click on the ‘Dimension’ button.

Step-6: Click on the ‘+ Add dimension’ button.
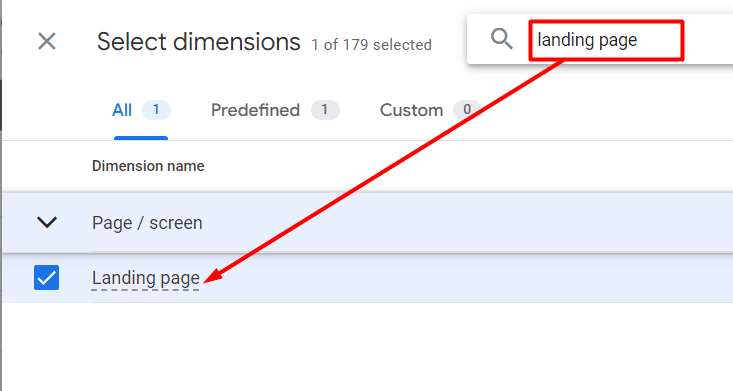
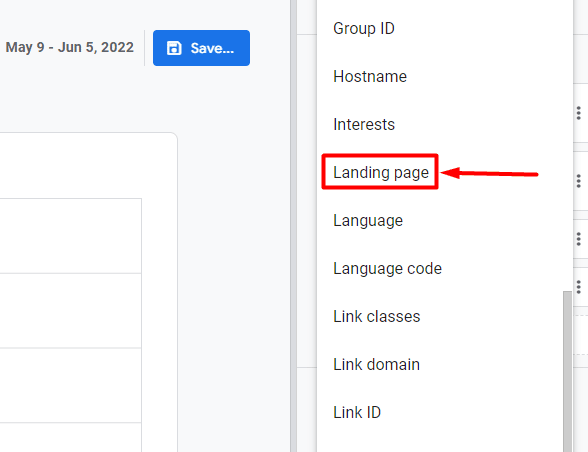
Step-7: Search and Click on ‘Landing page dimension’.
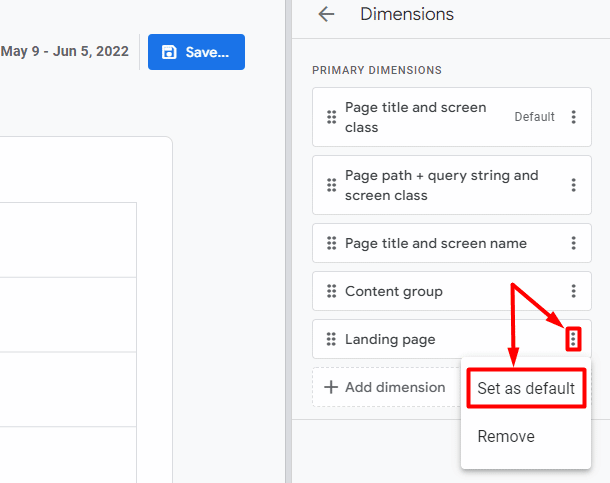
Step-8: Click on the menu next to ‘Landing page dimension’ and then click on the ‘set as default’ button.
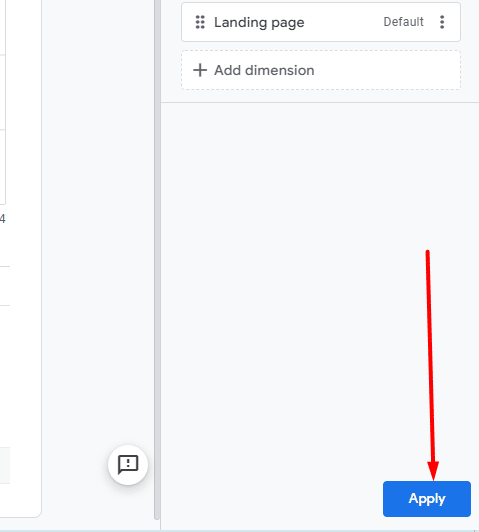
Step-9: Click on Apply button.
Step-10: Click on the metrics button.
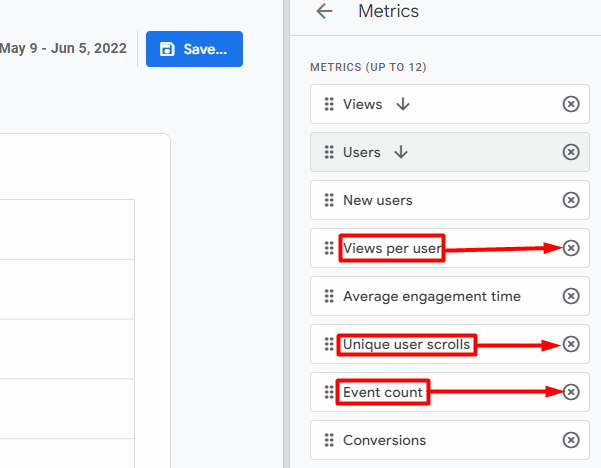
Step-11: Remove the following metrics:
- View per user
- Unique user scroll
- Event count
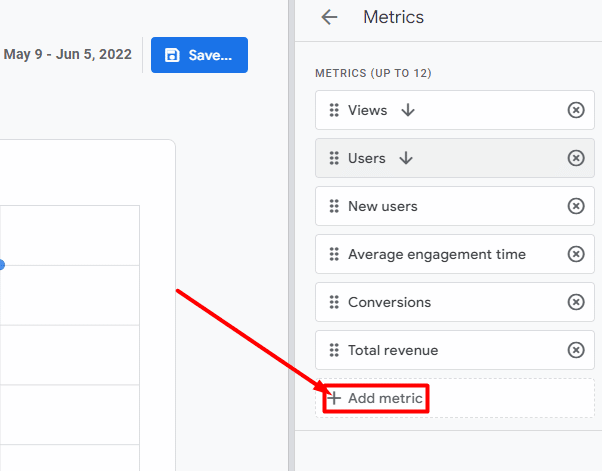
Step-12: Click on the ‘+ Add metric’ button.
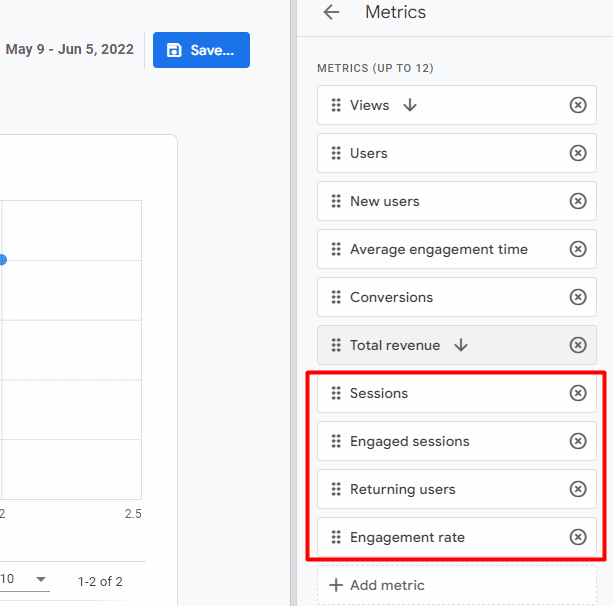
Step-13: Search and add the following metrics:
- Sessions
- Engaged sessions
- Returning users
- Engagement Rate
Step-14: Rearrange the following metrics in order one by one:
- Views
- Sessions
- Engaged sessions
- Total users
- New users
- Returning users
- Engagement Rate
- Average Engagement Rate
- Conversions
- Total revenue
Step-15: Click on Apply button.
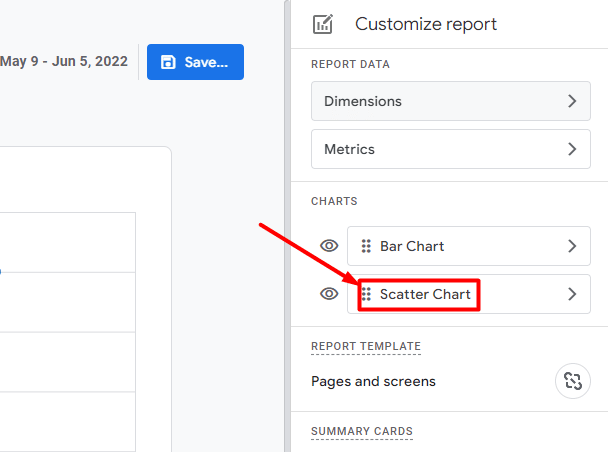
Step-16: Click on the ‘Scatter chart’ button.
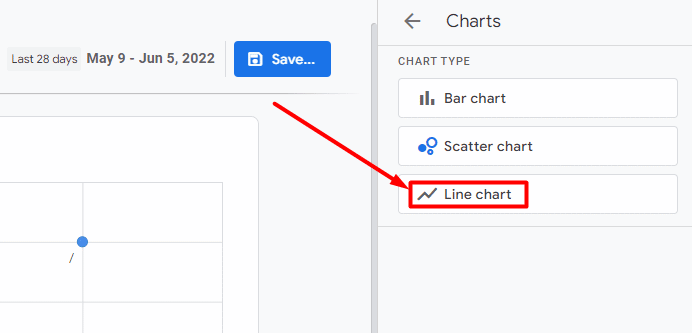
Step-17: Click on the ‘Line chart’ and Click apply button.
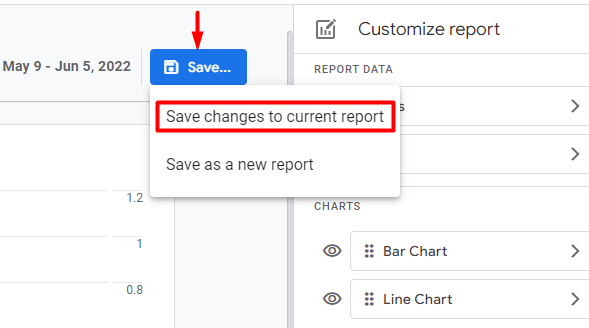
Step-18: Click on the Save button and then click on the ‘Save changes to current report’ button.
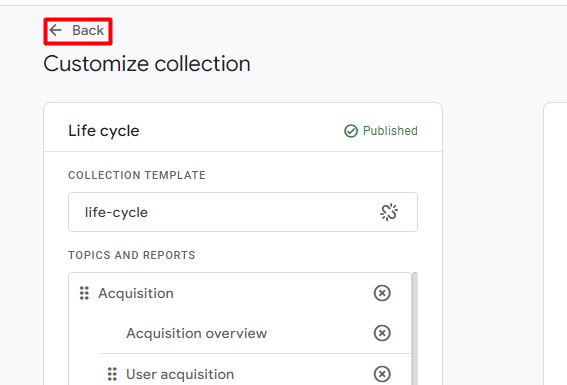
Step-19: Click on the ‘Back’ button.
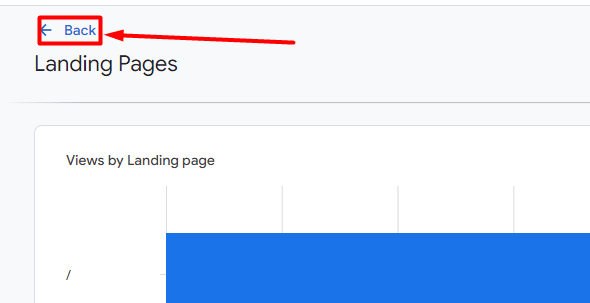
If we want to add our new report to the standard GA4 report, we would need Landing pages to report to a collection.
Step-20: Click on the report and refresh the report history.

Step-21: Click on the Library Tab and Then Click on the ‘Edit Collection’
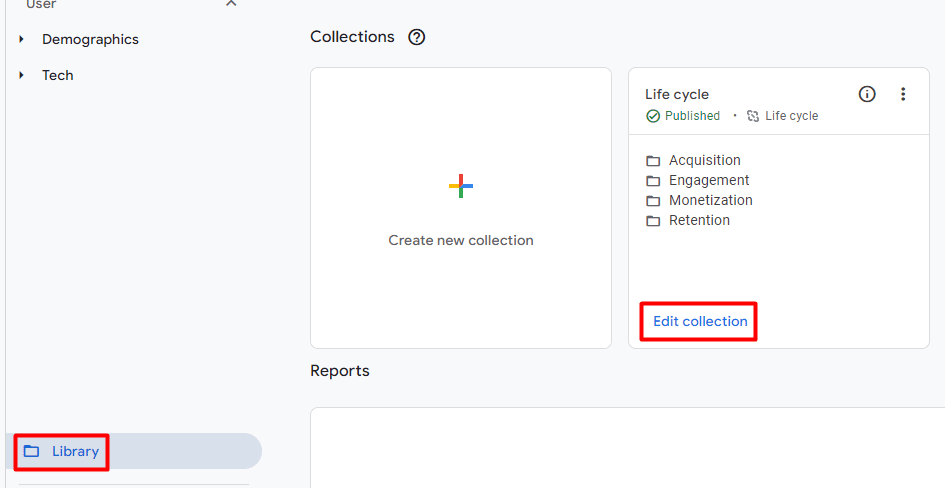
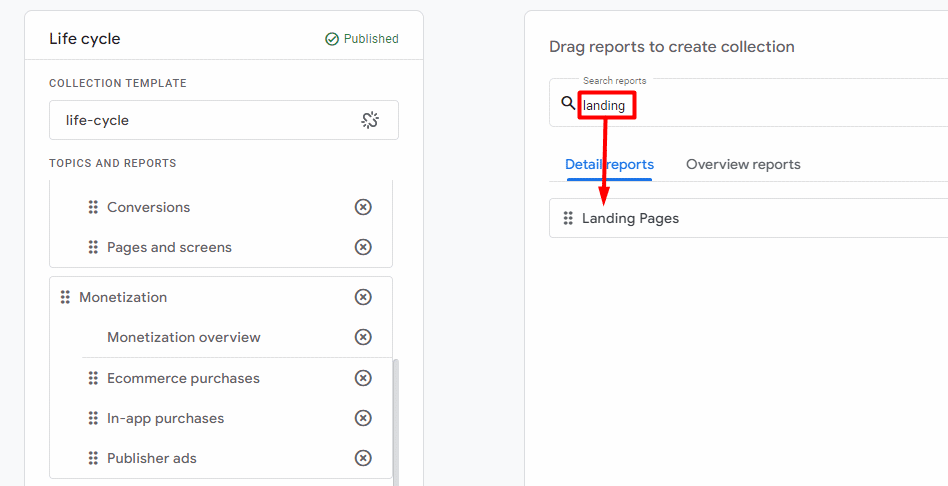
Step-22: Find the Landing pages report.
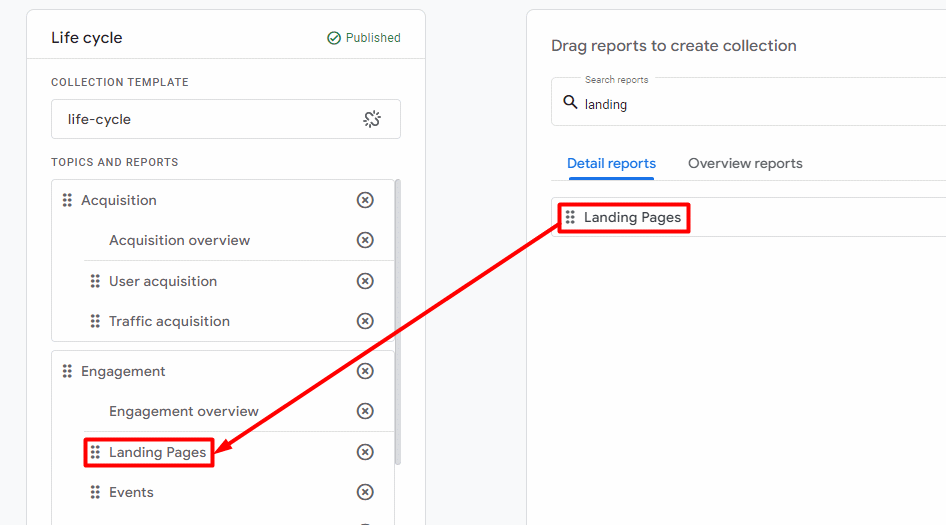
Step-23: Drop the landing pages report under the ‘Engagement Overview’ and save it
Step-24: Click on the ‘Back’ button.
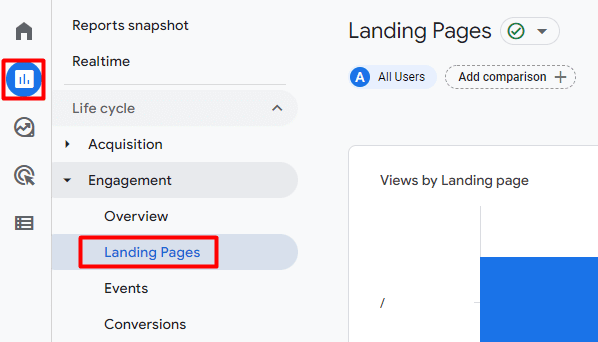
Now you can see the new report listed under the ‘Engagement menu’.
In conclusion, if you have recently gone through GA4 migration and want to track your website landing pages in Google Analytics 4, you have two options. You can either use the exploration report template or customise the Pages and Screen report. Whichever method you choose, make sure you track at least the following metrics: unique visitors, page views, conversions (either total or per visit), and conversion rate.
Want more tips like this? Then don’t forget to subscribe to our monthly webinar so that you can stay up-to-date on all the latest Google Analytics news!
- Top 24 Google Analytics Chrome Extensions & Sheets Add-ons - 21/05/2026
- Best Consent Management Platforms (CMP) - 19/05/2026
- Google Signals and Consent Mode: What This GA4 Change Really Means - 23/04/2026