How to connect GA4 with BigQuery: GA4 BigQuery Guide

Using BigQuery with Google Analytics 4 (GA4) opens a world of opportunities that will help you take advantage of multiple sources of data to influence marketing and business decisions. So we wanted to show you how to connect Google Analytics 4 with BigQuery.
What is BigQuery?
We created a webinar on GA4 BigQuery and getting to know the two if you’d prefer to watch something for a more introductory dive:
To summarise: If you’re running a big business, you’re likely gathering data from all kinds of places: your app, website, email, or marketing campaigns. With all these data sets, you need a central location to store everything. Managing this can be costly, considering not just storage but also maintenance and security.
BigQuery is a fully managed enterprise cloud data warehouse that efficiently handles and analyses data. It includes features like machine learning, geospatial analysis, and business intelligence. With its serverless architecture, you can run SQL queries to answer your organisation’s most significant questions without worrying about infrastructure management.
Setting up and working with Google Analytics & BigQuery
If you’re running a big business and managing lots of data. Now is probably the time to get set up with BigQuery. If you just want to practice, try utilising the BigQuery sandbox.
Step 1: Set up your account
To begin, head to cloud.google.com/bigquery. From here, you can begin the process of setting up your account.
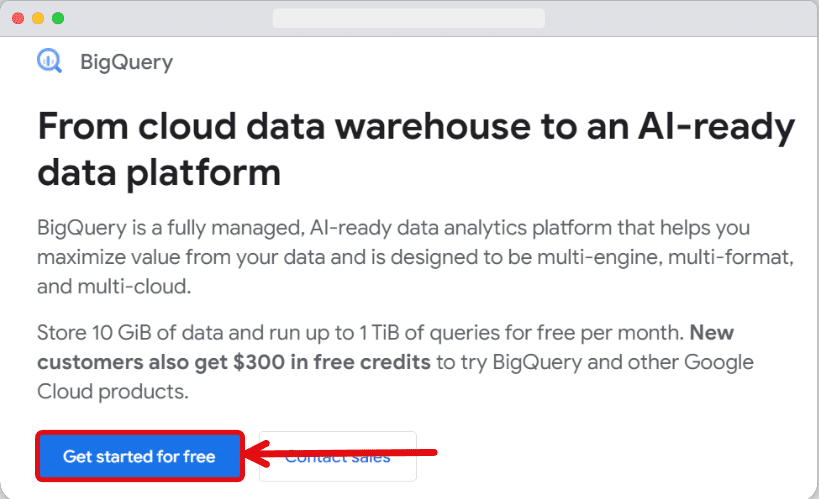
You’ll notice some text notifying you that, as a new customer, you get $300 worth of free credits to spend on Google Cloud. This applies during the first 90 days of you using the application.
The set-up will ask for your credit card details. Please note, even if you use all of your credits, or time runs out, Google will ask if you want to pay for continued use. It won’t charge you automatically.
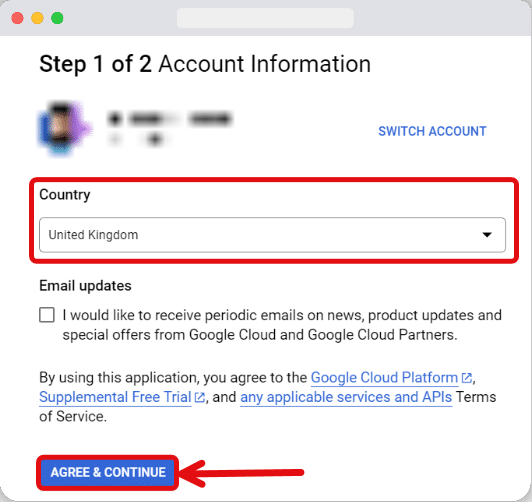
From the next window, select your “Country” from the drop-down. Then, click “AGREE & CONTINUE” to get into the step 2.
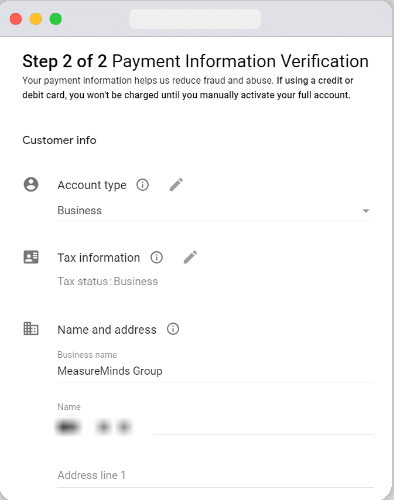
In the next step, add your payment information & click the button “START FREE” from the button once you’ve included all the information.
Step 2: Set up your first project in BigQuery
Once you’ve got through the initial setup and finished filling in your details, you’ll be met with the BigQuery interface. It’ll look something like this.
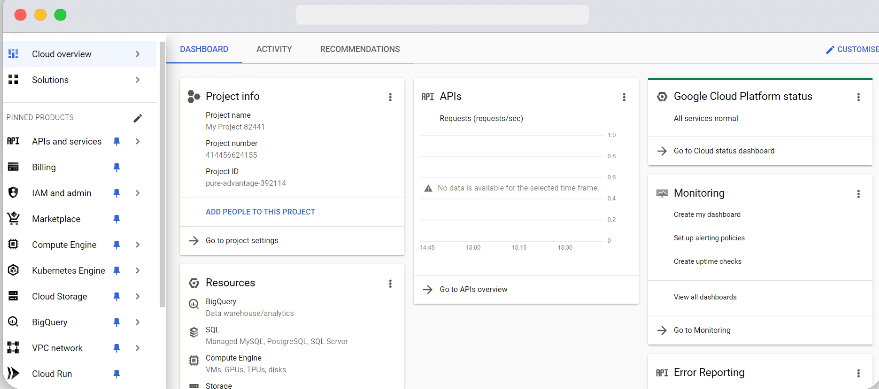
There is a whole world of options here. For now, head to the top right and click on the drop-down list of projects.
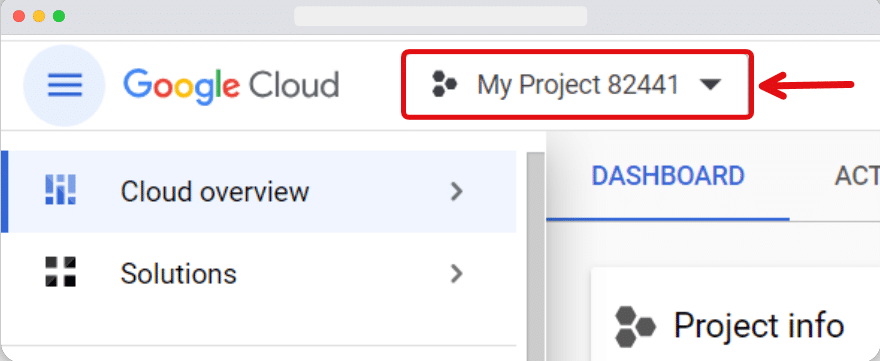
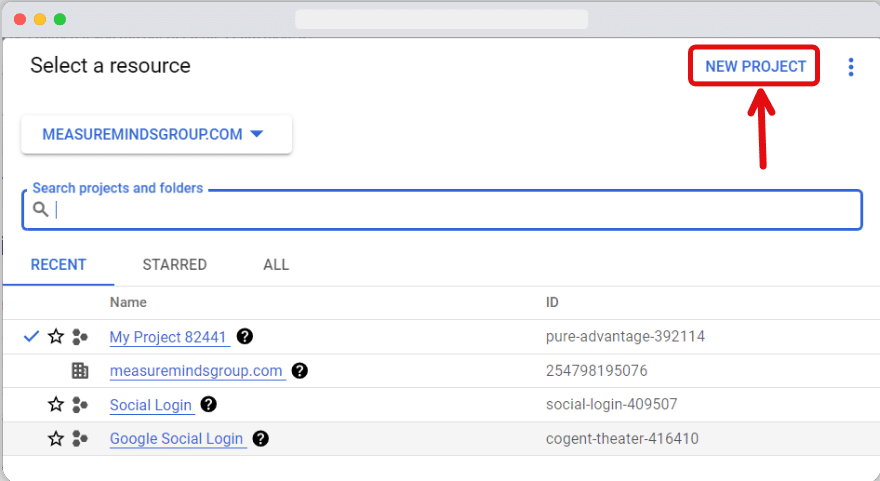
This will bring up a pop-up menu. Normally this is where you’ll see all the projects you’ve got on the go. Since we are starting from scratch, we’ll hit ‘New Project’ in the top right.
And there you have it, you’ve set up BigQuery and started your first project.
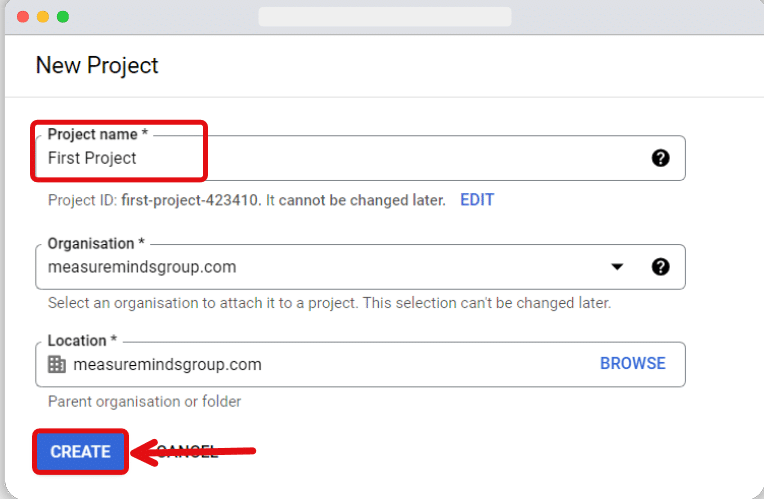
From the ‘New Project’ screen you can name your project and input your organisation name. We’ll name our project ‘First Project’ but you can name yours whatever you want. When you’re done, hit ‘Create’.
Note: Before proceeding, you’ll want to make sure that billing is properly set up. You can do this from the ‘billing’ section on the main menu.
Linking BigQuery with Google Analytics 4
You can now begin the process of linking your BigQuery project with Google Analytics 4. As we’ve already explained, there are lots of reasons for doing this, from more detailed reports to better data visualisations. Luckily, Google have made this process simple. It shouldn’t take more than a couple of minutes.
Step 1: Go over to Google Analytics 4
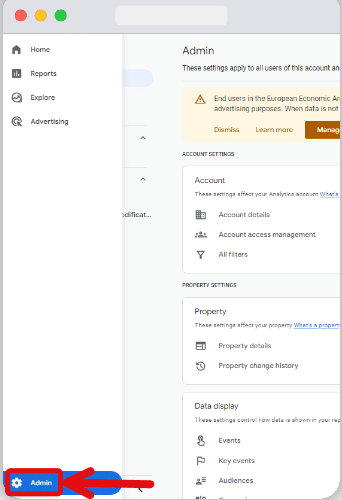
To begin the process of linking with BigQuery, you first need to head to your Google Analytics property. From your GA4 user interface, select ‘Admin’ at the bottom left.
Step 2: Select BigQuery linking
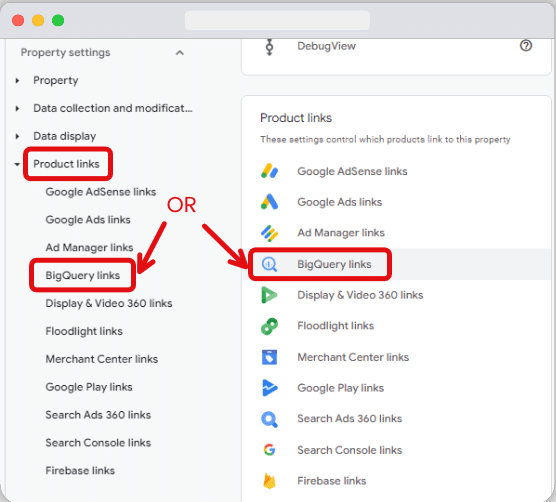
From the admin section, head over to the “Product links“. And scroll down until you see ‘BigQuery links’. Select it.
Step 3: Proceed through GA4 BigQuery linking
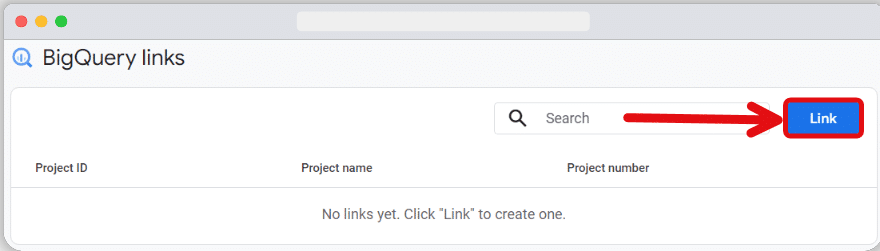
This will bring up the ‘BigQuery links’ screen. This is where you’ll be able to see all of the projects that you have linked to your Google Analytics 4 property. If this is the first time you’re linking a project, this box will be empty. To link your project, select ‘Link’ in the top right.
Step 4: Choose a BigQuery project
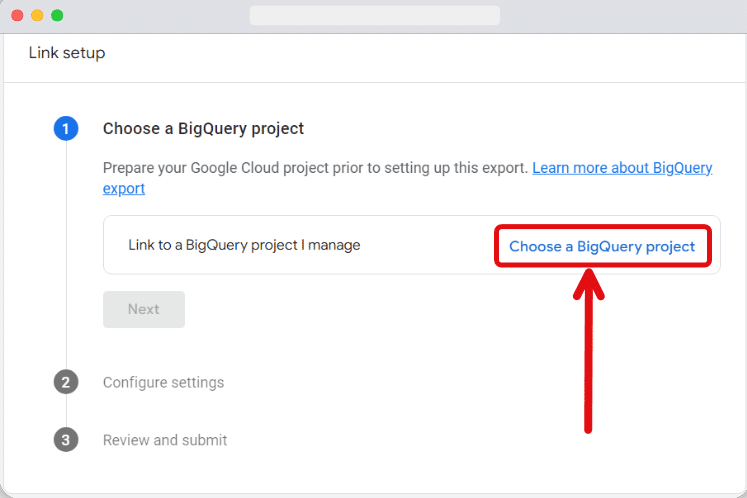
From the next window, you can select the project that you want to link with BigQuery. Select ‘Choose a BigQuery project‘ from the “Link setup” section.
Step 5: Confirm the selection of your BigQuery project
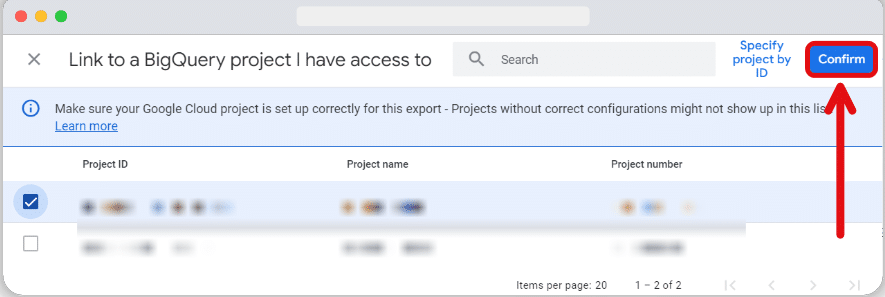
You should now see the project you created earlier. Select the tick box to the left of the ‘Project ID‘ and then hit ‘Confirm’ in the top right.
Step 6: Configure the settings for linking your report in BigQuery with Google Analytics 4
This will bring you back to the linking screen. Select a ‘Data location‘ from the dropdown list for where your data will be stored, and then click ‘Next.’
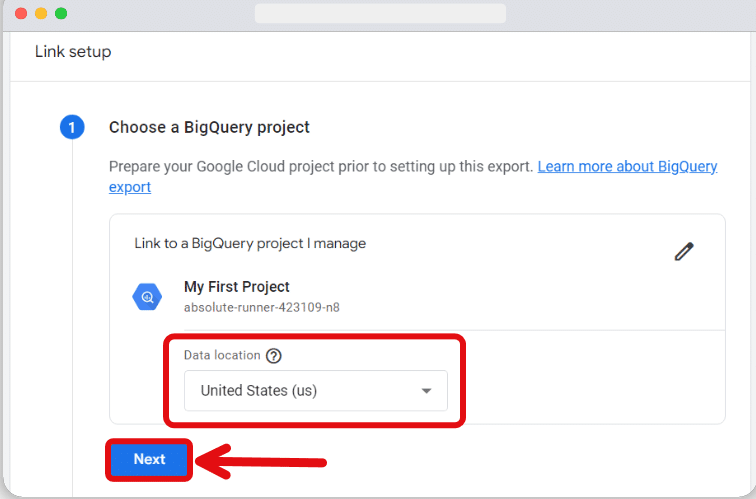
Optionally, click ‘Configure data streams and events’ to export specific data streams and events.
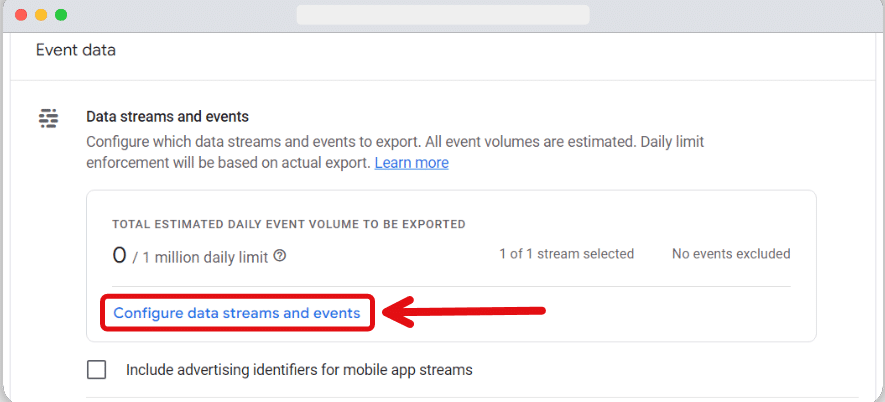
Filtering out unwanted data helps you stay within BigQuery’s daily export limit of 1 million events for standard GA4 properties.
Note: All data streams and events are selected by default for export to BigQuery.
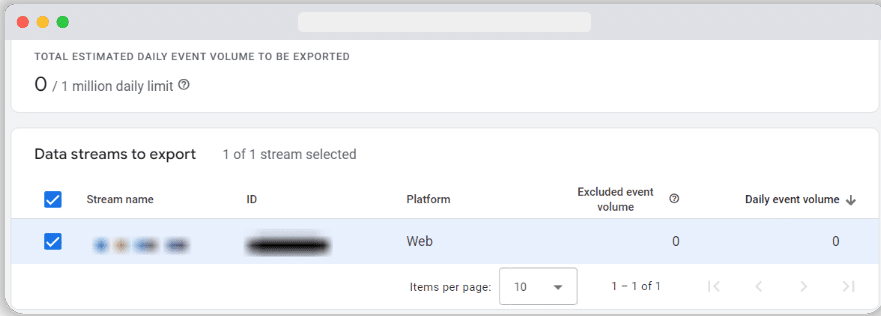
From the next screen, select the data streams that you want to export to BigQuery.
Scroll down and click ‘Add’ to choose events to exclude.
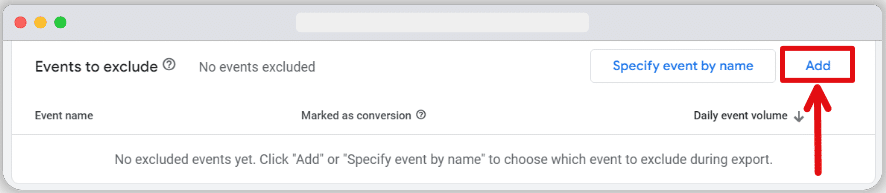
Check the events you want to exclude and click ‘Add‘ button again.
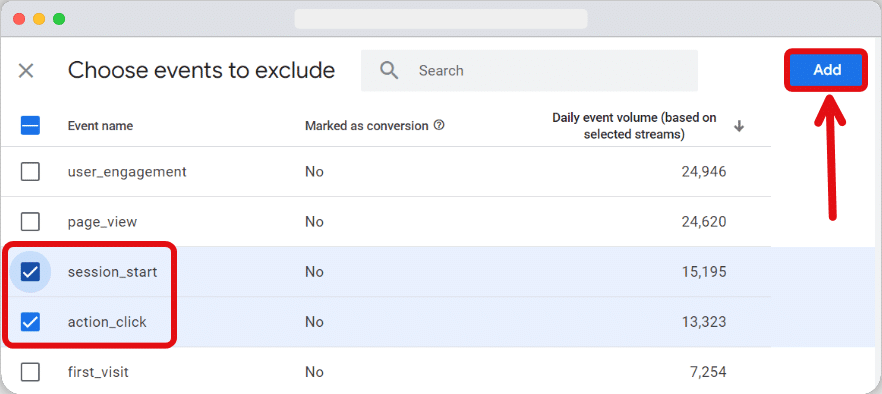
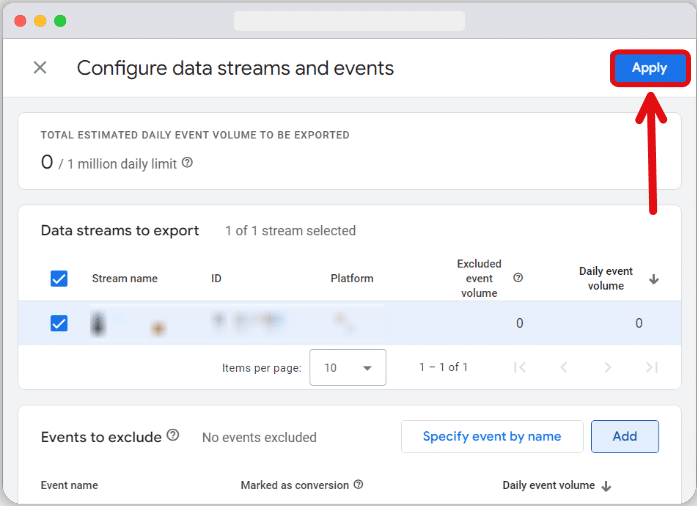
Scroll up and click the ‘Apply‘ button to save your changes.
Optionally check the box for ‘Include advertising identifiers for mobile app streams.’
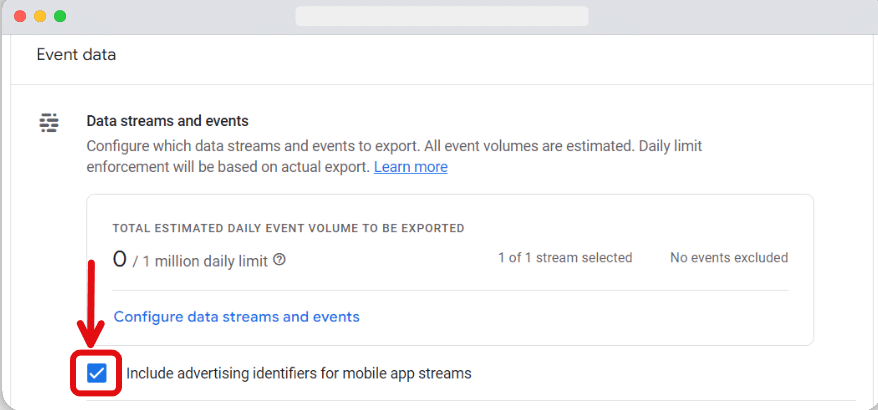
Note: This option is for you if you have a mobile app and want to export mobile advertiser identifiers to your BigQuery project.
Choose the frequency for data import to BigQuery. Select ‘Daily’ and ‘Streaming’ check boxes to ensure continuous data updates.
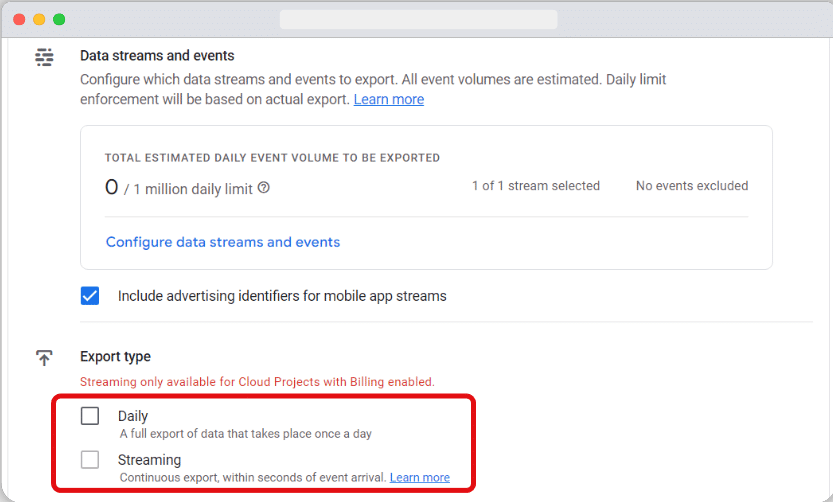
Note: Streaming is only available for BigQuery Projects with Billing enabled.
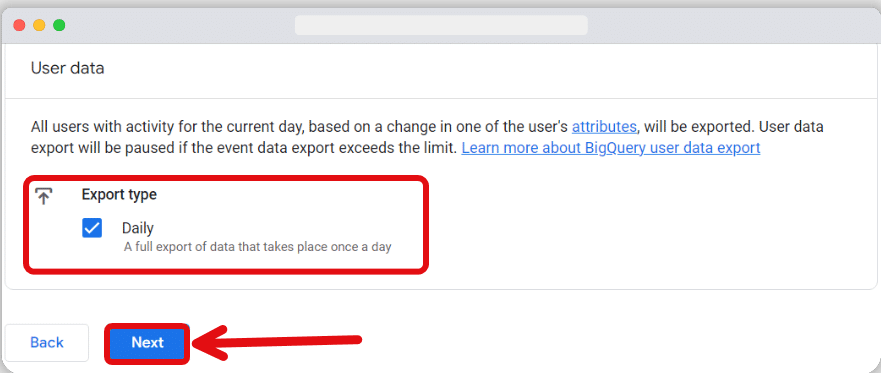
Now scroll down to check the ‘Export type‘ as ‘Daily‘ from the ‘User Data‘ section and click ‘Next‘ to proceed.
What kind of data do these reports give you?
If you’re familiar with GA4, you’ll know that every user action is treated as an individual ‘event’. This includes page scrolls, button clicks, and basically anything you can imagine. All of this information is compiled and sent to your BigQuery reports.
Daily, or streaming reports?
What you choose here is really down to the kind of website that you’re running. If your site is running hour-based content that requires constant analysis (e.g., News updates), then you’ll want to choose ‘Streaming’. Otherwise, select ‘Daily’. If you want the best of both worlds, you can tick both boxes.
Step 7: Review your selections and submit
Once you’ve made your choice, hit done.
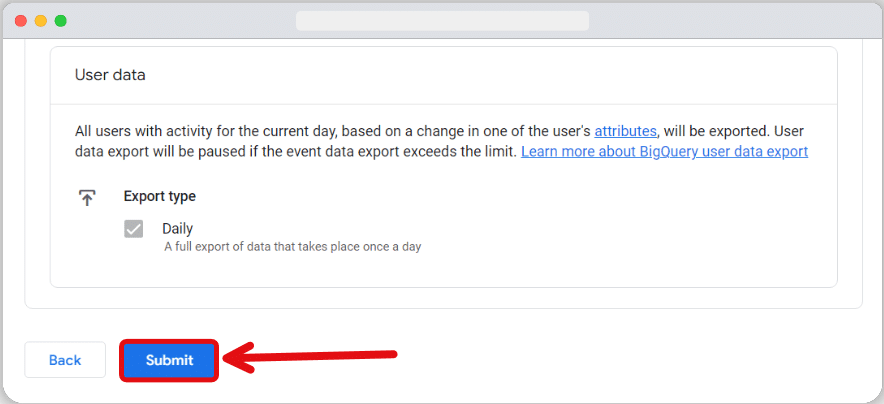
Before the linking of your BigQuery project with Google Analytics 4 is complete, Google will ask you to review your selections. If you’re happy with what you’ve chosen, hit ‘Submit’.
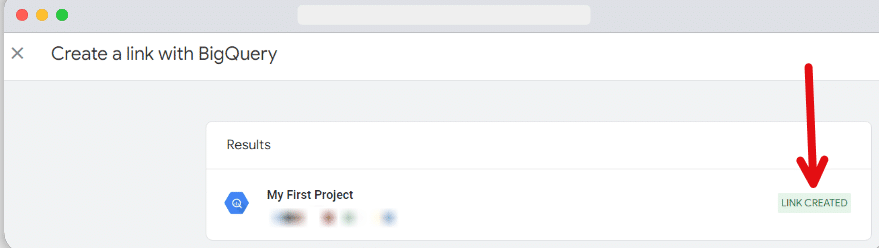
You’ll now get a pop-up to notify you that a link has been created.
Need help with Google Analytics?
It’s all well and good linking BigQuery with Google Analytics, but it’s only really useful if you’re getting the right data from your GA. If you feel you could be getting more from your reports, or if you just feel you need brushing up, MeasureMinds offers comprehensive Google Analytics and Google Tag Manager training.
Training is provided by industry experts who are globally renowned for their mastery of Google Analytics. Online and in-person available.
How to set up an API to send BigQuery data to Google Analytics 4
Step 1: Head to the ‘APIs & Services’ library in BigQuery
Whilst a link has now been created with your project, there is still one more step you need to take before you can send data to Google Analytics. To do this you’ll need to reopen BigQuery.
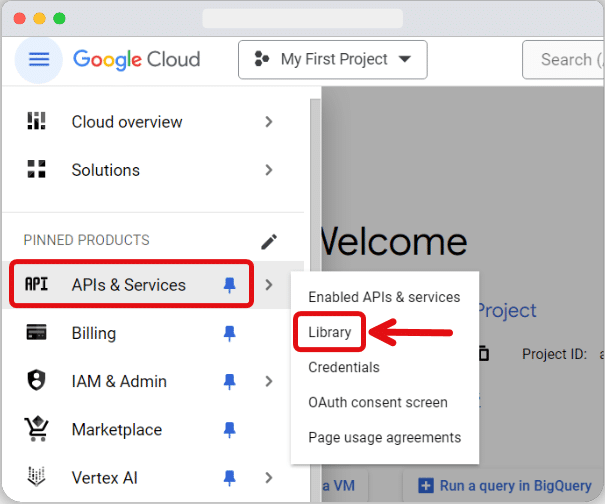
From the BigQuery interface, go to the toolbar at the right of your screen, hover over ‘APIs & Services’ and select ‘Library’.
Step 2: Select and enable the API to link Bigquery with Google Analytics 4
From the ‘Library’ screen, you’ll see a search box. Select it and type ‘BigQuery API’, then hit enter. You’ll want to select the first option (as seen below). This API will link BigQuery with your Google Analytics 4 property. Once you’ve selected the API, you’ll want to click enable.
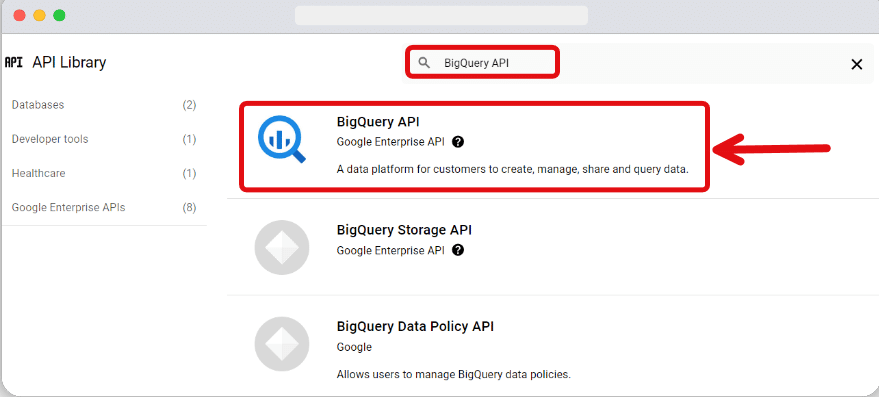
There’s a chance that this will be enabled already, if that’s the case – good news. If not, don’t panic! The API is entirely free.
Setting up service accounts to send data between BigQuery and GA4
Now that you’re API is installed, there’s one more step you’ll need to take before it’s fully linked, and that’s setting up a service account. This will authorise data to be sent between your project and GA4.
What is a service account?
A service account is an account that helps manage Google Cloud Projects. It represents a nonhuman user and needs authorisation to access data from APIs. Google provides these examples of scenarios where service accounts can come in useful, most commonly running workloads:
- On virtual machines (VMs).
- On on-premises workstations or data centres that call Google APIs.
- That are not tied to the lifecycle of a human user.
If you’d like to know more about service accounts, take a look at this useful guide.
Adding the Firebase Measurement service account
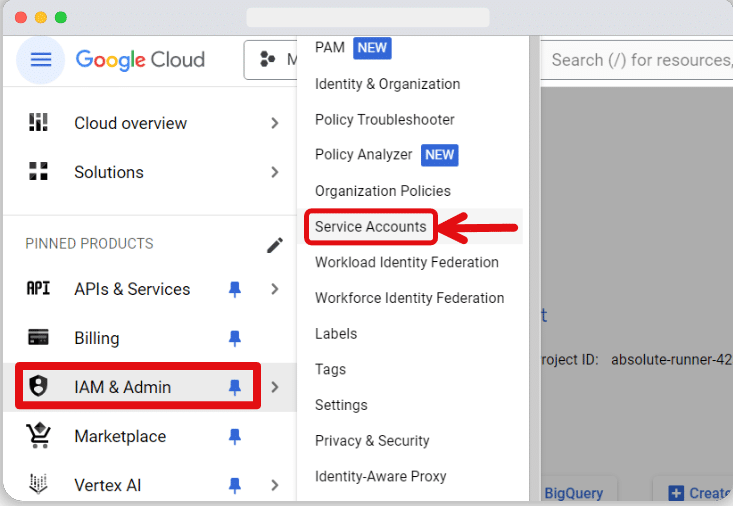
So that data can be sent from your project, you need to add the ‘Firebase Measurement’ service account. To set this up, head back to your main dashboard and from the toolbar, hover over ‘IAM & Admin’ and select ‘Service Accounts’.
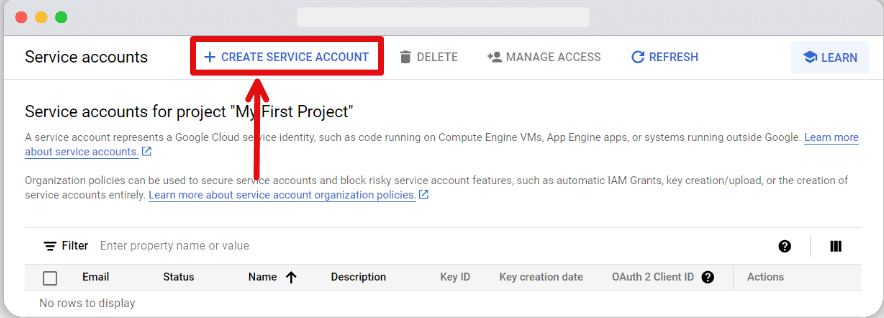
From this screen, you’ll see all service accounts associated with your project. Select ‘Create Service Account’.
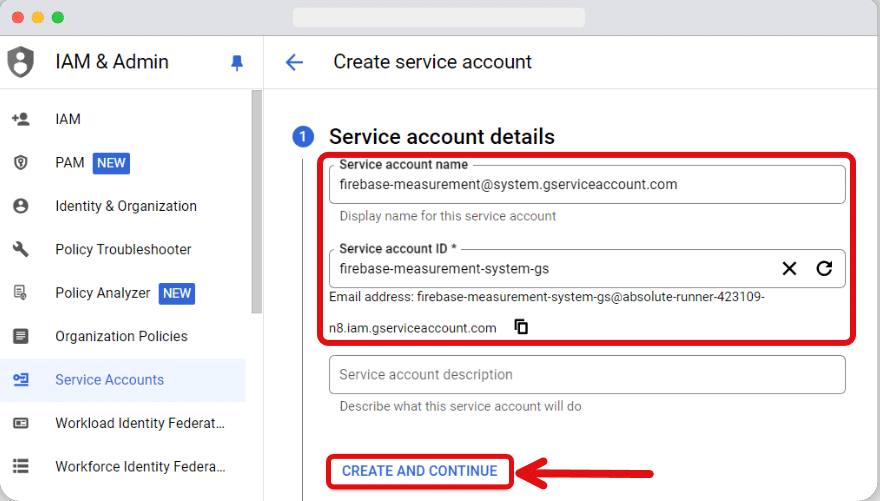
This brings up the service account creation screen, which allows you to specify details about your service account. Into the ‘Service account name’ section, paste [email protected]. Select whatever you want, ideally one that best describes the service account. Next, select ‘create and continue’.
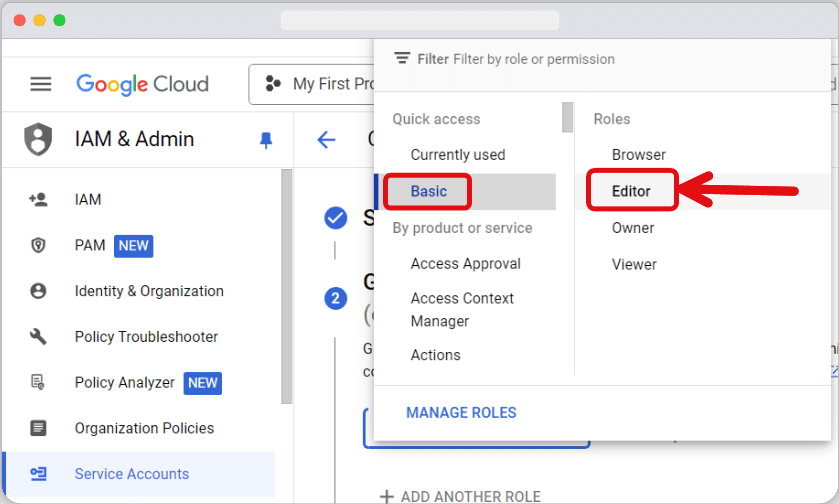
On the next screen, you need to select a role for your service account. There’s a variety of roles that you can select.
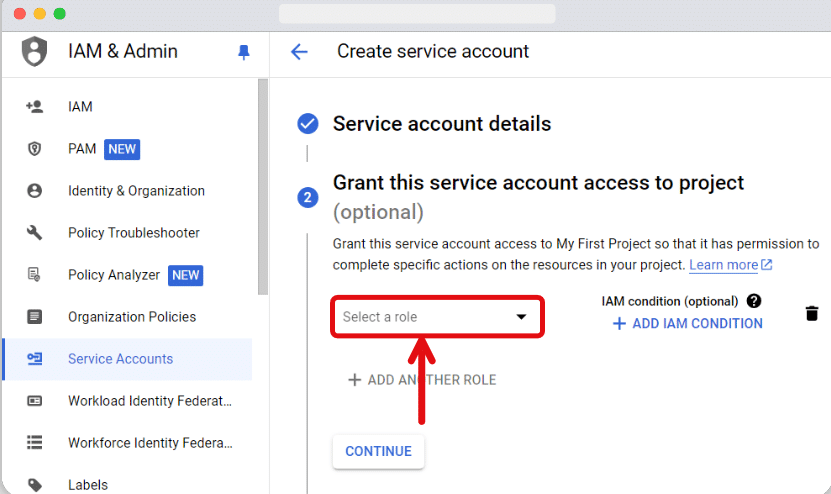
For this service account, we’ll be selecting the editor role. To access the role, click ‘Basic’ in the quick access section and choose ‘Editor’.
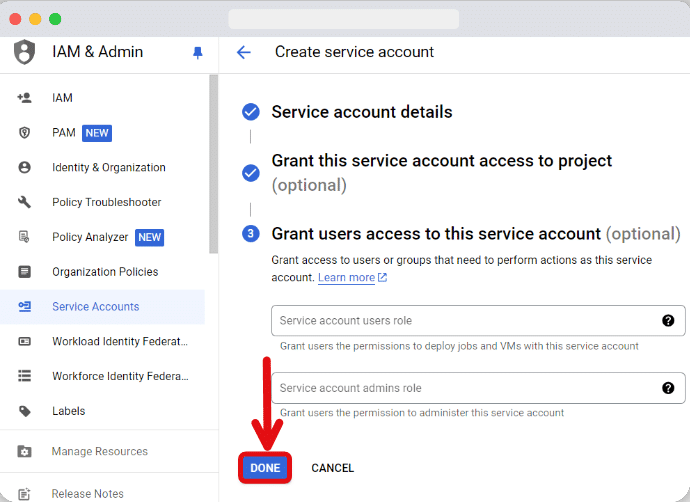
The final screen allows us to choose what permissions we want to give other users the option of deploying jobs to the service account. For now, we’re leaving this screen blank and selecting ‘Done’.
And there you have it – your Service account is successfully set up. You’ll now begin seeing data flowing into your reports – although it may take a day or two.
Creating a dataset in BigQuery
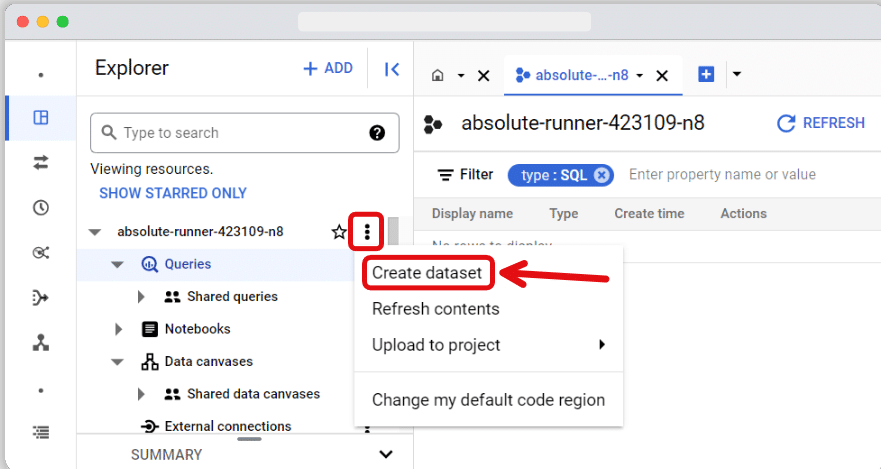
To create a new dataset, select the three dotted line to the right of your project name. From the pop-up menu select ‘Create dataset’.
A pop-up window should now appear, enabling you to configure settings for your dataset. Let’s go through each section.
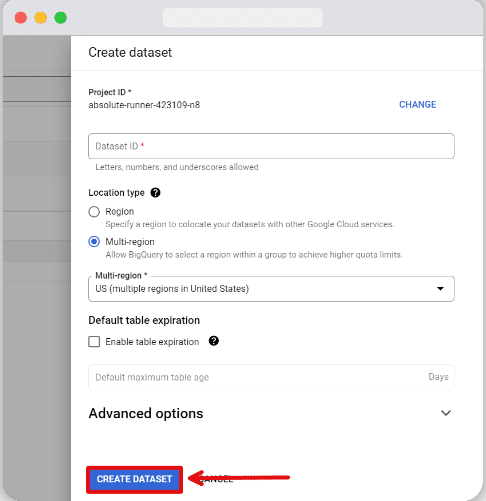
At the top of the window, you’ll see ‘Dataset ID’. This is basically just choosing a name for your dataset. Choose a name that’s relevant to the data that you’re collecting.
The next option is ‘Location type’. Here you’re choosing where your data is stored. By default Google will send your data to the US multi-region. You can select either one of the ‘Region’ & ‘Multi-region’.
Next, we have ‘Default table expiration’. This option allows you to decide how long your data tables are stored before deletion. You can either specify never – your tables will not be deleted, or a number of days until deletion.
If you’re dealing with temporary data that you won’t need in the long term, it’s recommended you select the latter. If you are managing data that you want to refer to in the months and years ahead, go with the former.
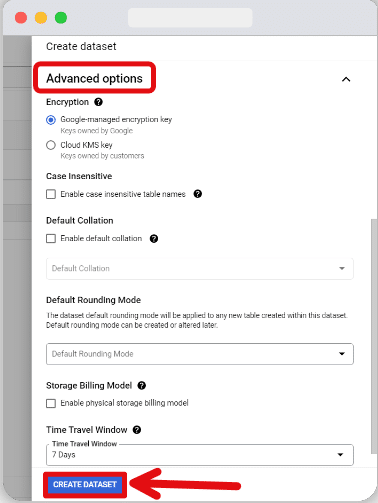
Finally, we have ‘Advanced options’ to fine-tune the settings. The ‘Encryption’ settings allow you to choose between a Google-managed and a customer-managed key.
If you check the box for ‘Case Insensitive,’ table names in this dataset will be case-insensitive. Upon checking the box for ‘Default Collation,’ users must select a default collation.
You also may select options from the ‘Default Rounding Mode’ & ‘Time Travel Window’ drop-down. Once you’ve selected each section, you can hit ‘Create Dataset’.
Creating Tables in BigQuery
Now your dataset is created, you can begin creating tables for your project. A table in BigQuery consists of data records. Each record is composed of a column.
Types of tables in BigQuery
There are three different types of tables in BigQuery:
1. Native tables
These are backed by the native BigQuery storage. Native tables allow a user to import full data into BigQuery. These can take longer to create and incur greater costs (you’re storing more data within the cloud).
2. External tables
These are tables that deal with data that is stored externally outside of BigQuery. They are quicker to create than native tables, and don’t incur any extra costs. On the negative side, queries for external tables can take longer than native tables. This is especially the case if your external tables are storing large files.
3. Views
This is a virtual table that is defined by a SQL query (used to pull important information from databases). With a view, you can set up default settings, so you don’t have to repeat them in future queries. Views are read-only, information cannot be edited, updated or deleted.
How do I create a table?
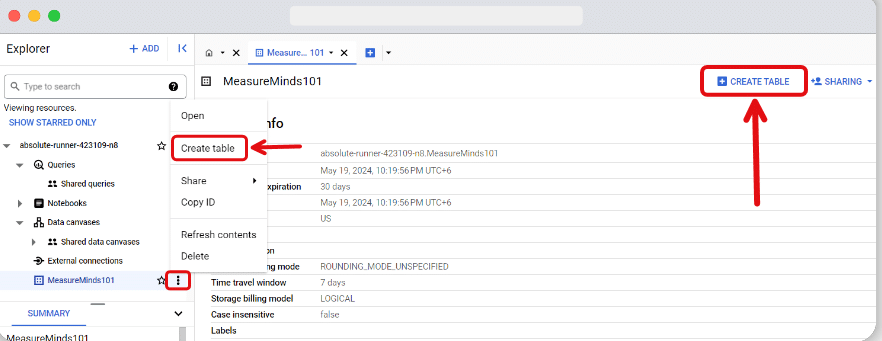
After creating your dataset, you’ll be brought back to the ‘BigQuery’ screen. You can start creating tables inside your dataset in two ways.
First, click the three-dotted icons next to your dataset’s name. Then, select the ‘Create table’ option from the pop-up menu. Otherwise, you can click your dataset window’s “Create table” button.
Once again, we’re met with a myriad of options. As before, we’ll walk you through each one.
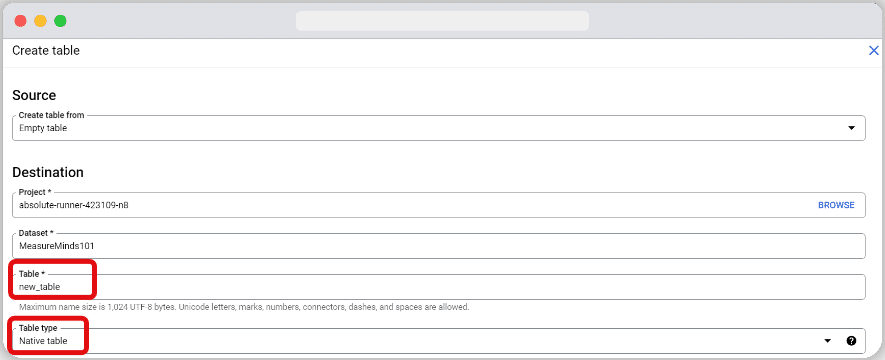
Source
From the top, we have ‘Source’. This is where you choose the basis for your table.
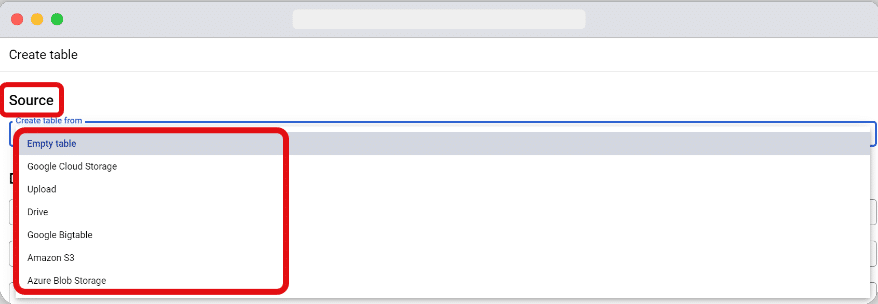
There are a few different source options.
- Empty Table (no data will be inputted).
- Google Cloud Storage
- Upload (add the data yourself)
- Google Drive
- Google Bigtable
- Amazon S3
- Azure Blob Storage
If you’ve already linked GA4 with BigQuery as mentioned earlier in the article, you won’t need to do this. However, if you want to add extra data into BigQuery, you can use any of the above source options but for now, we’ll use the file upload option as an example. By selecting upload, we’re given the option to pick a file and choose the appropriate file format.
Once you’ve selected your file, you can move on to the next section.
Destination
Now it’s time to name your table (go with whatever name works best) and pick a project & dataset. We’ll be selecting the ones that we created for this tutorial.
Next, you’ll see the table type. What you choose to select here, all depends on where your data is coming from. If it’s an internal source, go with a native table. If you’re working with external data, choose an external table.

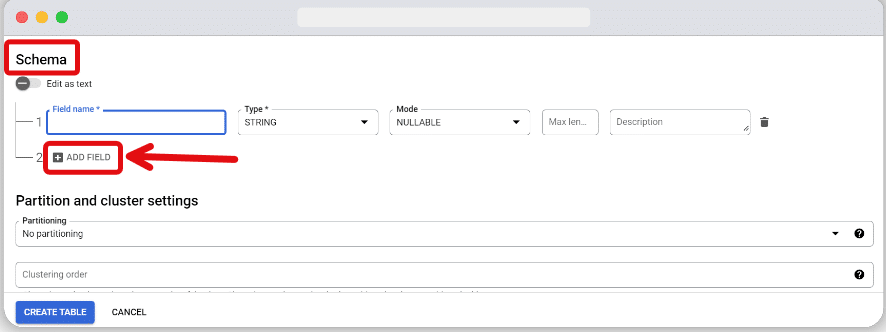
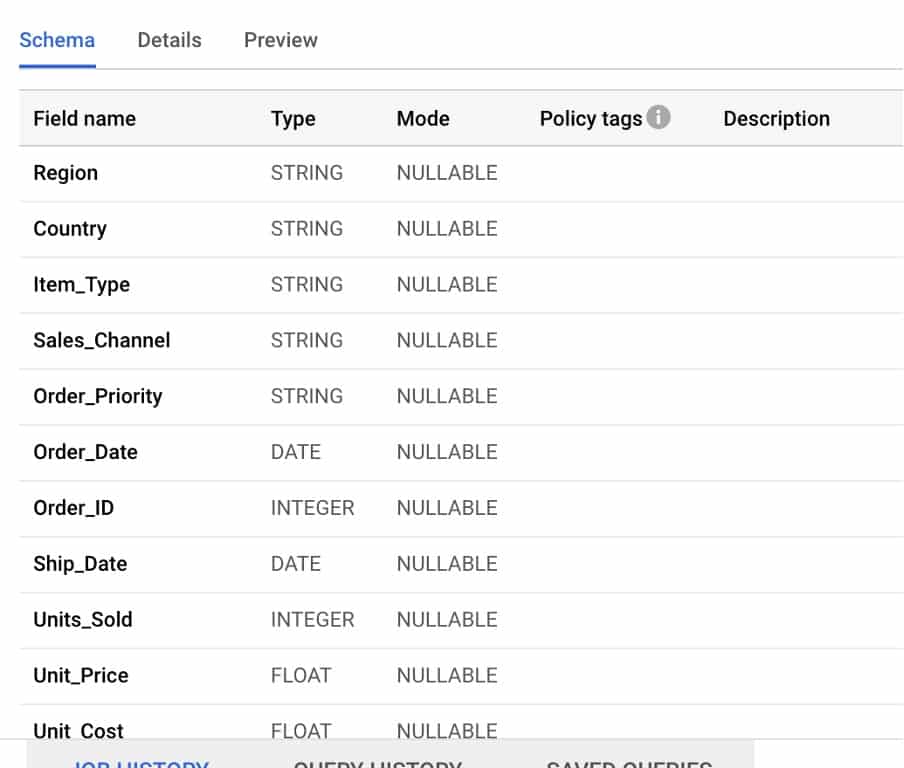
Schema
Next, we’re onto ‘Schema’. This is an essential part of the process. Essentially, the schema is all the different values that relate to the file you’re uploading. When a document is made up of columns, data types and key numbers, it’s important that your table correctly reflects this information.
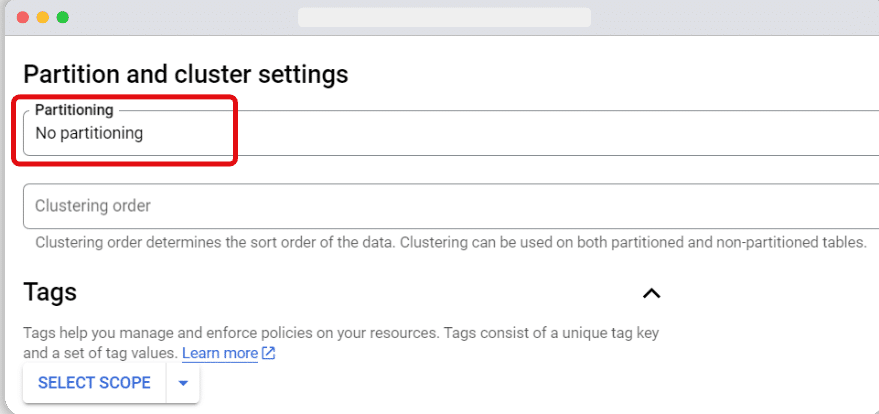
Partitioning and cluster settings
Finally, we have our ‘Partition and Cluster settings’. With partition settings, we can decide the kind of partitioning we want for a table. We can choose between ‘No Partitioning’ and ‘Partition by ingestion time’. With partitioning, you can divide your tables into smaller segments. This allows for querying using filters based on partitioning columns.
Filters help to make the querying process faster by reducing the amount of data that is scanned. It can also reduce costs and improve querying performance. As nice as all that sounds, for now, we will keep things simple and select ‘No partitioning’.
With ‘Clustering order’ we can decide on the sorting order of data. We’ll leave this empty.
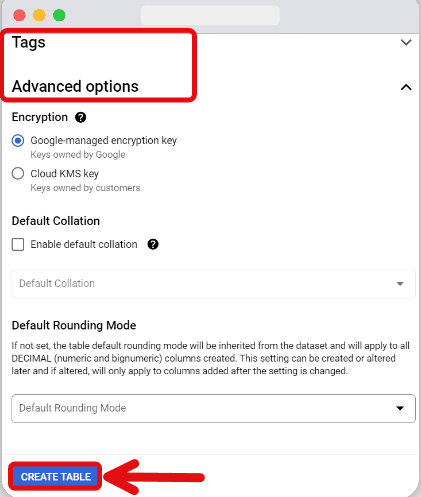
There is also a ‘Tags’ section & ‘Advanced options’ section, but these are something for you to come back to once you’re more familiar with BigQuery.
Once you’ve gone through the various sections and selected options that you are happy with, you can choose ‘Create table.’
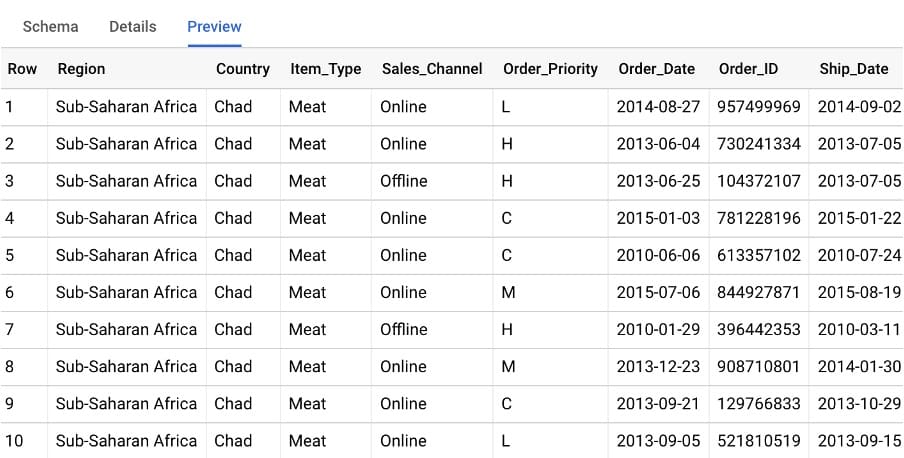
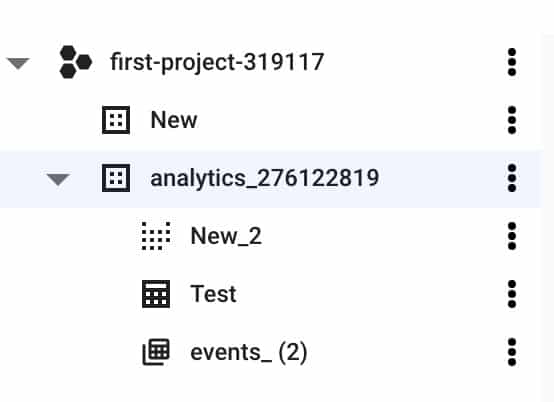
You’ll see that your table has now appeared under your project.
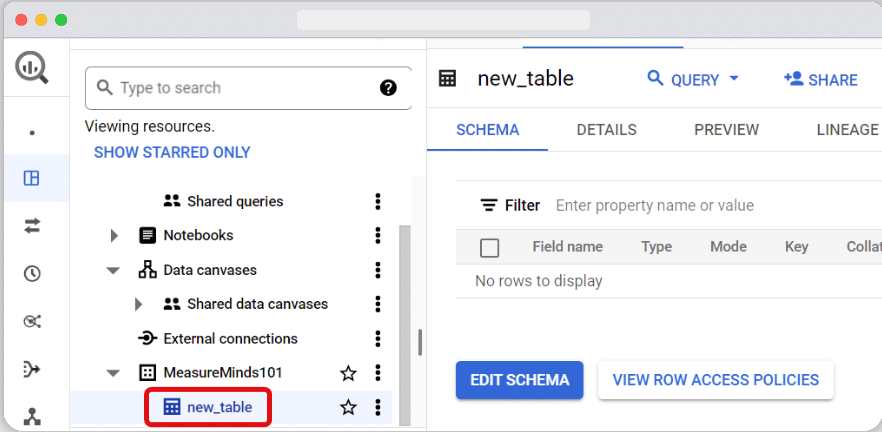
If you select your table, you can see the various aspects of the data that you have uploaded. If the information is transferred correctly, the layout should resemble the images below.
What can you do with this information?
You’ve created a dataset and input some data into a table. But how is this useful? Well for a start, you can query the data.
Querying your Dataset
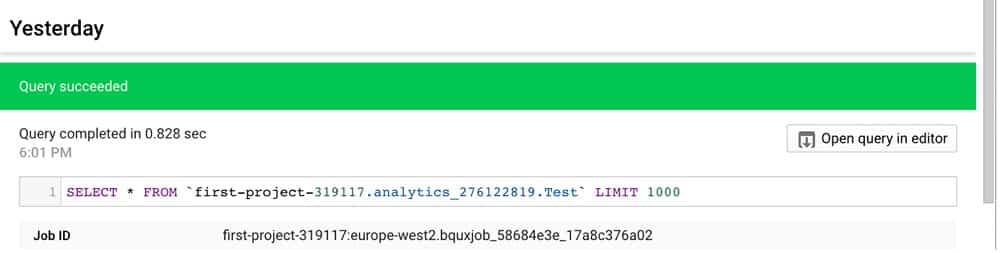
To test a query, choose a table. Click the three dots and select “Query”. After which, the query syntax is written for you automatically. This will take you to a screen like the one seen below. From here you can input all of your data queries. All queries are based on SQL.
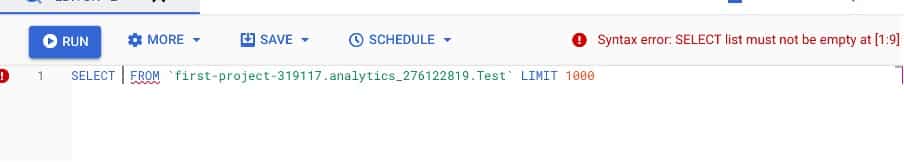
We’ll put an Asterix (*) after ‘select’. This is instructing BigQuery to query the entire table. The ‘Limit 1000’ found at the end of the line refers to the number of items queried.
Done correctly, the line should now look like this. If you’re satisfied, select ‘Run’. Your query will begin processing. You’ll now get your first sense of how lightning-fast BigQuery is. Your query should be completed in a matter of seconds.

Because you have selected the whole table in your query, the report should look identical to the table. If you know SQL, you query whatever information that you want, and get your information back at similar speeds. If you’re not familiar with SQL, it might be time to bring in someone that is.
Google Analytics 4 Related Queries
Sometimes, when you’re managing a property, it can be useful to know about user interactions as they happen. This can help you to gauge the performance of a certain page or get better insights into the kind of behaviour of your users.
With Google Analytics 4, all user interactions are treated as ‘events’ but how can we query GA4 events?
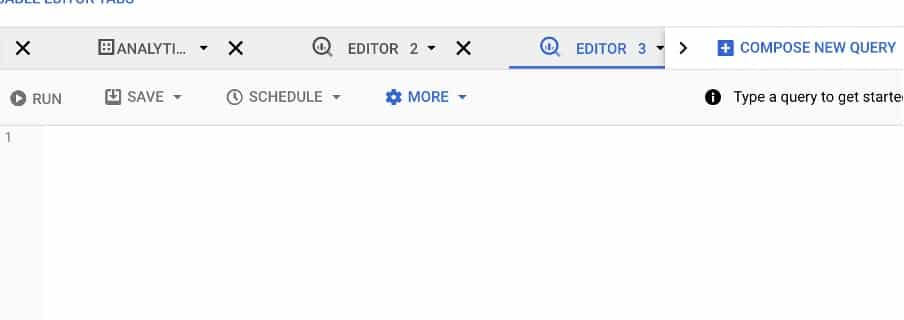
Step 1: Compose a new query in your Google Analytics data stream
To begin, we need to return to your project list and select your GA data stream. As before, we need ‘Compose New Query’.
Step 2: Use a list of commands and paste into your query
You should now be back on the query creation screen. For this, we’ll run a query to let us know when a user first opens a page or an app. To do this you’ll need to paste the list of commands below into your query.
SELECT

SUM(

IF

(event_name = 'first_open',

1,

0)) AS first_open

FROM

`firebase-public-project.analytics_153293282.events_*`

WHERE

_table_suffix = '20181003' -- update to your desired start and end date'
Once you’ve pasted this set of commands into your query editor, hit ‘Run’. You’ll now start seeing details about users that have entered your site, alongside the time they arrived.
As with before, you can save this information, add it to a table or create a view. With the power of BQ’s querying feature, you can find out and isolate all sorts of information from your Google Analytics reports.
How do I keep a record of queries?
With all the data that you’re receiving from BigQuery, you’ll undoubtedly want to save your reports so that you can retrieve your data later down the line. There are a few ways you can do this.
Saving your Query Results
The first, is to click ‘Save Results’ below your query.
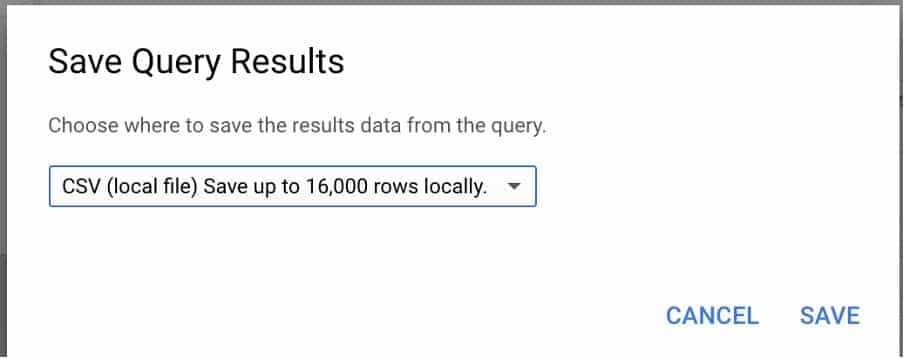
BigQuery will then prompt you to choose an option for storing your Query. Each option has its own capacity for storage:
- CSV – Allows you to save up 16,000 rows locally.
- CSV (Google Drive) – You can save CSV files on Google drive, there a 1GB limit.
- JSON – As with CSV, you can store 16,000 rows locally.
- JSON (Google Drive) – Once again, there is a 1GB limit.
- BigQuery table – Perhaps one of the most useful options, this allows you to save your query as a table within BQ. The process for this is similar to creating an ordinary table.
- Google Sheets – You can save up to 16,000 rows to Google sheets.
- Copy to Clipboard – you can also copy up to 16,000 rows to your clipboard. These can then be manually pasted into a table.
- So, a great deal of options for how and where you want to save your queries.
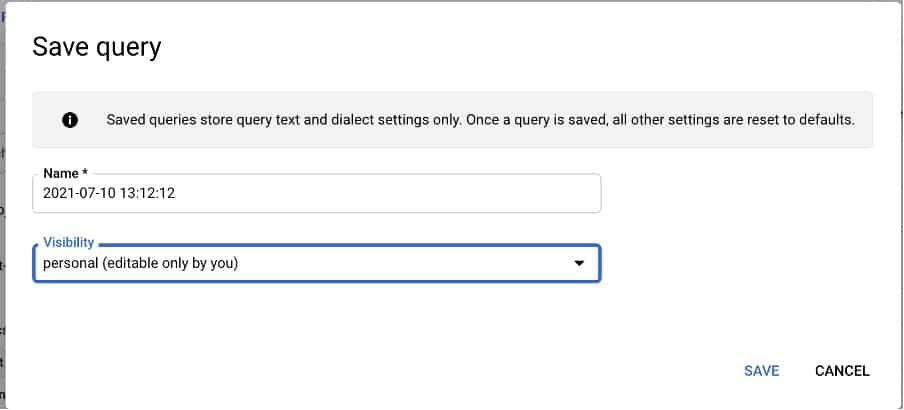
But there’s more…
You can also save a query directly. With this option you choose who can access your queries – great when working with larger teams. You can make a query private, public or enable team edits.
Retrieving and editing past queries
You can also head to ‘Query History’ to find a complete list of all your queries. This can be divided into ‘Personal History’ and ‘Project history’.

Once you’ve selected a Query, you can choose to open it in the editor. This allows you to look back on past queries and edit them if you wish.
Saving a query as a View
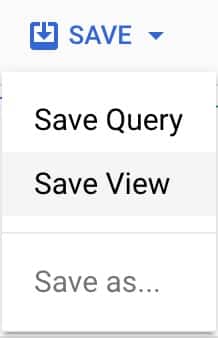
The third option for saving a query, is for saving as a view. As explained earlier, a view is a table created from a Query. To create a View, hit ‘save’ and select ‘Save View’.
This will bring up the view creation table. Select the project and dataset link the view with. Now you need to name your table. BigQuery does not allow you to include spaces in the name, so if you’d like to separate the words use an underscore (_).
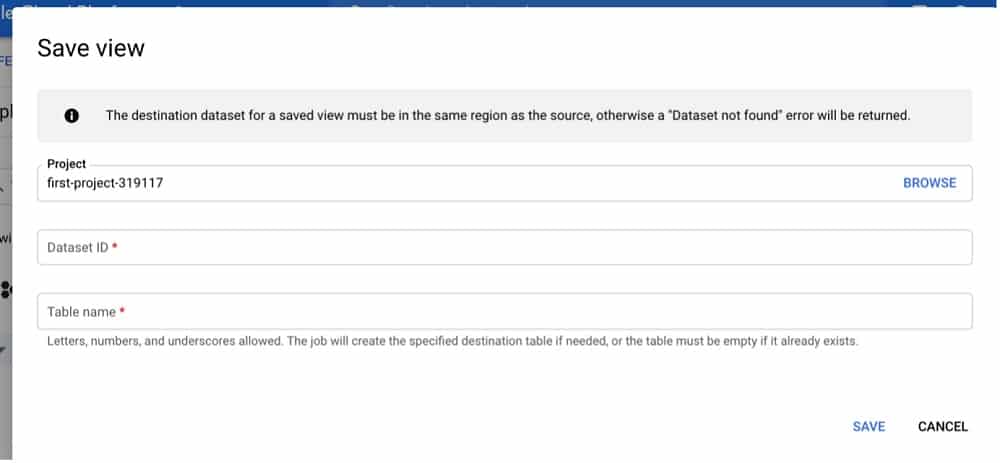
When done, click save.
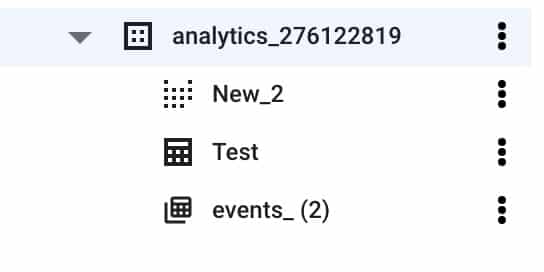
Your View will become visible beneath your dataset. Select it and you’ll see a table specifying all of the values from your query. This is particularly useful when looking at a specific set of data. For example, you could create a table to display profit from a specific region.
You can even query a view, to go into even more specific detail. To do this simply select ‘Query View’ at the top of your toolbar.

Benefits of using BigQuery with Google Analytics 4
Fully managed data warehouse – With BigQuery, you’re no longer responsible for paying for a warehouse and all the elements that come with it. Google provides the space and infrastructure, meaning BQ acts as a fully managed data warehouse. Suddenly, you can process data much more quickly, delivering better results for you and your business.
Find relevant information easily using SQL – BigQuery makes this data simple and accessible. All information is stored in a structured table, allowing for the use of the programming language, standard SQL. This allows you to query your data easily. BQ is particularly useful when running thousands of stores. It allows you to break up your revenue by Stock Keeping Unit, region, or per time period. This function saves time and money.
BigQuery integrates with Google Clouds Identity and Access Management. Google Clouds Identity and Access Management allows you to control who can access data and assign read or write permissions to specific users. This ensures that sensitive information stays private.
BigQuery helps you to avoid the ‘data silo’ problem – This is one nightmare that businesses that deal with lots of data know too well. It happens when individual teams have their own data marts (structures used to recover client-facing data). Data being analysed across teams can cause friction and create issues with data version control. By integrating with Google Clouds Identity and Access Management, BQ allows for continued collaboration between teams whilst assigning specific teams to different data sets.
BigQuery cuts out red tape
Have you ever been in a situation where you’ve had to manage large structures to deal with data? With BQ, this becomes a thing of the past. There are three parts to BQ, storage, ingestion and querying. Everything else is dealt with by Google handles, meaning that you have to spend less time setting up intricate structures. You don’t even need a database administrator, you can just log in. You’re saving time and money.
How does BigQuery work with Google Analytics 4?
Google Analytics 4 seems to have more analytical features than its predecessor, Universal Analytics. If used correctly, GA4 can be a real game-changer.
But what do you gain by integrating it with BigQuery? Whilst GA4 indeed has a world of analytical features, there are lots of ways that it can work with BQ to produce more effective analytics reports:
You can perform more advanced analytics
Enabling the export of raw Google Analytics events to BigQuery allows you to perform even more advanced analytics. This means you will know your audience better and be able to perform pinpoint-accurate marketing, putting you a cut above your competitors.
You can make the most of data sampling
Data sampling is a handy tool for analysing subsets of user data. It’s particularly useful when working with larger data sets to gain statistical analysis. Sub-sampling is only really effective if it’s working with lots of data.
With BigQuery, you can store up to 10 gigabytes each month for free. You’re looking at $5 per terabyte monthly if you want more storage.
You can export custom events to BigQuery with Google Analytics 4
One of the biggest features of GA4 was its new data model. Each specific user interaction is now treated as an individual event. With GA4, a user can create custom events that record specific predefined actions such as views on an individual webpage. By exporting your custom event data to BigQuery, you can take advantage of the massive amounts of data collected and get a more in-depth analysis.
Visualise your data
Google Analytics 4 can be linked with a number of data visualisation apps such as Looker Studio. Once linked, you can push your BigQuery data to the data visualisation app. When working with massive amounts of data subsets, visualisations are a must.
Need help setting up Google Analytics 4?
There are numerous steps involved in the setting up of Google Analytics 4 and like with BigQuery, it can be a bit difficult to get your head around. If you need help upgrading or setting up GA, we have created a step-by-step how-to guide. This will take you through setting up, and making the most of GA.
Data is the future – stay ahead by using BigQuery with Google Analytics 4
New ways of analysing and utilising data are constantly appearing. The only way to get ahead of the curve is to keep up with technology like BigQuery.
BigQuery can be daunting, but we can help. We have helped many businesses, in sectors from banking and Local Government through to healthcare and ecommerce. With our help, they have made the most of their data and delivered real benefits to their organisations.
Further Reading
Want more? Check out our blog for more tips on Google Analytics, as well as a whole host of other Google packages.
- Top 24 Google Analytics Chrome Extensions & Sheets Add-ons - 21/05/2026
- Best Consent Management Platforms (CMP) - 19/05/2026
- Google Signals and Consent Mode: What This GA4 Change Really Means - 23/04/2026