GA Quotas in Data Studio: The Definitive Guide

What are GA4 API quotas? Are you affected, and if so, to what extent? Today, we’ll help you to answer those questions.
We’ll give you some information to help you in dealing with GA quotas in Data Studio. We’ll also give a rundown of the pros and cons of connecting to the Google API vs the BigQuery export. Finally, we’ll compare the use of Google Connector to other third-party connectors.
This is a write-up of the talk given by Ahmad Kanani at GA4ward MKIII. You can find his slides here, and the recording is below:
Remember we’ll be giving information, not a prescription. The goal is to help you make a more informed decision.
GA4 Reporting in Data Studio
As we all know, Universal Analytics is going away. When it’s gone, we’ll be left with the data from our Google Analytics 4 properties. There are many benefits of GA4, with the main advantage being the increased level of insight it provides.
It’s vital that we can make use of our GA4 data, just as we did with UA in Data Studio.
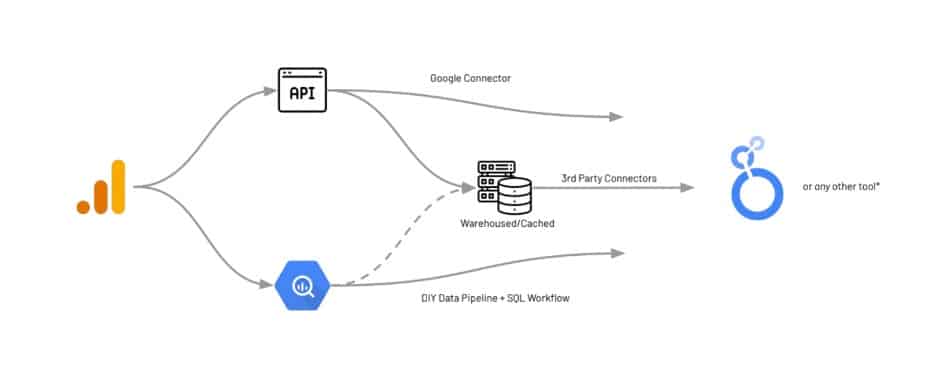
To do so, we need to extract this information from GA4. There are two possible routes for doing this. We could connect to an API using Google Connector or write a script to hit the API request for data.
The second option is to use the free export after you connect GA4 with Bigquery. There is a learning curve associated with this method, as well as additional cost and time. To make sure our data is ready for reporting, we need to create a DIY data pipeline and SQL workflow.
There are other solutions using third-party connectors which can be warehoused in our cached. These can retrieve data from either the API or, for some options, from the BigQuery GA4 export.
Each of these solutions for reporting in Data Studio or any other tool, has its pros and cons.
What are Google Analytics quotas?
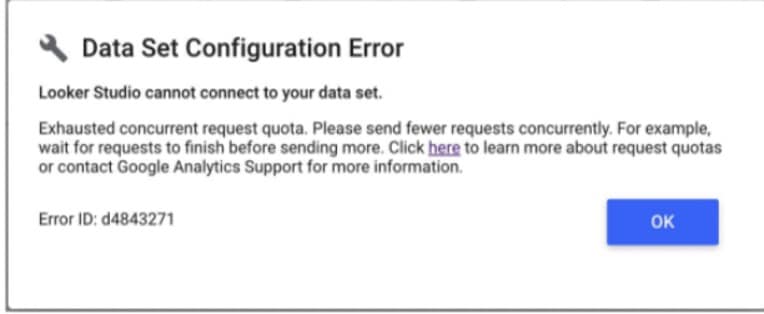
On November 7th, 2022 people started getting this error message. At first, people believed this to be a bug. Sadly, no such luck – the GA quotas had been enforced on Data Studio.
There were always quotas for every other piece of software that connected to API. But for a while, it seemed that Data Studio had been spared this limitation. Google decided to level the playing field so that anyone connected to API would be subject to quotas.
Understanding GA4 API quotas
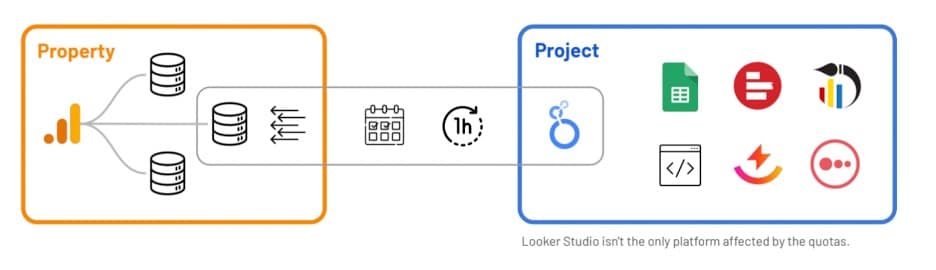
In GA4 we have an account and we have properties. We want to extract data from these properties to input into our projects.
Sadly, Google Analytics limitations can prevent us from doing everything need to. Of course, it isn’t just Data Studio that is impacted by the quota. The limit is imposed on all tools that connect to the API.
There are actually three types of quota limits. These are:
- Concurrent requests per property – To put this into context, this would be like a person saying you could only ask them ten questions. The API will not respond to more than ten requests at a time. This impacts all your projects combined.
- Hourly tokens per property per project – The rest of the quotas are token based per project. For example, if you have a project in Data Studio, every hour there is some kind of limit. Any request that goes to the API consumes a certain number of tokens.
- Daily tokens per property per project – On a daily basis, each project has a limited number of tokens it can consume.
What are tokens?
Each request that goes from a chart to a data connector to the GA4 API consumes a certain number of tokens. But what determines the number of tokens that are consumed? There are several determining factors. These include:
- The complexity of a request.
- The number of dimensions and metrics.
- The filters that you apply.
- The date range from which you are requesting data.
Something to keep in mind is that one request does not equal one token. According to Google, most requests will use around 10 tokens. But in reality, we can expect a request to consume 20 to 50 (for a table or a chart).
Many more tokens will be consumed for larger volume accounts, perhaps as many as 100.
Quota Limits: Standard vs Analytics 360
But what exactly are the limits? The good news is that recently, the limits on most quotas were increased. Let’s look at the limits, as well as any changes that have been applied.
For concurrent requests – the limit is 10 (this is unchanged).
Tokens per project per property per hour – 14,000 (from 1,250).
Tokens per project per hour – 40,000 (from 15,000).
Tokens per property per day – 200,000 (from 25,000).
So, the situation now is a little more bearable. The GA quotas on GA360 are slightly different. These are
For concurrent requests – the limit is 50.
Tokens per project per property per hour – 140,000.
Tokens per project per hour – 400,000.
Tokens per property per day – 250,000.
You can see a list of all current GA API quotas here (these may have changed since the time of writing).
Something to note is that, unlike others, the concurrent requests quota is only per property. Different projects (Google Sheets, scripts, etc) trying to connect at once may hit the quota limit.
Hitting quota limits
If you hit quota limits, you’ll get this message. Your charts won’t load in Data Studio. At this point, your client will likely start getting angry.
Am I affected?
You’re probably wondering to what extent you are affected by this change. Let’s start with the good news and those accounts are less likely to be affected. You’ll be less likely to be impacted if you fall into any of these categories:
- You create simple reports.
- You deal with small-volume accounts.
- Your report on shorter date ranges.
- If your reports are only viewed by a few viewers per hour.
- You use a few components per page (one page dedicated to one question or one group of questions).
- Your reports are informational (you have a report that informs a person of what happens. There is low interactivity, and people only open and then close the report).
Now, let’s look at the opposite end of this spectrum. You’re more likely to be impacted by the GA quota if you fall into any of these categories:
- You have more complex reports.
- You deal with high-volume accounts.
- You report on long date ranges.
- You share your report with many viewers per hour.
- You use many quotas per page.
- Your pages contain many components.
- If your reports are designed for exploration or are highly interactive.
How likely are my reports to hit quota limits?
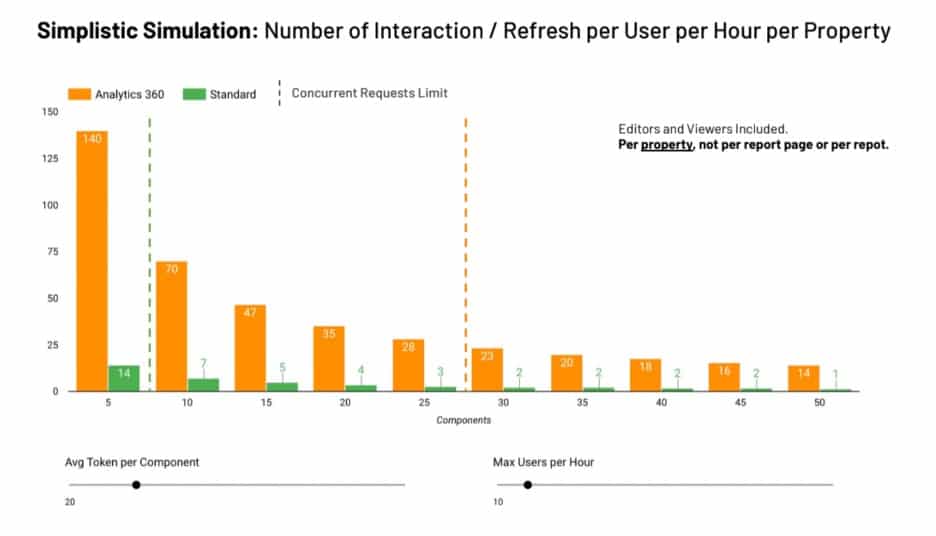 We have created this simplistic simulation with lots of assumptions. We know the more requests we send, the worse the limit is. In the graph, we’re looking at the number of interactions or refreshes per user per hour per property.
In this instance, we’re assuming that a report will be used by 10 users per hour. On average, each component uses 20 tokens when it is refreshed.
From the graph, we can see that with GA360, even when we have 15 or 20 components per page, we’re almost in the same zone. Each user can interact with the report per hour.
But if you’re using standard GA and have lots of components and people using the report, each user will only be limited. This is obviously not a good position to be in.
So, what can you do? You could share the report with fewer people. Or, you might use a smaller number of components per page. You could also use some other solution (we’ll cover these later).
How does Data Studio handle quotas?
Data Studio has tried to offer solutions to make life easier for its users. Let’s look at some of Data Studio’s best practices that might help you.
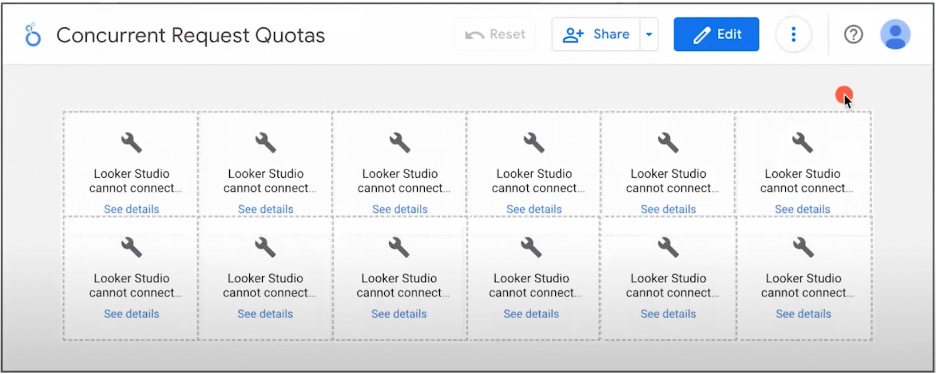
Concurrent request quotas
Here we have 12 scorecards. Each is making two requests, one for the main date range, and the other for the comparison date range. It does this to obtain data to calculate the percentage difference.
Whenever this page is loaded, we see data relating to 24 concurrent requests. We know that for a standard property, there are 10 requests, so this is more than double.
But what Data Studio does, is break the components of a request into batches. Each batch sends less than 10 requests each time. The tool waits for one batch of requests to be completed before sending four more scorecards.
Whether or not this is acceptable to your users will depend on your individual use case.
Monitoring token usage
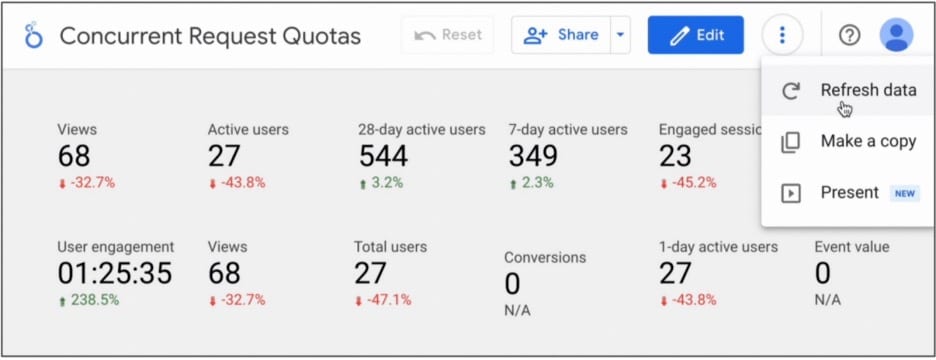
Data Studio also came up with a solution for monitoring token usage. Previously, we didn’t have any way of knowing how many tokens were being consumed. But now, if you right-click on a page on a report or a single component, you can see the information.
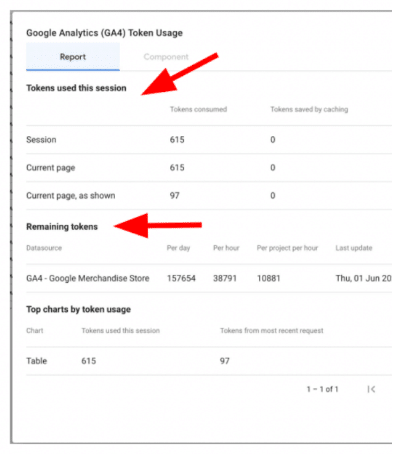
If you look at the image above, you see a variety of insights. You can see the number of tokens consumed by the session (Data Studio session rather than GA4). You can also see the number of tokens consumed by page and the final refresh of each page.
We can also see the number of tokens we have remaining for a specific day, hour, and per project per hour. Finally, we can also view how individual charts used tokens – a table has taken up 615 tokens, and 97 tokens on the final refresh. But what kind of table is this?
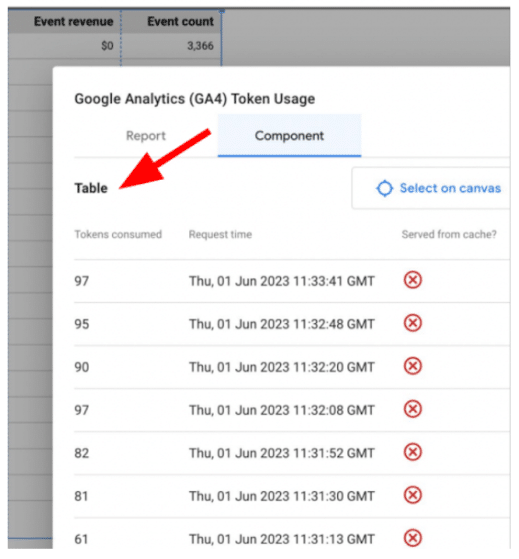
To find out, we right-clicked and grabbed some data. We can see the usage per component, each of the rows shown above is a refresh of the table. We can see that at one point, as many as 97 tokens are being consumed.
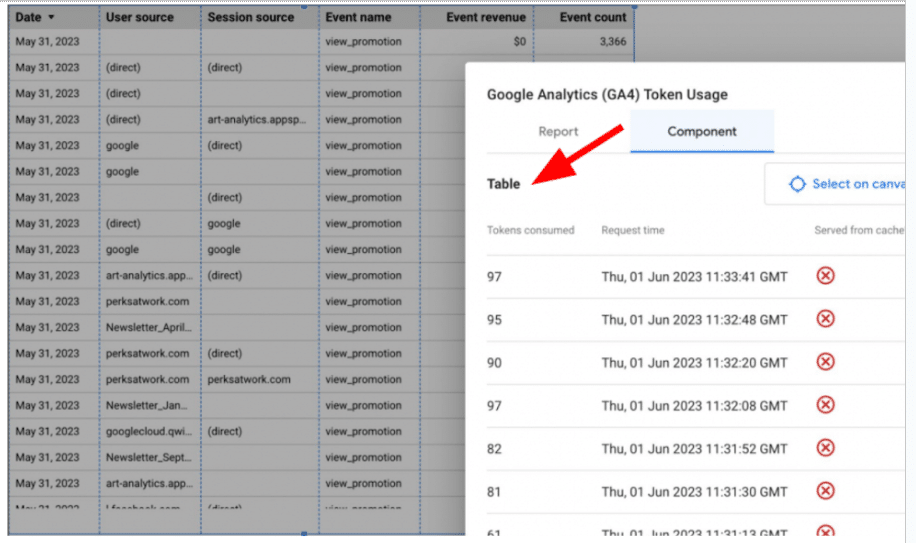
The culprit was a simple table (shown above), containing four dimensions and two metrics. None of these factors could have been saved from the cache.
We were editing and changing the configuration of the table. The new version couldn’t have been answered with the previous request. For each iteration, a request is needed and tokens are consumed.
Pause updates
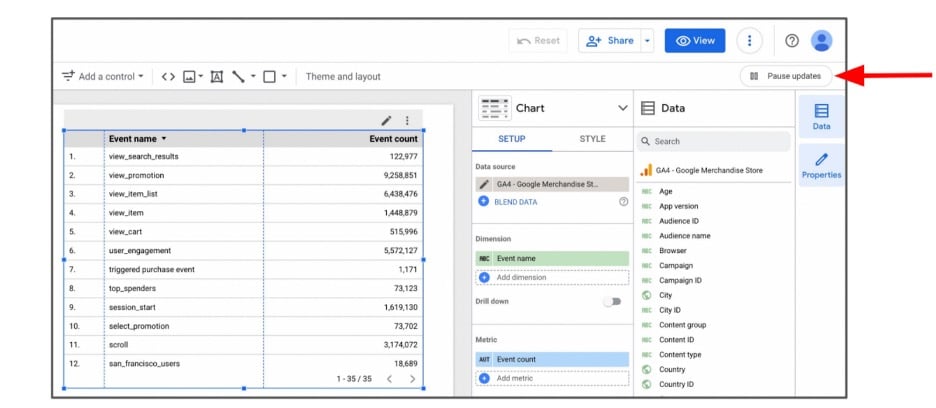
Another recent addition is the option to pause updates. By pause update, we mean pause request.
Editors of the report change configurations. And each time they hit the API, they consume tokens. If it’s a live report, the viewers are unable to access information because the tokens are used up.
That’s why, if you’re working on a report, you should pause updates. This prevents new requests from being sent. Until you resume updates, you won’t be able to load your chart when configurations are changed.
Caching in Data Studio
The same request, date range, metrics & dimensions, and filters apply. If Data Studio already has data, we can configure the data freshness setting (every hour, every 4 hours, every 12 hours).
If we are already within the timeframe and Data Studio has the right data cached, it won’t ask GA anymore. The tool will instead take data directly from the cache. This is a much faster method that saves tokens.
Solutions for Google Analytics & Data Studio quota limits
We now know the Google Analytics limitations and what Data Studio does to help us. Now, what can we do to help ourselves? Let’s look at some potential solutions.
Pay Google
This is the easiest solution, but it’s also the most costly. Some people believe that upgrading to Data Studio Pro will help. This, however, is a misconception. In reality, it doesn’t change a thing.
You could upgrade to Google Analytics 360. This will increase your token-based quotas by 10x and concurrent requests by 5x. Be warned, though, GA360 costs $150,000 per year.
But if you’re only motivation for paying Google is to work around quotes, there are better solutions.
Build a BigQuery data warehouse
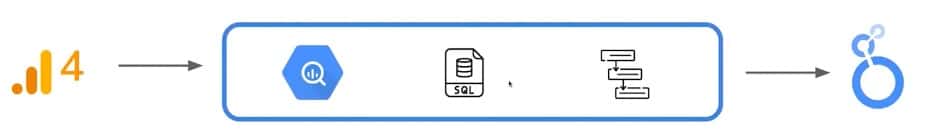
You could build something from scratch based on the data that Google is providing. As mentioned, GA sends data to BigQuery every day in real-time. Data Studio can connect to Big Query. But we need to be able to create a SQL workflow in BigQuery to prepare the data.
It’s not useful to connect Data Studio directly to BigQuery. You’ll be paying lots of money and not getting the answers you need.
Depending on the amount of time, money, skills, and resources you can allocate a custom workflow may be a solution. There are pros to this approach, including:
- Data Ownership
- The ability to use SQL for Data Analysis, Segmentation, etc.
- No limit on storage or processing
- If you can create an optimized solution you’ll get the bonus of speed.
The picture isn’t all positive, however. There are also a number of cons associated, these include.
- Cost: Upfront, Storage, & Processing
- Complexity: Time to Value
- Maintenance: Managing, Monitoring, & Optimization
- Discrepancy: Hard to match UI or API
BigQuery data pipeline
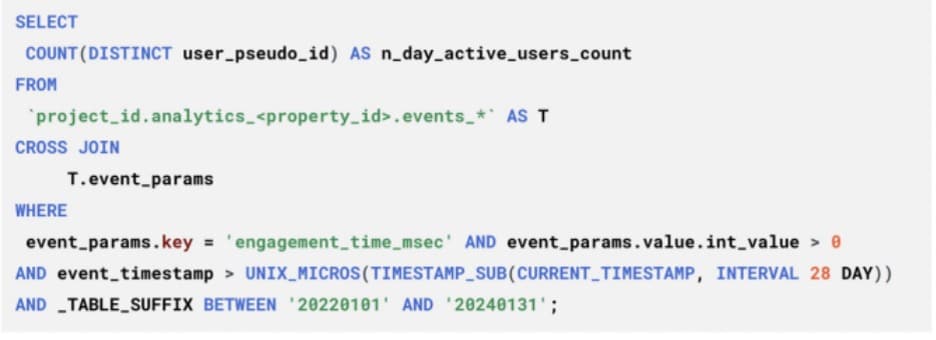
The above image illustrates how difficult this task can be. The SQL code covers a single metric for a date range of 28-day active users from the raw export table. The more information you apply (eg. breakdowns by city/region) the more complex this becomes.
If you have the will to go this route, do not go it alone. You can use the resources listed below:
- ga4bigquery.com Tutorials & Sample Queries.
- ga4sql.com SQL Query Builder.
- Analytics Canvas SQL Query builder.
- ga4bq.com SQL Query Builder.
Warehoused/cached 3rd Party Data Connectors
If you don’t want to build your own data connector, there are cached third-party data connectors available. These have advantages over Google Connector and BigQuery, helping us in a number of ways, including
- Stay below GA4 API quota limits and keep data flowing (an advantage vs Google Connector)
- Requires less time, money, and expertise to use (vs BigQuery)
- Better API coverage (e.g. Landing Page, UTMs, etc.) (vs Google Connector)
- Data ownership (A warehoused solution is an advantage vs Google Connector)
- Speed and UX: Faster filtering and report interactions (vs Google Connector)
- Google Connector can take 10+ seconds to refresh data after user interaction
Examples of third-party connectors
One example of a third-party connector is Analytics Canvas. This solution is specialized in Google Analytics. They have a warehoused data connector, so data isn’t just cached.
A snapshot is taken of extracted data and stored within the warehouse. The warehouse can be managed on Canvas’ BigQuery or your own account.
Other features include:
- A data transformation and workflow builder which is easy to use.
- Historical backfill
- GA4 SQL query builder
- UA historical data export
- Connects to both API and BigQuery Export
- Multiple project destinations:
- Data Studio, BigQuery, Google Sheets, Tableau…
Funnel.IO is another option that is available to you. This is also a warehouse connector, and all data is stored within their own warehouse. Alongside GA4, Funnel can draw from over 500 marketing and analytics apps.
Additional features are:
- They have a data transformation layer
- Historical data backfill
- Multiple project destinations:
- Data Studio, BigQuery, Google Sheets, Tableau,…
Cached data connectors
Cached data connectors don’t keep data forever. They do, however, apply a more agressive caching than Data Studio.
The first option is Supermetrics. This limits simultaneous requests to prevent users from hitting the concurrent requests quota. They have several layers of caching, as well as automatic retries if a request fails.
This is a quote from the company’s CEO “…we have a sophisticated caching logic to minimize
repeated requests… older data is cached for longer, newer data is cached for a shorter time… this limits the number of concurrent requests per GA4 property to stay below limits.”
Another excellent option is Power My Analytics. They also cache several fields and metrics and are adding more fields and date ranges.
Special Solution for concurrent requests
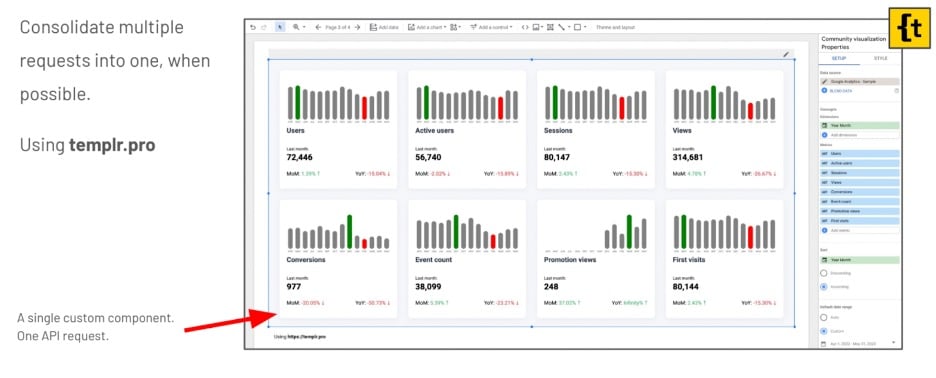
You saw in the earlier example two scorecards, each sending 12 requests. But with a community visualization called templr.pro, you create community visualizations with HTML. CSS and easy-to-learn templating syntax.
With this tool, one component equals one API request for all metrics over the last 14 months. You can also create a template to visualize all that data and avoid hitting the GA quotas.
Summary
Both GA4 & Data Studio are essential tools. Dealing with GA quotas, however, can be difficult. But as we’ve explored today, it doesn’t have to be impossible. Why not try and put some of these solutions into action?
Remember, the goal was to provide information, not a prescription. Take time to add up your options and you’ll find the best way forward.
About Ahmad Kanani
Ahmad is the founder and head of analytics at Siavak Analytics, a boutique analytics agency based in Budapest that helps ambitious online businesses leverage data to support strategic marketing and operational decision-making.
So far, Siavak has helped its clientele create systems and data pipelines using Google Marketing and Cloud Platform to collect, process, report, and analyze data for more than $4 Billion in combined revenue across online and offline channels.

- Top 24 Google Analytics Chrome Extensions & Sheets Add-ons - 21/05/2026
- Best Consent Management Platforms (CMP) - 19/05/2026
- Google Signals and Consent Mode: What This GA4 Change Really Means - 23/04/2026