Use GA4 and Looker Studio: Build Action
You may have heard that Google Data Studio has been given a rebrand. It’s now known as Looker Studio. Google Analytics (GA) has also been given an upgrade. GA4 is the latest and greatest iteration of the tool.
Together GA4 and Looker Studio combine to create fantastic and detailed visualisations. But if you’re new to using the tools, you might not be sure where to start. Don’t panic! This article is here to show you how to use GA4 with Looker Studio.
Today, we’ll be exploring the following areas:
- We will help you to understand why you should and shouldn’t use Looker Studio and GA4
- We’ll look at the GA4 Structure and how it can be used with Looker Studio if you use custom visualisations.
- We’ll hop into the tactical strategy for utilisation.
- We’ll talk about GA4 Limitations
- We’ll look at the huge limitations of the GA4 API.
- We will talk about your plans.
This is a write-up of JJ Reynold’s talk at GA4ward. You can find a link to his Slides here. Here’s a recording of the webinar too:
Why does GA4 exist?
There were a few problems with the older Universal Analytics (GA3). These included:
- GA3 was session based.
- There were scope problems with page views and events.
- We had to carry out lots of hacks in order to do event management.
- Measuring apps was difficult.
- We had to jump through hoops to export data.
- There were only three event variables (Category, action, label).
It’s fair to say these fallbacks were causing problems. People weren’t getting the data that they needed. Google tried to fix these issues in GA4.
GA4 brings the following solutions:
- Everything is now an event.(once you can grasp this your life is changed!). So you can’t use views in GA4 like you used to do in UA.
- You now have unlimited customization (we’ll talk more about this later).
- There are data streams (apps vs web).
- There’s an unlimited event collection (this could be a godsend or a terrible nightmare depending on how your tech stack is situated).
Why would you want to use Looker Studio?
There are five main reasons why you might want to use Looker Studio:
- There are two types of people in this world: GA people and non-GA people. Looker Studio can be used with or without GA. You can cater to people in both camps.
- It will bring advanced interactions. You can drill into sources and sessions, and add explanations to your data.
- You can build custom UIs to make your reports look better.
- You blend different information together.
- You gain a centralized location for everyone to look at.
So, what do we do with GA4?
The customizations in GA4 translate into Looker Studio. When learning how to use GA4 with Looker Studio, your planning – it is where you will get the most benefit.
Imagine you go to the grocery store. What do you see? Bell peppers, tomatoes, and a whole manner of vegetables. With these, you could make a delicious curry. You could make some fried food. Or, maybe you could make a tasty soup. Think about your GA4 visualizations in the same way.
You can take your events and parameters and build something that is unique to you. That’s the beauty of GA4.
Everything is an event
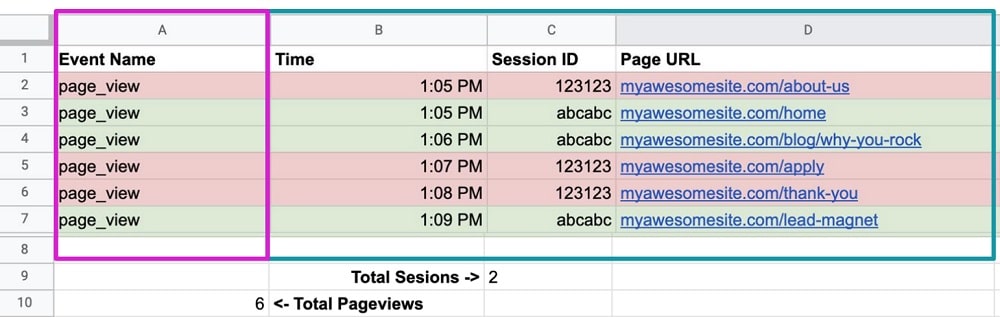
The biggest thing to remember is that in GA4, everything is an event. As you can see in the image above, we have six page_view events. We can also see the time each event occurred and the session ID.
If you count all the session IDs that occurred at one O’clock we can see that there are two session parameters. But we also have six-page view events in the background; you’ll need to get your head around this when you start using GA4 and Looker Studio together.
#1 Think: event or parameter?
When looking at your data, you should always have this question in mind. Here’s how you can tell the difference between the two.
- An event equals a conversion (even micro conversions). For example, page views_view, generate_lead, view_item, and add_to_cart are all conversions.
- Parameters are any modifications or nuances. They give you more insights into your events. For instance, you might learn that a page_view occurred on the about page.
Data collection strategy will Improve your visualization strategy
Your data collection strategy will dramatically change your visualization. It will set you apart from your competition. But first, you need to master your data collection strategy. To improve your process, ask yourself these important questions each time you collect data.
- What questions do you have?
➭ What information do you need to have to make an informed decision?
- What action do you take?
- Do you have the best information possible?➭ What information do you need to make a decision?
- What action will you take?
#2 Think: event or parameter?
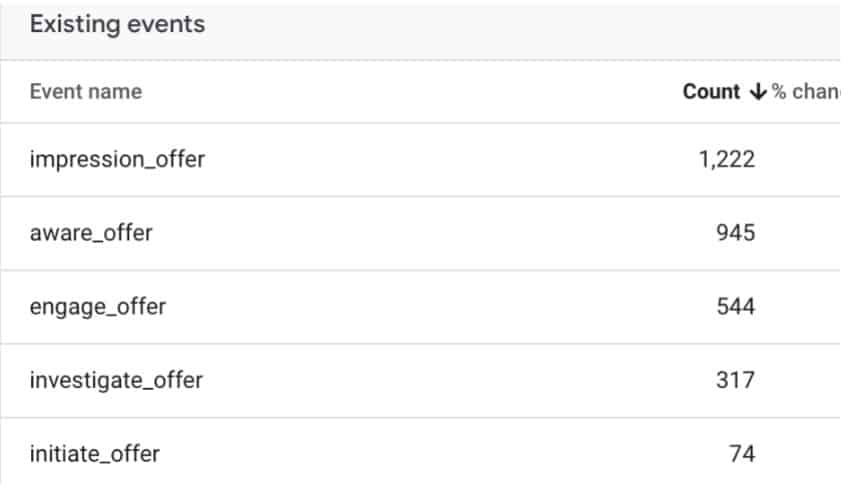
You probably haven’t seen these events before. That’s because they are custom events. As the image above shows, you can make any event you’d like.
As we’ve already established, each event is a conversion. But there are different levels of micro conversions.
You might have an inline blog post call to action. But did anyone see it? Furthermore, did anyone engage with your CTA? These are both forms of micro-conversions. You can set these up very easily in GA4.
But what about parameters? If someone has engaged with an offer, you’ll probably want to know which offer. This is where parameters come into play. You can modify your events with additional information, helping you to better choose a visualization in GA4 and Looker Studio.
A real-world example:
Let’s look at the website LookerStudio.VIP. This is a content site, it contains some custom visualizations, lead magnets and a cheat sheet.
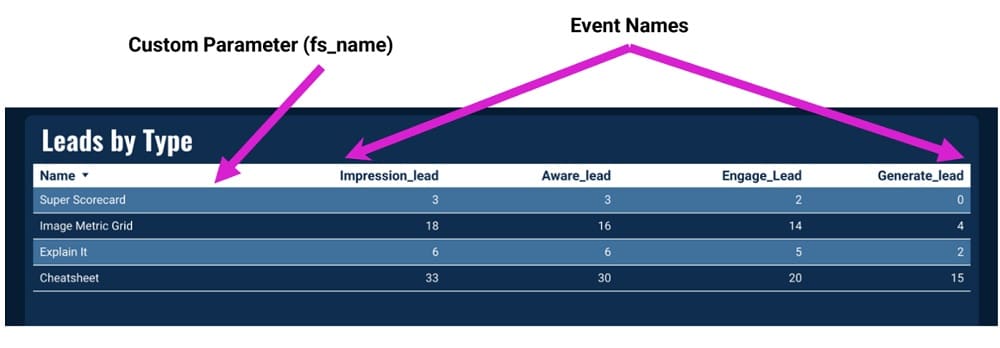
Above we can see some leads from the website that took place on a single day. From the image, we can see information about website content:
- The number of users that saw the content
- The number of users who stayed on the page
- The number of users that engaged with the content
- The total number of leads generated.
But you might be wondering, how did we get this information? Firstly, we created custom parameters (fs_name). Then we added event names for each micro conversion. It’s as simple as that.
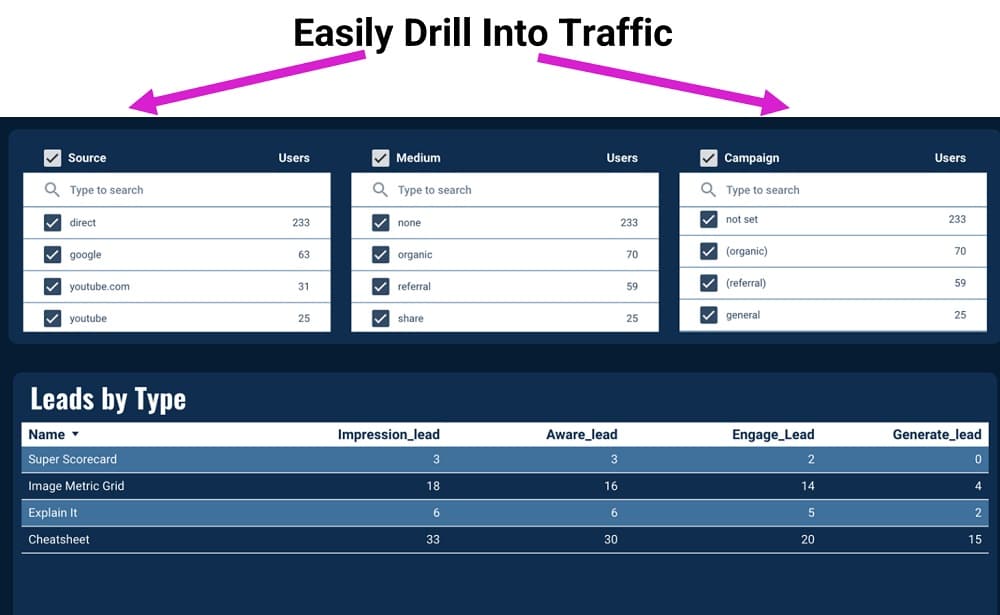
Let’s drill a little further into the traffic. We can view by source, medium, and campaign. Want to only see organic traffic? We can easily do that here. Would you rather only see referral traffic? Again, at the click of a button, we can accomplish this.
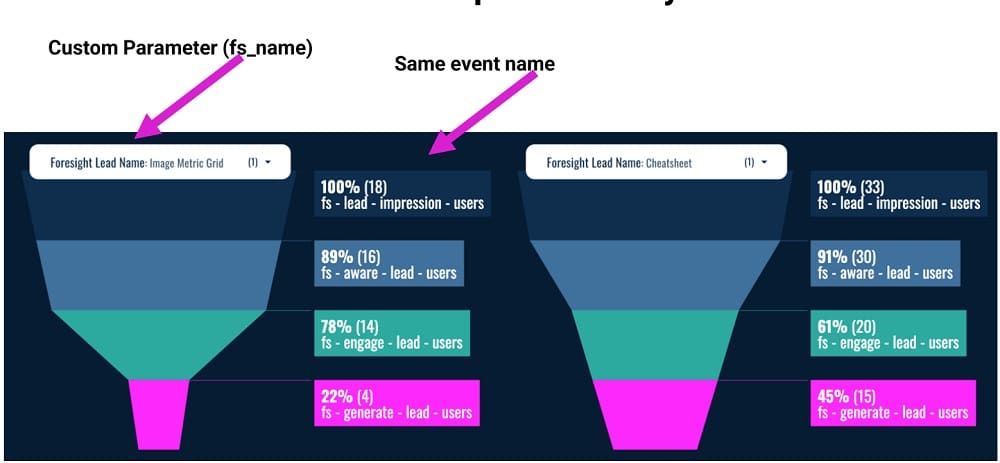
We can now take this same information and build it into a visualization. As you can see, in the image on the left we have the image metric grid, and on the right, we have the cheat sheet. These are very different funnels, but they can be easily compared. Why? Because we’re only using two ingredients, the event name, and a single parameter.
#3 Think: event or parameter?
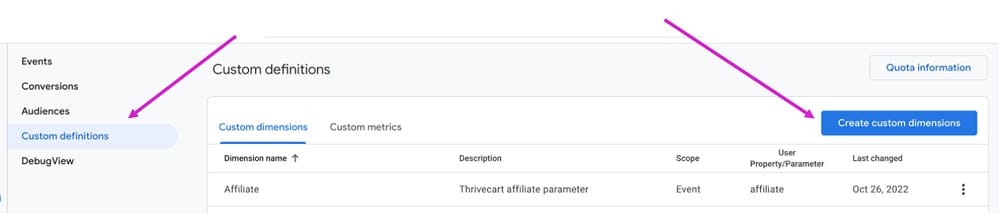
An important point! – To access parameters in GA4 and Looker Studio using a direct connection, they need to be turned into a dimension! To do this, go to your Admin settings > Custom definitions > Create custom definitions for your parameter. You can then access this in Looker Studio via direct connection.
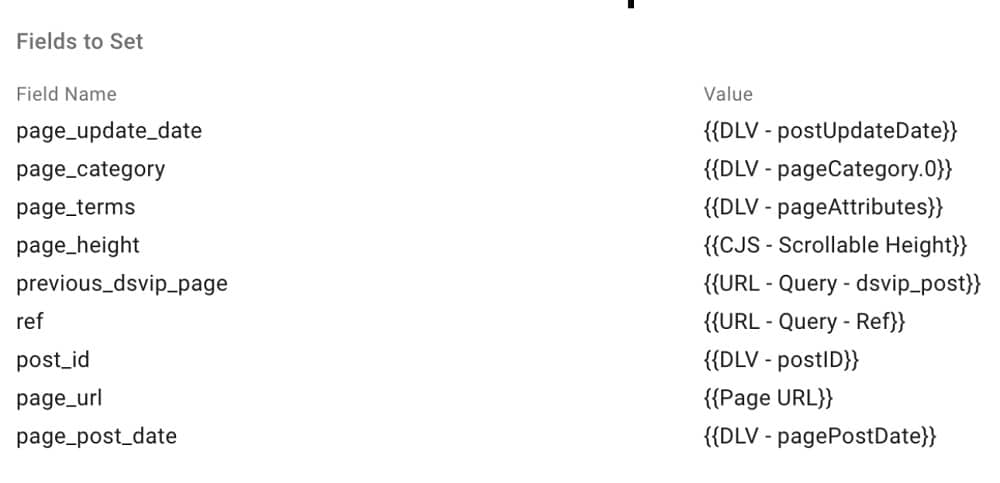
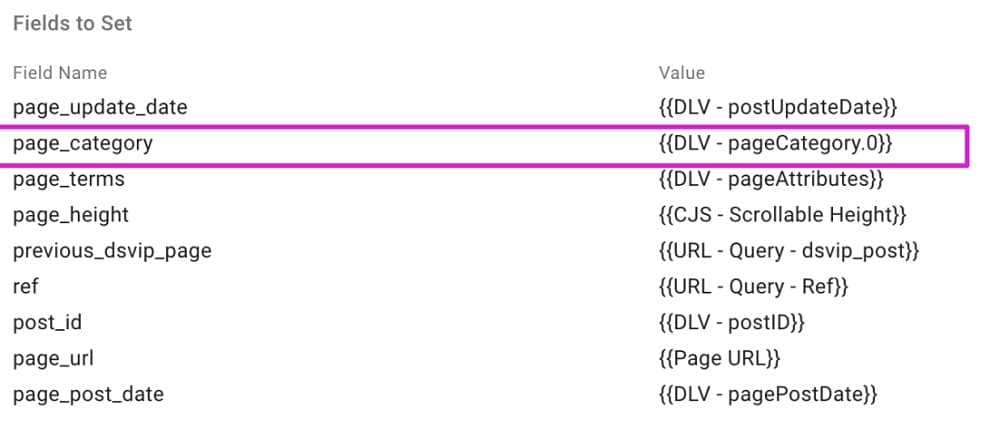
Another important point! – Events are not tied to parameters. What does that mean? In the image above you’ll see lots of values being sent with each event. The fact is, every event can have any parameter.
Another real-world example
The ‘page_catergory’ event is really important. We’ll look at an example to illustrate why.
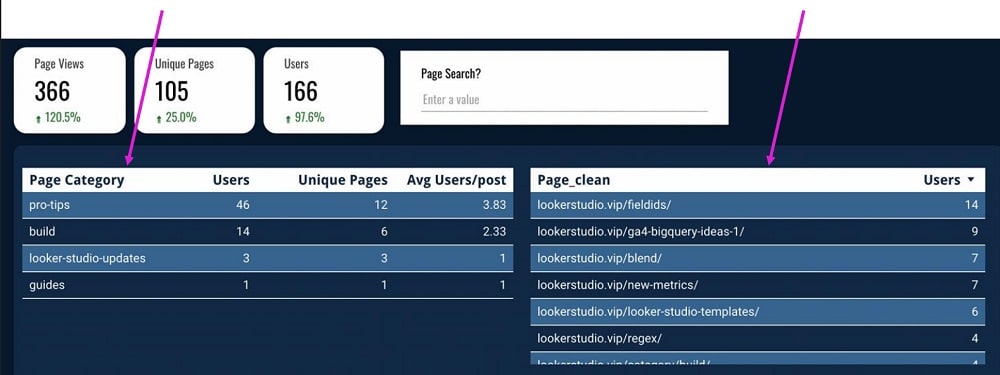
In the image above you can see our page categories. If we click the ‘pro tips’parameter, it will filter every single page that exists in that category. You can see all the clicks, scrolls, and other interactions that occurred. Just remember that events are micro-conversions that and parameters are modifications.
Take a deep breath…
Things have gotten a little wild recently with API limits. Lots of people are asking themselves, ‘how can I get this to work?’. Let’s take a deep breath before we move on to the next stage.
The big problem
GA4, Looker Studio, and the process of connecting the three are all free. But now we’re limited to 1250 core tokens per property, per hour. Put simply, we can only spend around 15 minutes building something before we hit the limit. We can only have ten requests at the same time. In other words, you’ll struggle if you’re building some really complex reports.
To put it mildly, this took everyone by surprise. But what are our options?
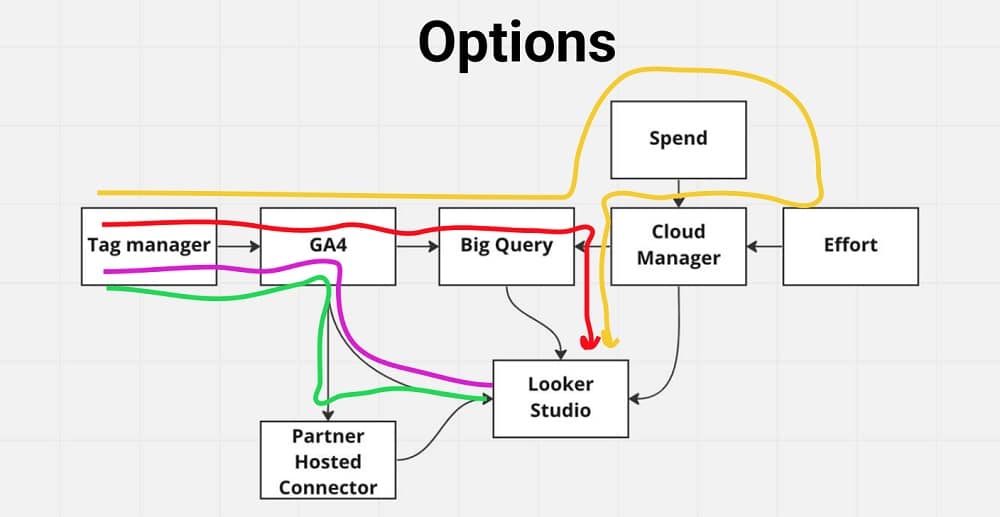
Google Tag Manager (GTM) sends information to GA4. From here we have a lot of options.
Option 1: GTMr>GA4>Looker Studio. With any type of complex reporting, you’ll hit the threshold very quickly.
Option 2: GTM>Ga4> A partner-hosted connector>Looking Studio. A partner-hosted connector will cash information to help you keep within the API threshold.
Option 3: GTMr>GA4>Big Query>Looker Studio. The problem with this solution is that BigQuery is complicated. If you have a developer team that can write in SQL, this option will work for you. Otherwise, you might need to look elsewhere.
Option 4: GTM>GA4>Big Query. This is the first step to this option. You’ll then need to put in a lot of effort and learn a new tool such as cloud Tag Manager. The only issue with this option is that it requires money. The days of the free connection seem to be almost gone.
Of all the options, option 4 seems to be the most feasible going ahead.
API limits solutions
To put it in more simple terms, you have the following options.
- Use fewer charts – Not many people will go for this option.
- Share with fewer people – This doesn’t really work, especially if you have lots of people at your client company viewing your work.
- Upgrade to GA360 – You’ll still run into the same problem (the limit is ten times bigger but still exists).
- A data warehouse – Using unmanaged Big Query.
- A managed data warehouse – You’ll need teams of people maintaining your server.
- Warehouse connector – This should help to limit the API threshold.
Remember…
Everything is an event. Visualizations require you to think of your data collection strategy. What events are you storing and what parameters are associated with them? Answering these questions is key if you want to create visualizations without anything messing up your numbers.
So, let’s be strategic. Because your strategy and GA4 are going to become more tightly knit than ever. GA4 has more limited default reports than Universal Analytics. That’s why you need to start customizing as soon as you can.
How are you strategizing beyond the basic page views and purchases? Without a proper strategy, you’ll put in time money and effort, but not get the results you need. Try to remember these important factors:
- Ask better questions than the default reports.
- Everything is an event (within reason).
- Parameters help you understand “next-level nuance”.
Bear these points in mind and you’ll build the best visualizations with GA4 and Looker Studio.
Further Reading
Want more? Check out our blog for tips on Google Analytics, and a whole host of other Google packages.
GA4 and Looker Studio, how to use GA4 with Looker Studio
About JJ Reynolds
JJ has worked alongside 1MM Startups, Multi-Billion dollar companies & everything in between to develop custom measurement & visualization solutions that dazzle everyone in the room. He and his team at Mediauthentic pride themselves on providing clients a true marketing data partner they can rely on and trust.
When not speaking or talking with the team, JJ can be found mountain biking in the scenic hills surrounding Lake Tahoe or working remotely from various coffee shops, carefully crafting his next witty blog post.

Socials:
- How to Blend GA4 & UA Data Using BigQuery & Looker Studio - 12/07/2024
- How to do a Google Analytics 4 Audit & Mistakes to Avoid - 10/07/2024
- How to Backup & Visualize GA3 Data for Free - 27/06/2024