Getting to Know Dataform & BigQuery and How to Use Them with GA4

You might not have heard of data management with Dataform. But if you’re using BigQuery, it’s an essential tool for improving your ETL processes. It’s something that you need to think about now when you’re planning your data lake. Introducing BigQuery Dataform.
This is a write-up of the talk by Artem Korneev at GA4ward MKIII. You can find his slides here, and the recording is below:
This article will cover a recent BigQuery project involving Dataform. We’ll help you to better understand the platform, and how it can be utilized in Google Analytics 4.
Issues with using Google Analytics 4 data in BigQuery
One of the best GA4 benefits is its ability to integrate with other tools. One powerful example is GA4 integration with BigQuery. As you probably know, we can export data to the tool for free, and Google will create daily tables with rows of events. These allow us to build reports, merge with other sources, and much more.
This is all great, but how can we actually build tables for reports?
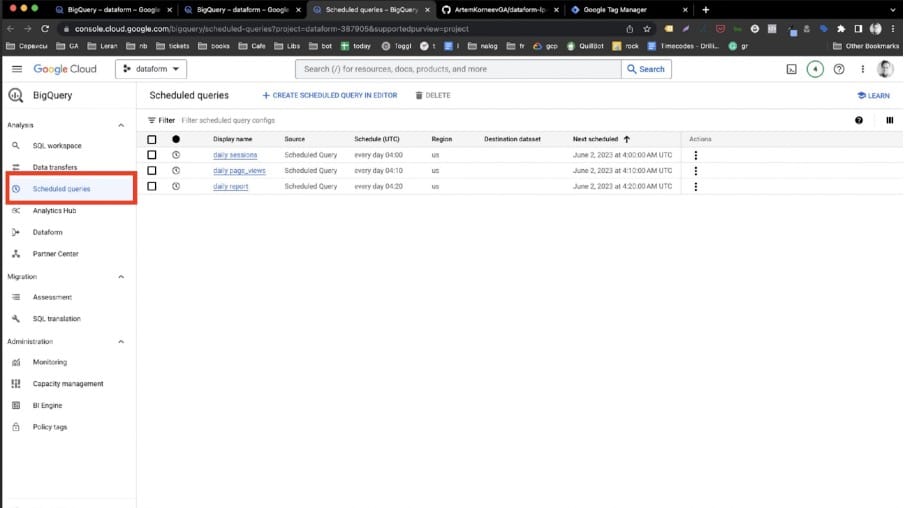
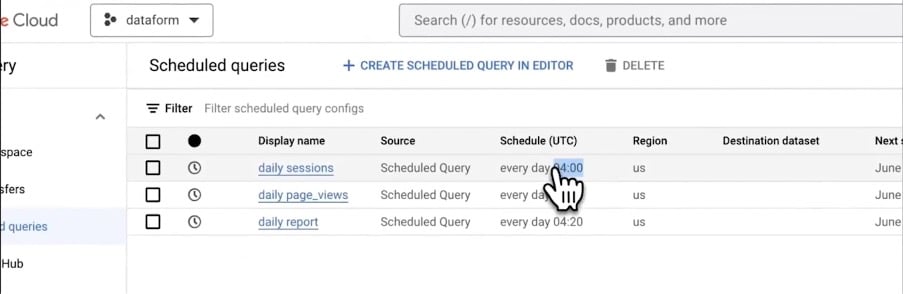
The easiest way to work with BigQuery data is by creating scheduled queries. It’s okay if you only have one or two queries, but very quickly you face a few problems. Let’s look at some of these issues.
1. We don’t know the exact time
Firstly, Google doesn’t guarantee the table’s update time.
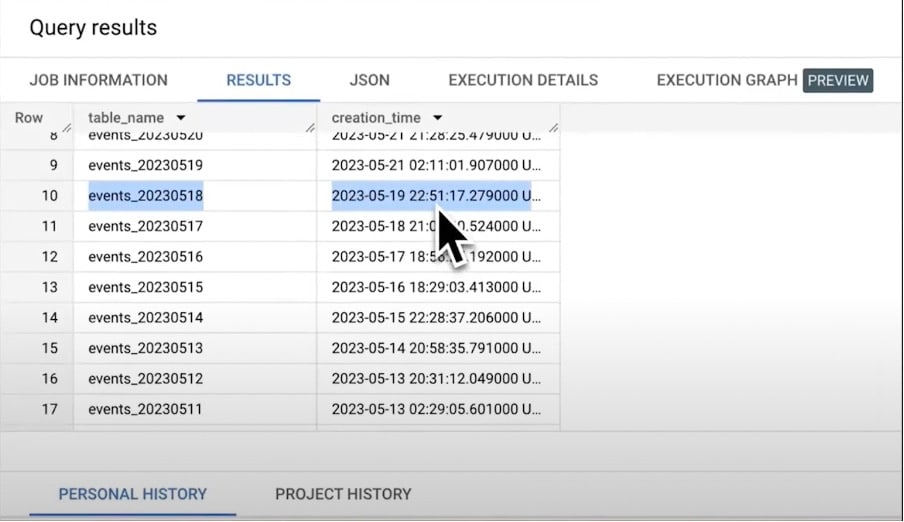
Above is data relating to a personal blog. We have queried the informational schema for the GA4 dataset to get the creation time for all daily tables. As you can see, we normally get tables at the end of the next day.
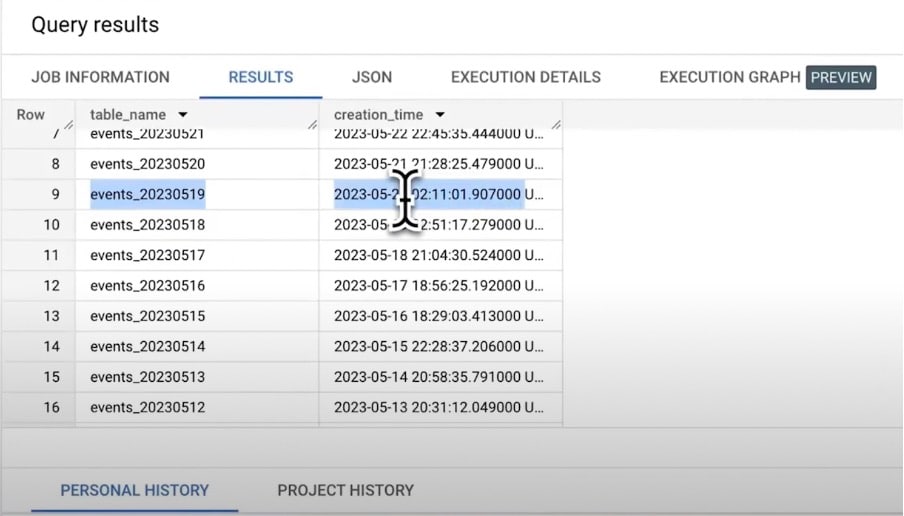
But occasionally, they will only be created every two days. We have a huge delay and have to process data for two or four days to be sure we get all the desired rows.
2. Table dependencies
The next problem is table dependencies. Usually, we can process data in a few steps. Firstly, we have to create a set of tables based on GA4 events and sessions. We need to run data reports not on a row of data, but based on these prepared tables.
We have to wait until the previous step has finished before we can run the report tables.
The simple approach is to add a time delay for schedules between steps. But this isn’t safe, because we don’t know the time of processing. Potential steps could take different amounts of time based on traffic spikes and other factors.
3. The mess
The more queries we have, the more difficult it is to support our code base. It’s not easy to understand who made changes to BigQuery and why.
As you grow you’ll use the same code blocks in different queries. This might include channel group and definition, base metric, or some other factor. You might find yourself in a situation where the same metrics are calculated in different ways.
DataForm is already here
Dataform in 2023 is one of the tools that can help us to clean up this mess. And luckily, it’s already integrated into BigQuery.
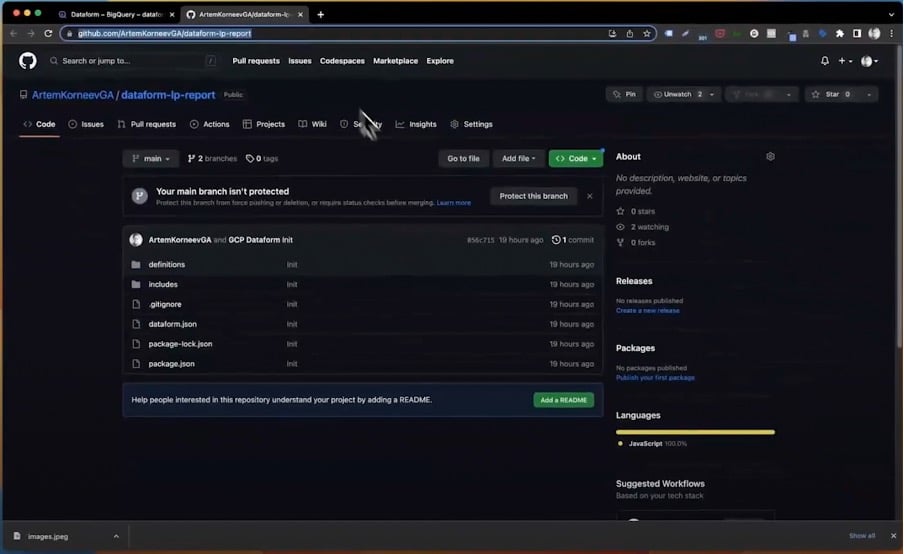
We created a Dataform repository and connected it to the GitHub repository. All the models use the GA4 sample dataset, although you need your own data to play with examples.
Let’s look at some of the best Dataform features and how they can improve data pipelines.
Best Dataform features
Folder structure
The first important file is ‘dataform.json’. This contains all default settings plus variables.
Next, we have the includes folder for constants and JavaScript helpers.
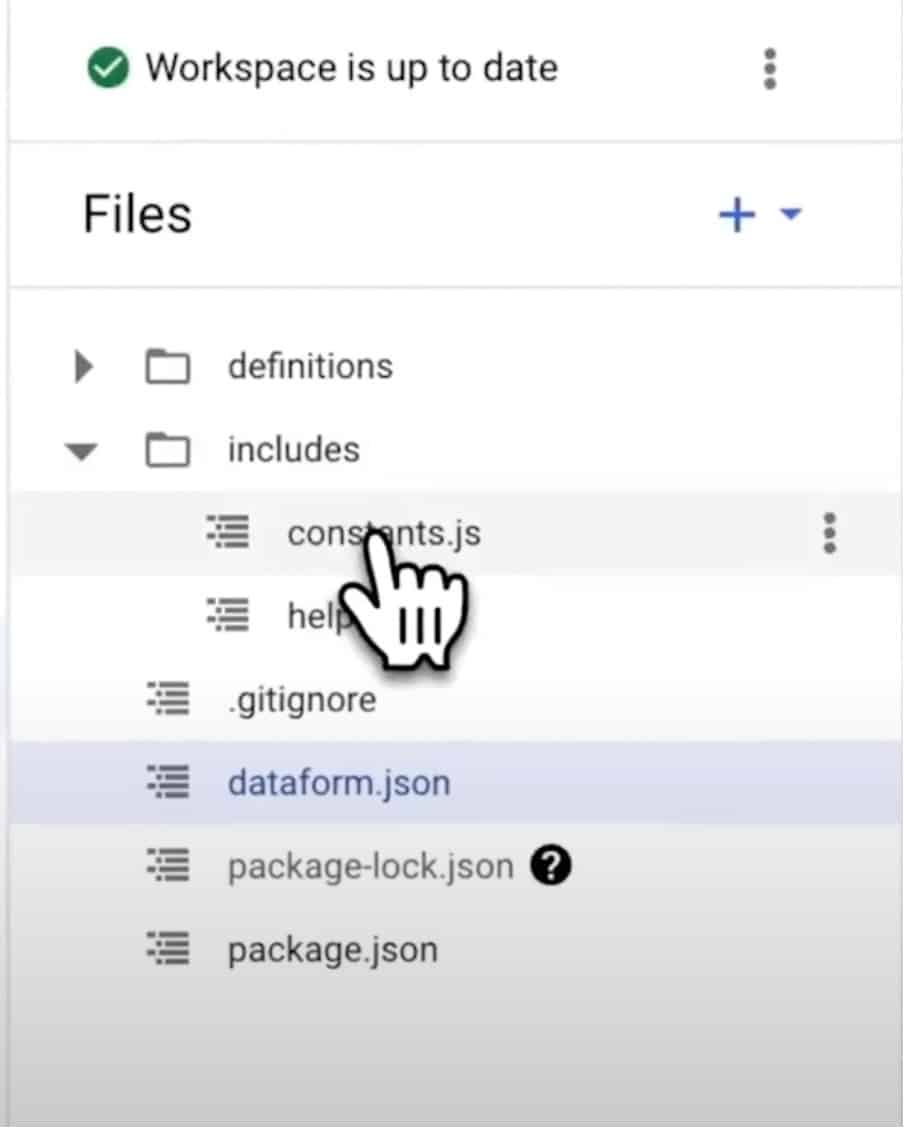
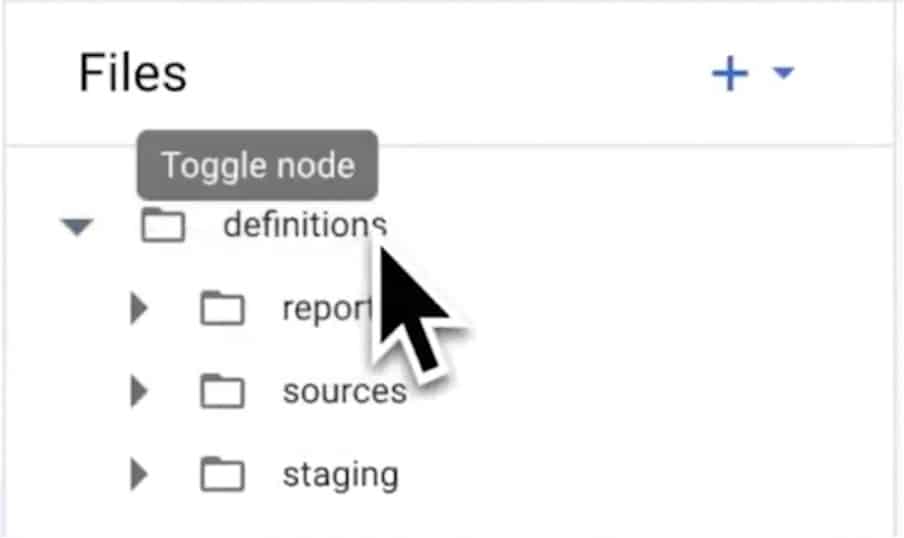
All the code is stored in the definitions folder. This includes:
- Sources – define external sources which are not created in Dataform. We’ll use it to define raw GA4 tables.
- Staging – for defining intermediary models that are used within your Dataform project.
- Reporting – for models of downstream users and processes. It’s here we’ll keep our sample landing page report.
This is the recommended folder structure, but you can use your own or add subfolders. Creating a well-defined structure is the first step to reducing the mess.
SQLX
Models for actions in Dataform are defined in SQLX files.
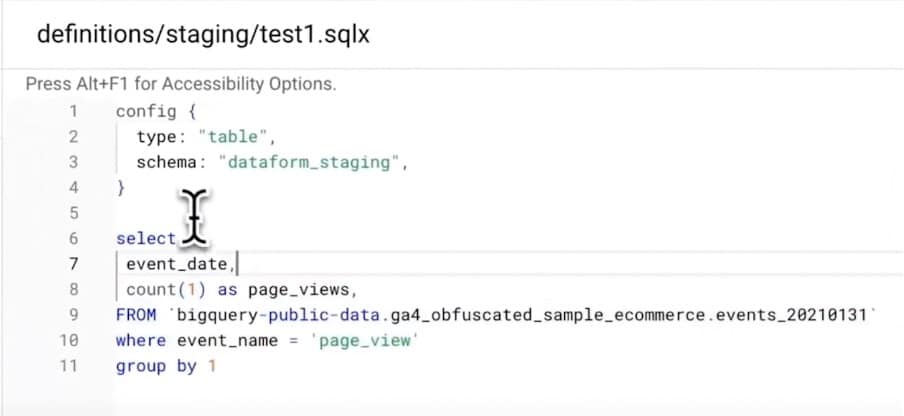
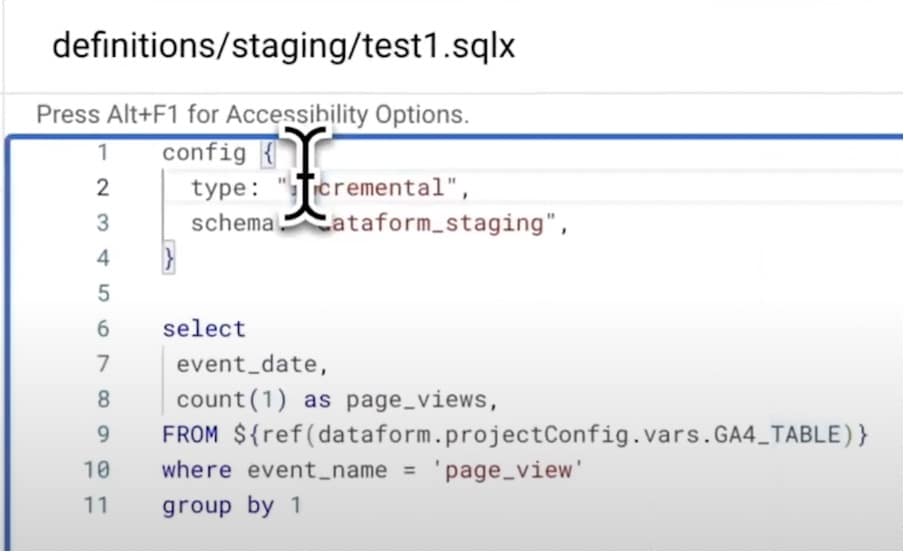
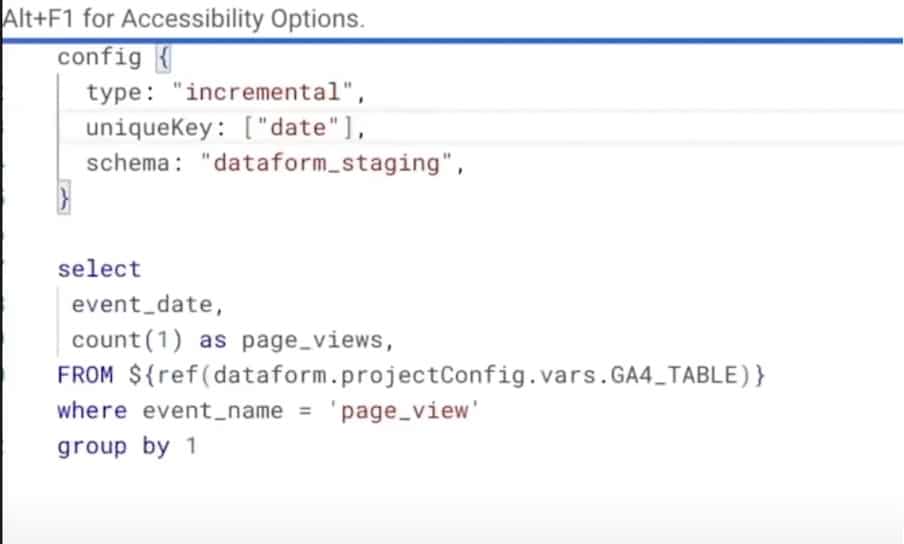
Let’s have a look at test1.sqlx. The code is made up of the usual SQL, plus the configuration block. In the config section, we’ve defined the type as “table” and the schema as “dataform_staging”. The table type is the simplest element.
For each execution, BigQuery Dataform and GA4 will recreate the table. But as you can see, there is no need to define a grade or lead statement. This is because Dataform will generate it for us.
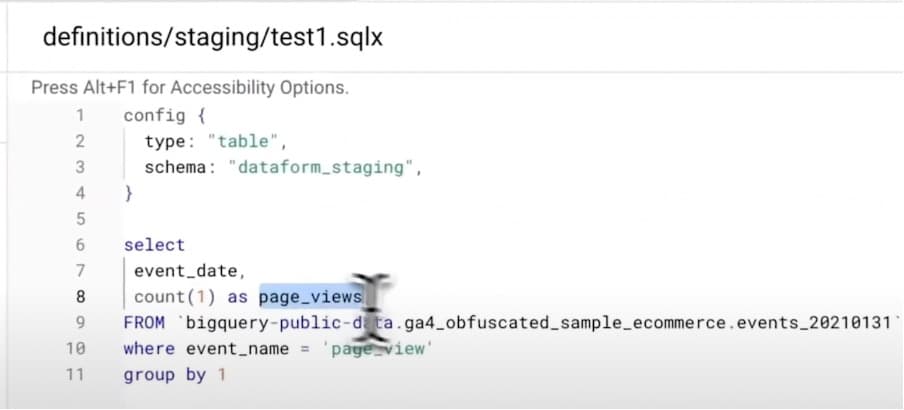
The SQL code will simply count the number of page views for a one-day table.
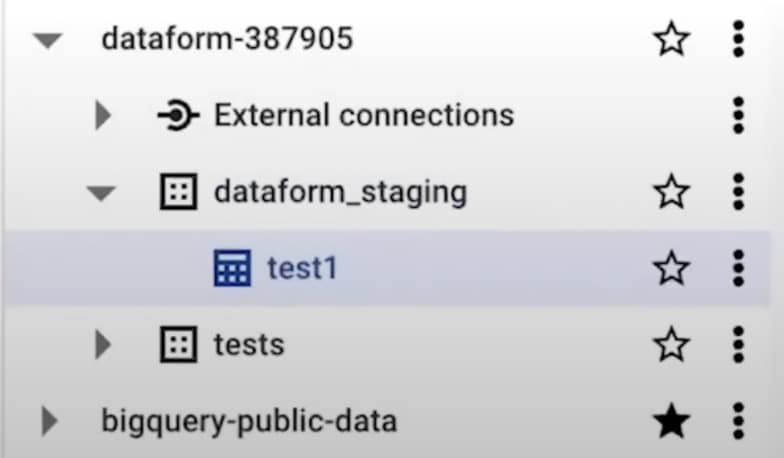
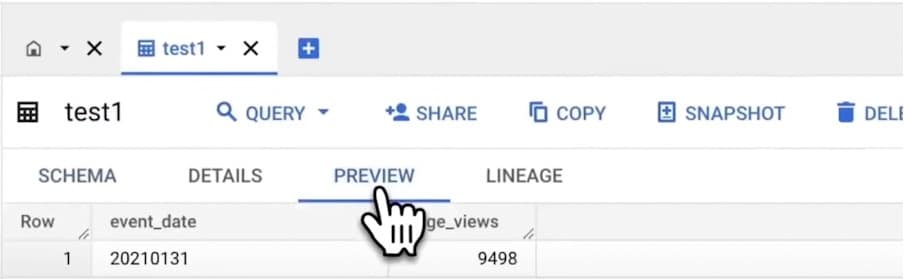
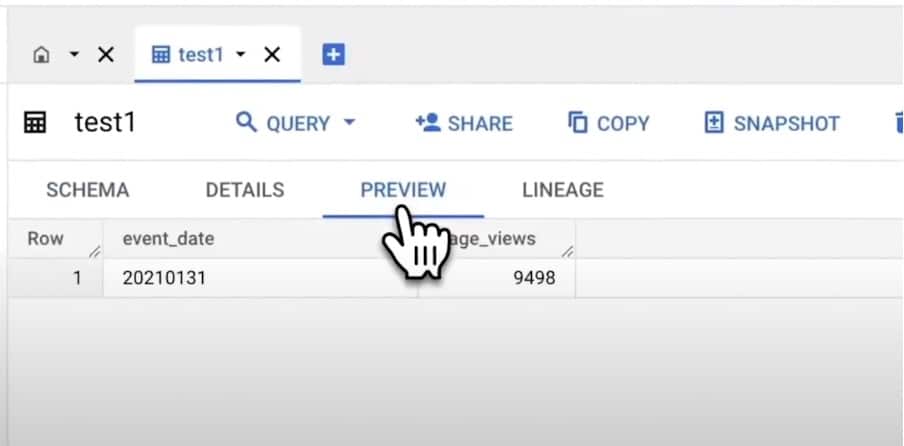
By executing this code, BigQuery Dataform created the ‘dataform_staging’ dataset, and a new table called ‘test 1’. By default, the table name will be the same as the action file name ‘test1.sqlx’. We can use the file name as a reference for this model.
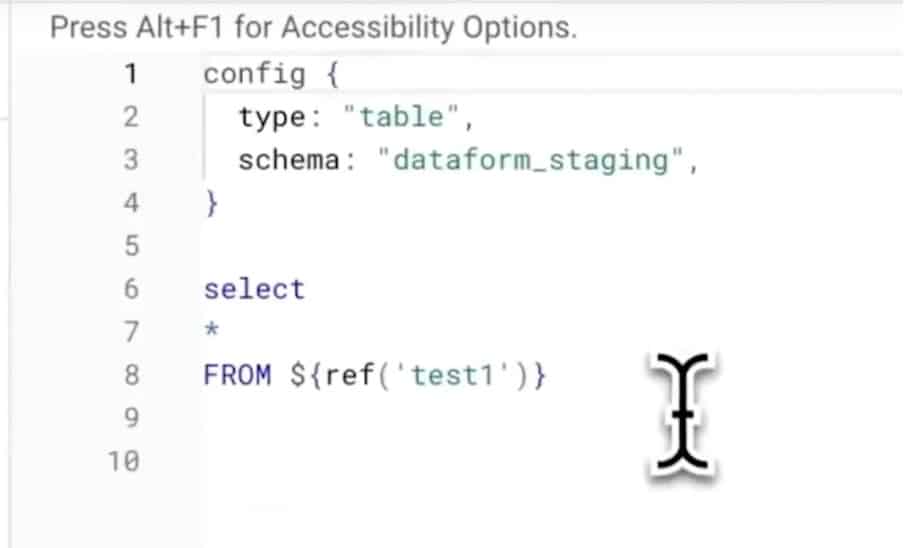
For example, if we switch to ‘test2.sqlx’, we can see the ref statement.
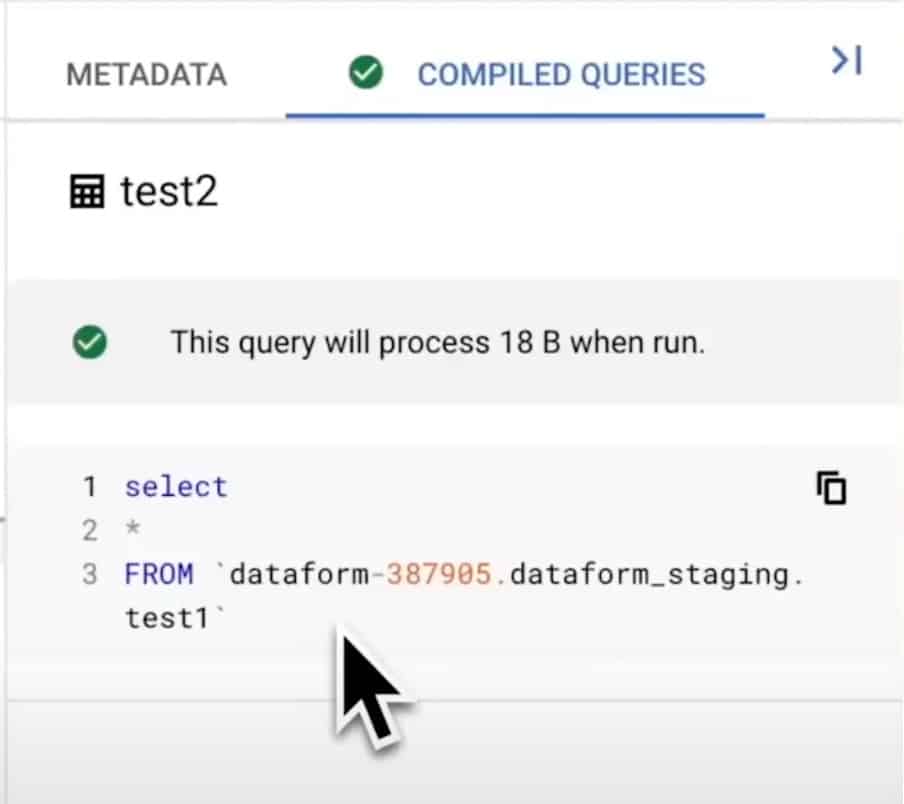
But by clicking Compiled Queries, we can see that the Dataform will change the ref to the full table ID. Ref is the core concept of Dataform, it allows the platform to understand dependencies and run tables in the right order.
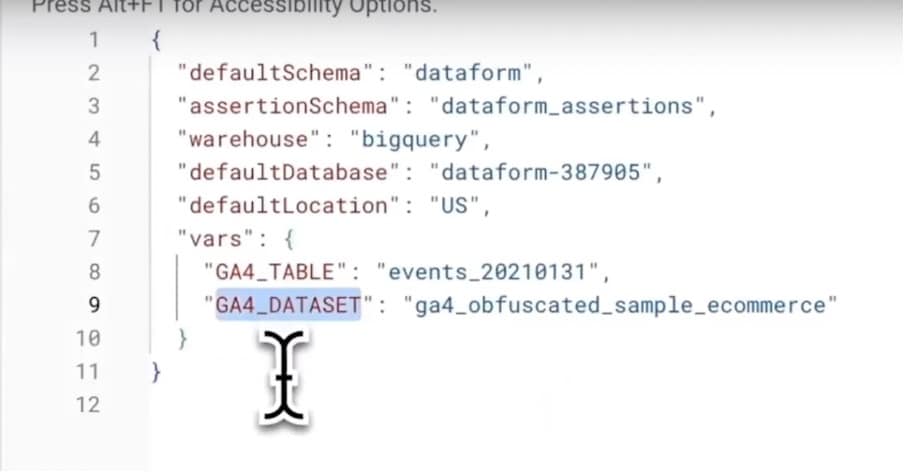
Returning to the test 1 model, if we go to the global dataform.json config, we can see the variable’s definitions. The table name is January 31st and we are using the same data as the test 1 model. We can also change this value to the variable as we did in the declaration file.
As we can see, the result will be the same. If we decided to clear all dates, we can use events_*. Again, this table is defined in the declaration.js file.
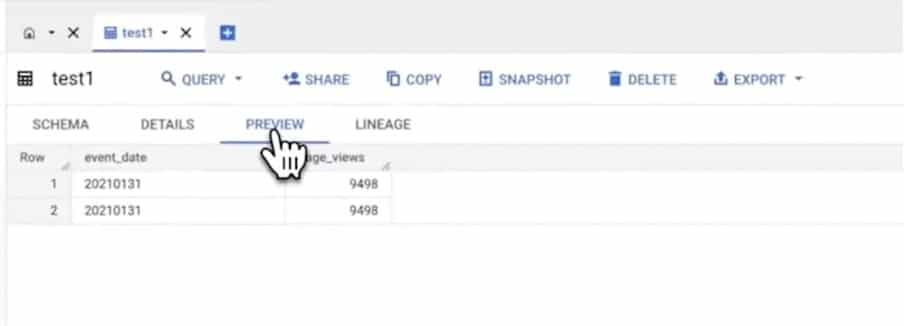
If we run this action several times, BigQuery Dataform will create a table for each run. But if we change the type to “incremental” Dataform will insert the SQL result into the table.
Let’s try this out. First, we check the numbers.
Now we can run the action. The result is that we have double the page views. But this isn’t what we need. As we know daily GA4 tables can be updated a few times per day – we don’t want to insert the same rows twice.
To solve this, we could add a uniqueKey date in the configuration block. Instead, BigQuery Dataform will generate a merge statement. This means that if a table already has a row of the same key, Dataform will update this row.
For new keys, Dataform will insert values. We can now safely run Dataform actions for each GA4 update.
The last test is to rerun the model from scratch, check the numbers, and run the model again. The numbers have not changed.
Again, the SQL code stayed the same. The only slight difference is due to the configuration block. We don’t care about table create, insert, or merge statements. We only care about SQL code for our model logic. BigQuery Dataform will do all the magic for us.
JavaScript helpers
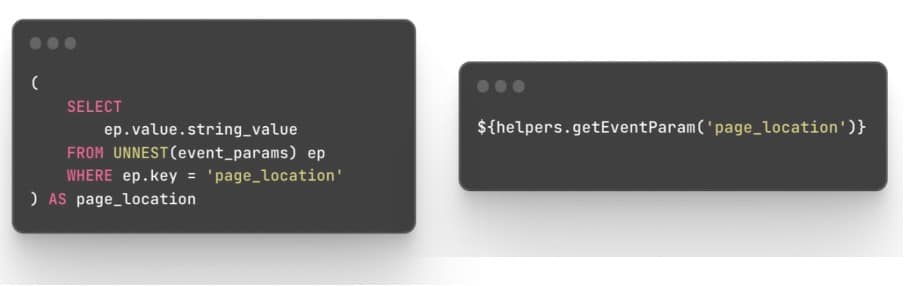
In the GA4 schema, we have nested fields. To get the event parameters, we need to first need to unnest. This is a rather long piece of repetitive code, that we don’t want to be constantly recreating. To solve this, we can define a JavaScript helper that can be used in our models.
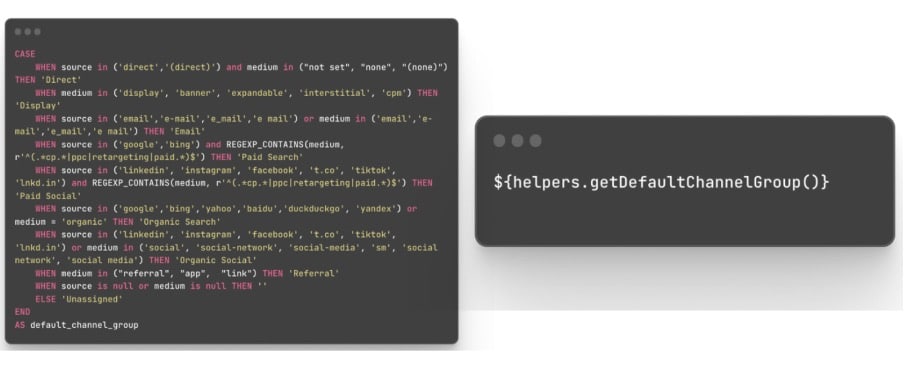
The second example is channel grouping. Again, this is a long piece of code that could be defined in the same way for different projects. Using the helper method, we can reuse it.
Of course, in Dataflow we can do more complicated things with JavaScript. For example, we can dynamically define models based on configuration files. Again, using JavaScript, we can reduce code duplication which leads to a more robust solution.
Git + Workspaces
One of the best Dataform features is Git integration. In Dataform each data engineer could have their own workspace. You can do all your tasks and create new models in separate environments.
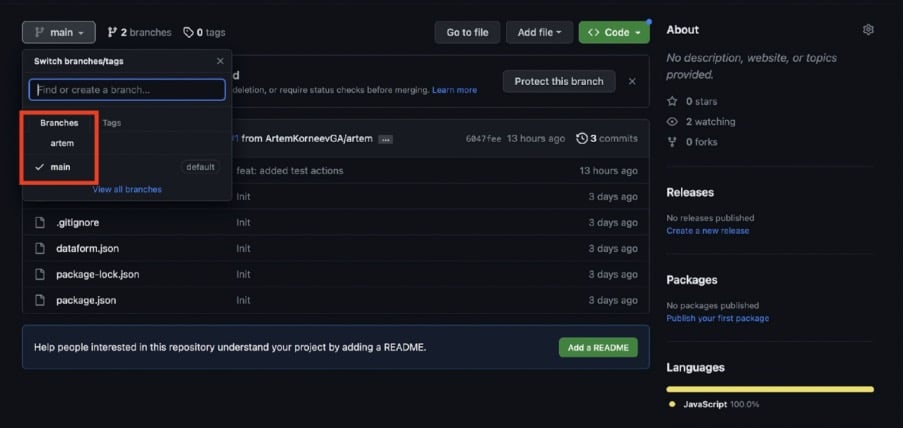
As soon as you’re ready, you can push these changes in your own personal branch. Using this method, you won’t break anything before you merge onto the main branch.
In your company, you could have a process for how you merge changes onto the main branch. For example, the data engineer will review all the changes before applying for a full request. You can easily find who made changes and when. You can define the process, and even revert to a previous version.
Scheduling for GA4
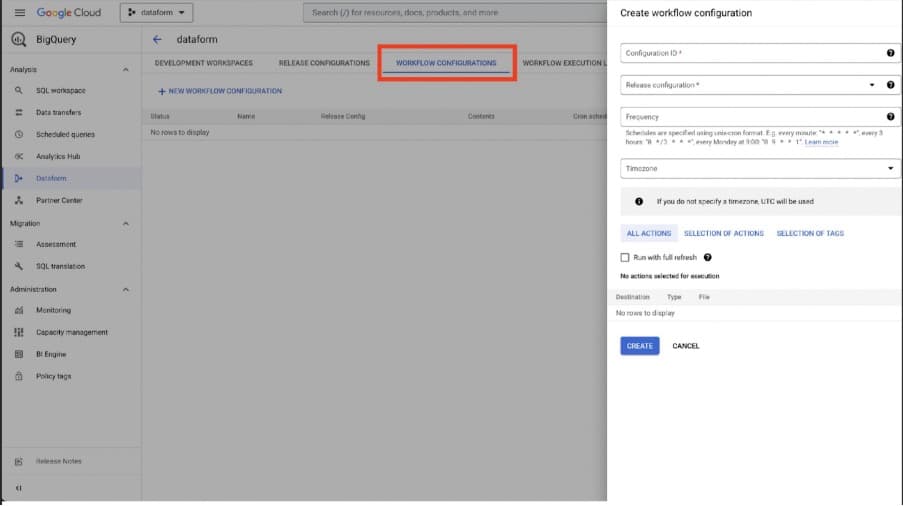
This step is still a bit tricky. Recently, Google added workflow configurations in Dataform. This allows users to run updates daily, but this isn’t recommended. We don’t know the exact time of the GA4 table daily updates.
It’s better to use API or cloud workflow to trigger the execution as soon as the daily tables are ready.
Benefits of the ref function
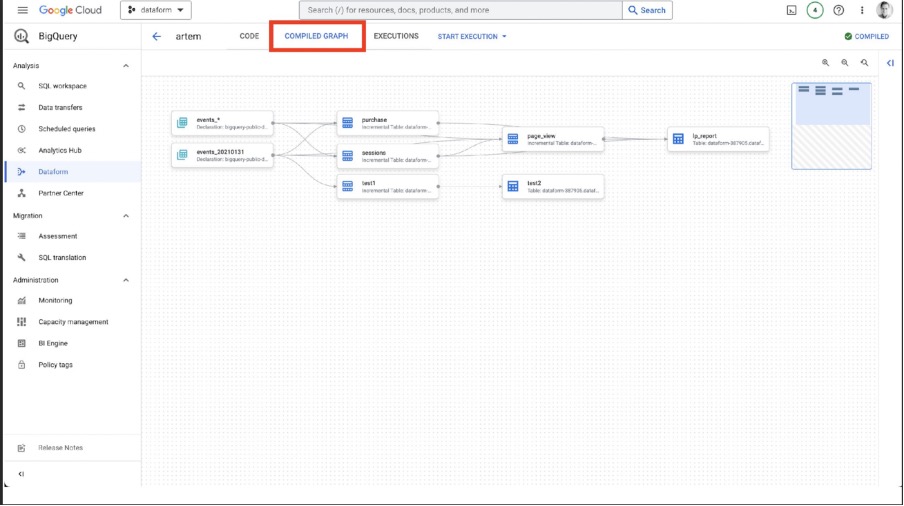
If we go to the compiled graph tab, we can see a graph with table dependencies. This will run all actions in our test project in the right order. We can see from the image above that ‘test 1’ is updated first and ‘test 2’ is updated second.
But sometimes after GA4 Integration with GCP we have more than one dataset within the same project. In this case, we can create separate SQLX for each GA4 property. We can also add different tags in the configuration block. In this way, we’d only be running the actions we need.
Tags are also useful if you have weekly or monthly reports. We can create a separate schedule for different triggers, and each trigger will run its own tag (all actions with this tag).
Now that we’ve looked at some of the best Dataform features, let’s look at reporting with Dataform.
Reporting with BigQuery Dataform
Landing page reports #1
Landing page reports generally have two levels. These are staging and reporting. At the first level, we prepare sessions and events. At the second level, we build tables for reports that require a schema.
Sessions table
Sessions are a huge topic when it comes to GA4 BigQuery data. As you might remember, GA4 daily tables contain raw events not sessions. Usually, you can build sessions from events in a few steps. Let’s discuss some of these.
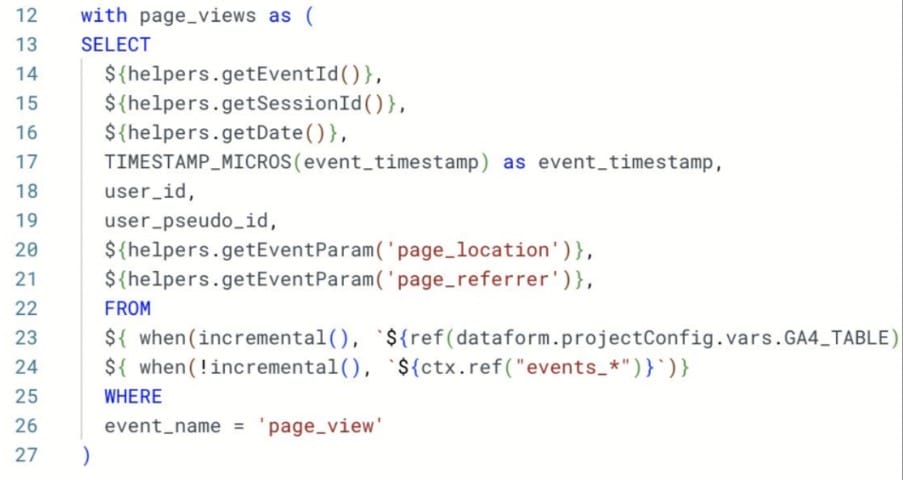
Prepare events
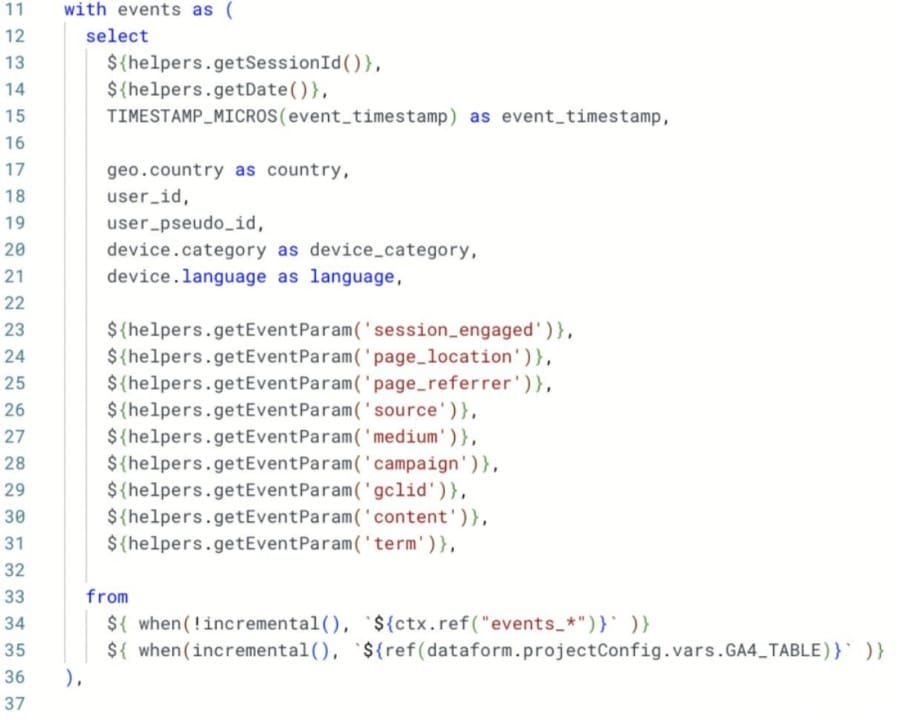
The first step is to prepare a list of event parameters needed for later steps. As you can see here, we used our JavaScript helper to define SQL code. We also have session ID, date, and a few other parameters.
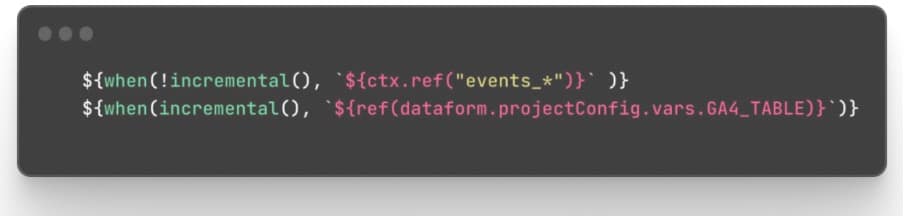
We used two Dataform helps “when” and “incremental”. The incremental method returns false on the first run. After a refresh, this returned true. For the first run, we require events from all tables. For the next run, we only get the last-day table.
Session ID
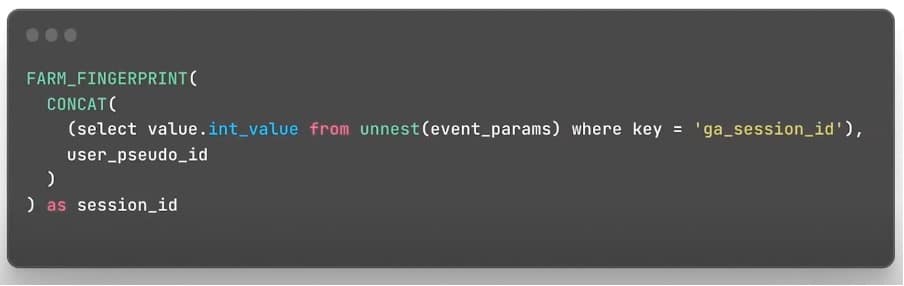
In GA4 event parameters, we have the ‘ga_session_id’ field. But this is not unique. It needs to be connected with ‘user_pseudo_id’ to gain a unique key for sessions.
Group events by session ID
Usually, for a session, we get the source, medium, campaign, and more. We also get the first page location, page referer, session start, session end, and session engaging parameters.

In this example, to get the first value, we use the “ARRAY_AGG” function, alongside “SAFE_OFFSET”.
Redefine source/medium
Google generates source and medium values in event parameters. But we can add extra logic here to better understand the impact of paid channels. Each session has a session_id, we have changed referral traffic to organic or social based on the traffic.
Event tables
Event tables are usually simple. But in production, it’s a good idea to add additional checks on data quality. For example, for form submissions, you could check that the form name parameters are always set.
Page view table
For the page view table, it’s important to bear in mind that the event timestamp is not the time of an event. In GA4 events can be sent in batches, so the event timestamp is actually the time of the batch. This means that you could potentially have a few events with the same timestamp.
To make the event ID unique you can set a custom event timestamp parameter or even an event ID.
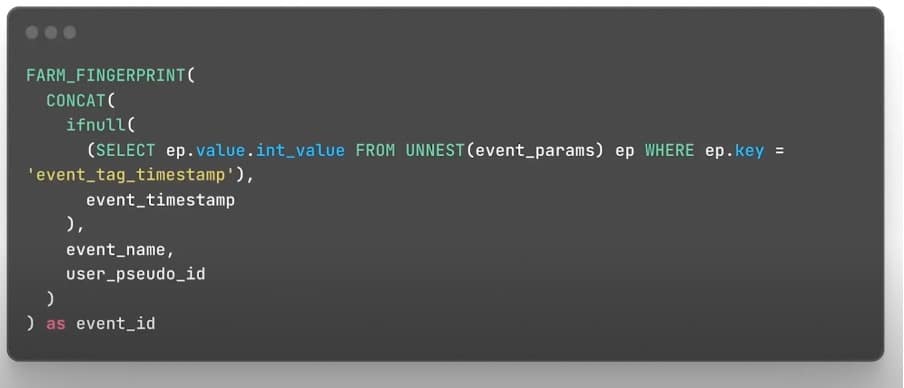
In the GTM community library, we already have timestamp variables. In the above example, we’ve assumed the past real timestamp in the event_tag_timestamp.
Landing page #2
Now that we have all events and session metrics, we can deal with tables for page reports. From here, we can collect the number of pages and purchases for each session.
A few small notes: Don’t join sessions and events by session ID and date. By doing so, a session could start one day and continue to the next day. The session start date could also be different.
Remember the average problem. If you know that late in the report that rows can be aggregated, don’t calculate the averages on the table. Instead, just include sums and counts. On the report side, you could, for example, use a weighted average.
Why not DBT?
People often ask – ‘why data form and not DBT?’ At the moment DBT has all the features that Dataform has and even more. But Dataform’s main advantage is that it’s a Google service that is natively integrated into BigQuery. Google rapidly develops the product and adds more features and integrations.
GA4, Google BigQuery, and all these products are from Google Stack. Our job is related to GCP data engineering. That’s why it is OK to spend time learning Google Data Stack and Dataform. It is safe to incorporate Dataform into the production as it is part of BigQuery and we already use BigQuery for GA4 data export.
Case Study – Telco
The task
A few months ago we started working with a new VOIP provider with functionality similar to Zoom. We handled the GA4 setup for the client, but couldn’t use the standard metrics as the client required company-level metrics.
For example, in Zoom one company account has many users. We needed to prioritize the accounts and provide account-level metrics that correlate with paid subscription intent. Data was merged into BigQuery with GA4 and based on historical data, we suggested KPI metrics.
The client initially asked for a minimally viable solution. They didn’t want to spend time and money on data architecture.
As soon they started to use new KPI metrics, they required more and more dashboards. Additionally, new metrics were added and existing metrics were edited. The client had an in-house team of data analysts who produced old reports and analyses.
But often, the KPI definitions were not in synch, due to using old calculations of KPI metrics. As the service was in rapid development, developers often added new features and functionality. Sometimes this led to data collection problems.
Additionally, data inputs from external sources often arrived after a delay, or even miss a few days altogether. All of this leads to a loss of data trust and an increase in the amount of time to check data quality.
The solution
We suggested the client switch to BigQuery Dataform. They agreed and the station was changed. We switched from event-based schedules to time-based.
These would trigger as soon as GA4 data was exported and external data sources were updated. This reduced the report delay from three days to 24 hours.
We edit separate processes for KPI metrics and all the references to these tables. We also reviewed all main changes before publishing them to the main branch. Additionally, we enabled data validation and notifications for the data delay.
Finally, we also reduced the cost of GA4 integration, because we only queried the raw data once per input. We then stored all needed events in prepared data tables. All reports got only the needed data from these small tables, instead of a huge raw data table.
Conclusion
BigQuery Dataform and GA4 make a powerful combination. As we’ve discussed today, the platform can transform your data reporting capabilities. If this is the first time your hearing about it, why invest some time in getting to grips with Dataform? As we’ve hopefully demonstrated, the rewards will far outweigh any effort.
Check out Artem’s highly technical and excellent digital analytics blog for more great data content.
- Top 24 Google Analytics Chrome Extensions & Sheets Add-ons - 21/05/2026
- Best Consent Management Platforms (CMP) - 19/05/2026
- Google Signals and Consent Mode: What This GA4 Change Really Means - 23/04/2026