Process Mining Your Customer Journey Using GA4 & BigQuery

Gaining a complete picture isn’t always as simple as we might think. Process mining customer journey using GA4 & BigQuery can give a fuller picture. Let’s explore how.
This is a write-up of Naomi Smulders’ talk at GA4ward MK4. Here, you can find her slides. You can watch the webinar here:
Introducing web analyst Anna
Before we begin, we’d like to introduce you to Anna, a web analyst. This is a character you’re probably very familiar with. Anna works for an online furniture shop and spends her day trying to analyze customer behavior. Her main goal is to provide the best customer experience possible.
The ideal customer journey
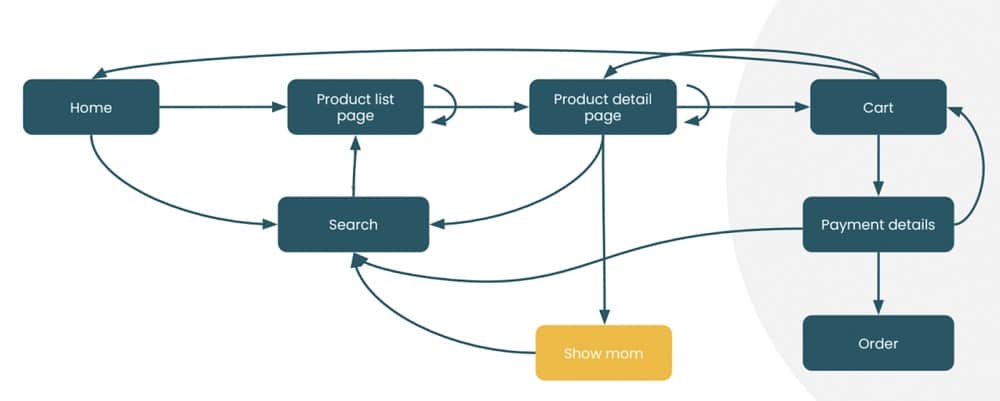
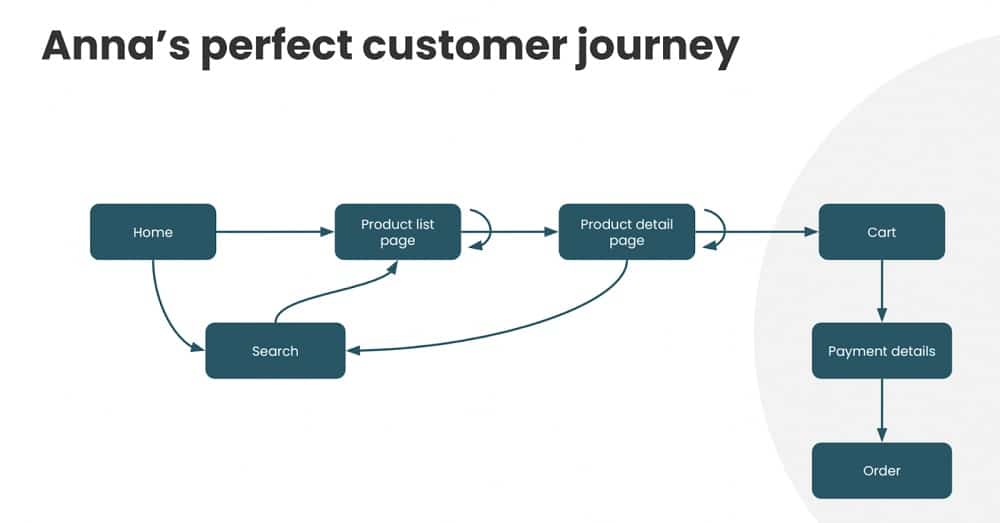
In Anna’s world, there is a perfect customer journey. Someone will enter the website on the home page, product list page, or product detail page. User Journey Visualisations are usually used to capture these stages, an example is shown below.
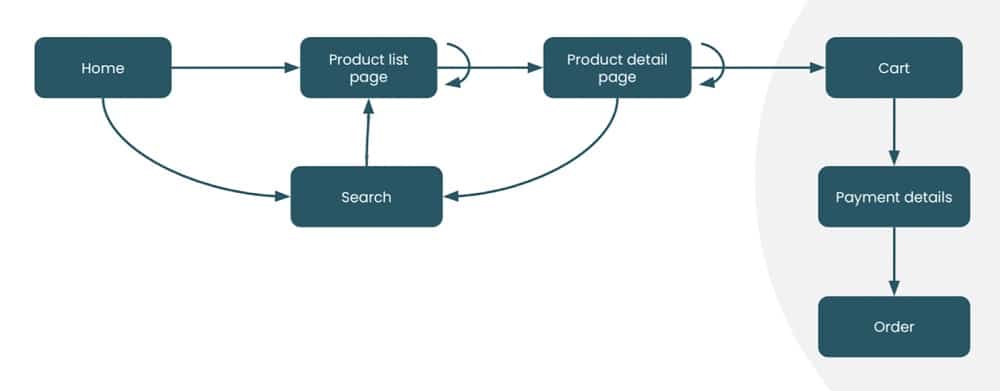
The customer will then carry out a series of steps trying to find a product on the list. They’ll look at the product details and decide that they like the item, add it to their cart, and follow a checkout procedure.
In theory, this is what we like to see. People follow a logical process of deciding on an item and moving through the website, before finding and buying a product. We design our dashboards as a way to measure whether these steps are followed.
In reality, however, this isn’t really how customers behave. People might enter the website and go to the product list page, find a product, and add it to the cart. But after finding that the item is too expensive, they remove the item and go back.

They might then head to another detail page and forward the details to a friend or relative, asking for their thoughts. The process then repeats. Instead of following our linear path, the customer is all over the place. This doesn’t help Anna or any web analyst trying to make sense of their journey.
Anna might be using several sources of analytics such as web analytics, surveys, and A/B tests. Not only is she learning where the user is coming from and the conversion rates, but the feedback that customers are sending.
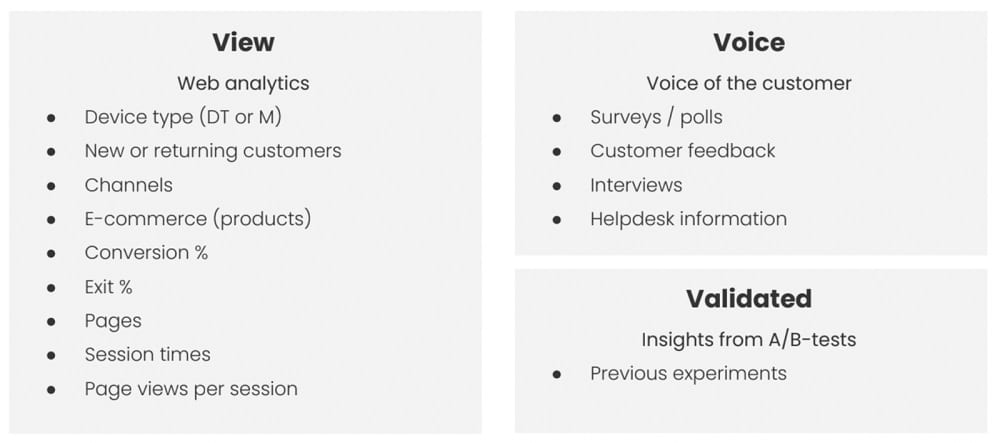
Anna has a very big source of data that gives information about the general pool of users on the website. There are also descriptives; they will tell you the average of thousands of users on your website. We go from a consumer journey to an average on a certain page.
GA4 paths & funnels
The use of GA4 is evolving, Google has realized this as well. Now, you don’t only look at averages but at funnels. You can create logical steps and see how many people are following the route. Rather than one statistic about a page, you can better understand the actual user journey. This helps to optimise your user journey.
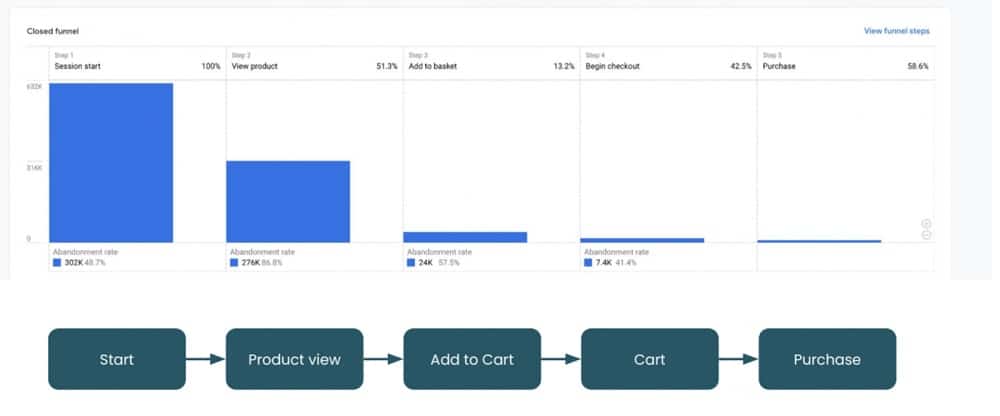
This function is one of the biggest improvements compared to Universal Analytics. It is, however, still about averages.
Similarly, we can look at paths. These are a lot easier to understand in GA4 than they were in UA. When looking at path analysis, however, we only see which pages were visited. We still don’t understand the order in which the interaction took place.
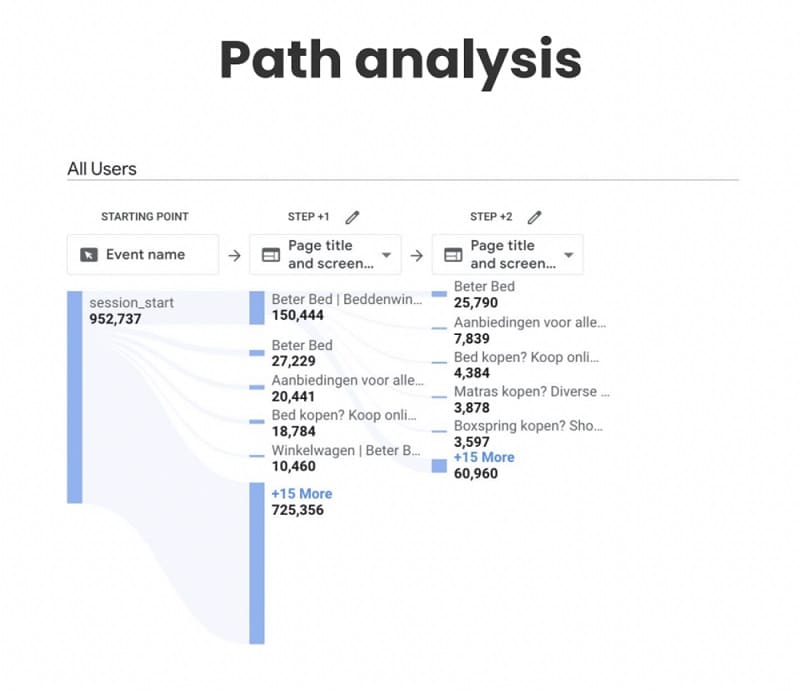
Did people skip steps, or did some actions take place between steps? We don’t know because we can’t follow a particular path.
The problem
Going back to the customer journey we explored earlier, Anna needs help. She can’t identify a specific journey from the averages. Anna needs advanced analysis to find out how to help her customers.
Introducing data scientist Nora
Nora is a colleague of Anna, and she spends her days analyzing customer journey paths (not just the averages and statistics like Anna’s). Her goal is to make complete customer journeys measurable. As a result, she recommends a new analysis process. This consists of three steps:
- Query raw GA4 data from BigQuery
- Clean and convert raw data into event logs
- Process mining customer journey on the event log data to discover commonalities in customer journeys
Let’s look at each of these steps in more detail.
1. Query raw data from BigQuery
Why do we use BigQuery with GA4 rather than staying in the GA4 interface?
GA4 data is explored in data warehouses like BigQuery or Snowplow. This is then queried by tools like LookerStudio. Looking at this raw data brings a number of benefits. The data is customizable; you can choose to only look at aspects of data that you need to know.
Additionally, there is no aggregation. In GA4 you can only gain insights that someone at Google thought might be interesting. If, on the other hand, you’re querying raw data, you can look at everything you want. You have full control to figure out what is important to you.
Whilst all this sounds great, more flexibility also means that implementation will be more difficult. Whereas GA4 is a plug-and-play solution, you need to know exactly what you’re tracking to ensure you have the raw data you need.
This involves a very steep learning curve. Analytics interfaces are great at clicking and combining information. To leverage your raw data and BigQuery you will need to learn some SQL and get familiar with how a database operates.
On the bright side, you’ll be rewarded with more valuable information and better analysis.
Nora’s Solution
So, let’s go back to step one of Nora’s solution: Querying the raw data from BigQuery.
Nora’s instructions:
- Set up the GA4 & BigQuery integration
- Know your data model > Hit based!
- Get comfortable with SQL
Lots of people are already making use of the GA4 integration with BigQuery. Going down this route, it’s important to know that the GA4 model is hit-based. This means that a new entry is created for every event that occurs.
Luckily, this model is much easier to leverage than the session-based model of UA. Taking time to understand this model is essential for getting to grips with SQL.
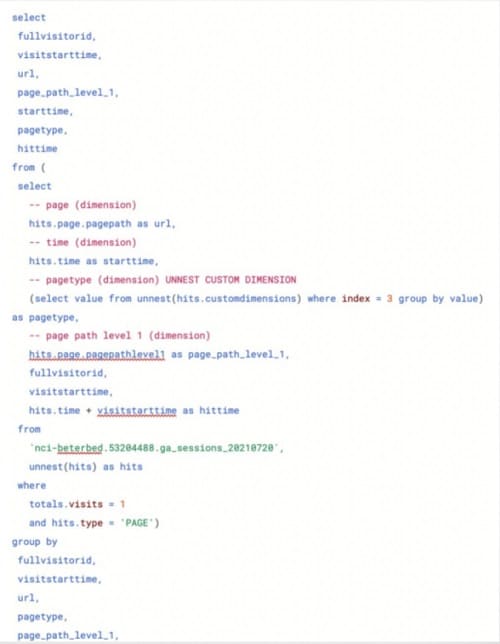
After getting comfortable with SQL, you can write a query (seen below) to get the right event logs to enable your process mining.
2. Clean and convert to event logs
To carry out a process mining approach, you first need an event log.
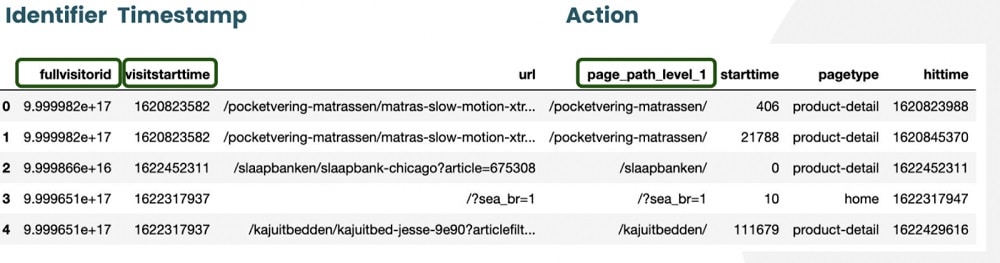
There are some essential elements to having an event log. You need an identifier (a persona ID, GA ID, or Cookie ID), a timestamp to know when an event happened, and the action itself. Luckily, GA4 is already in this format.
Take a look at the image below, which shows processed data from GA4. We can see that we have a visitor ID, a timestamp, and an action. All the elements of an eventlog are here for us. GA4 is priming you to do analysis in the form of process mining.
Cleaning is an iterative process and can be quite time-consuming. It’s important to choose your granularity. You can look at every step of a path or focus on the more common points (product detail page, a certain category page, or specific URLs).
The more familiar you become with your data, the easier it will be to choose a granularity for your research.
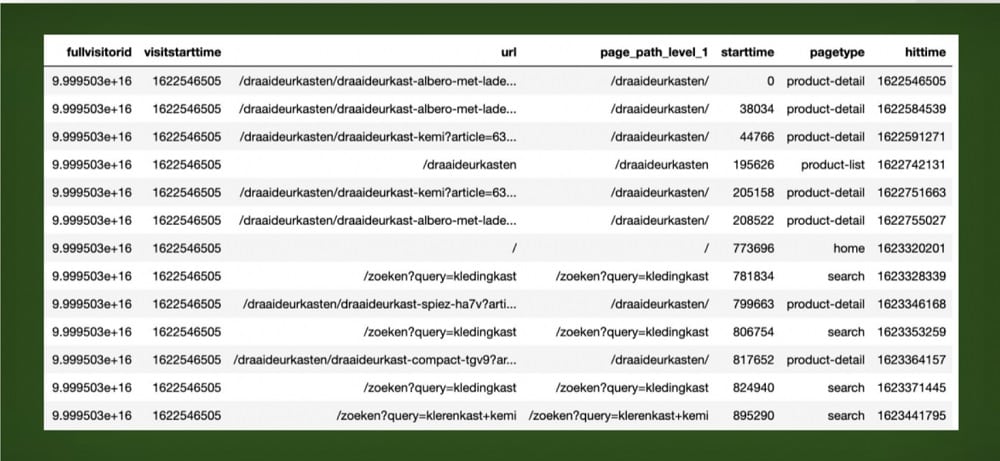
If you create an event log for a single customer journey, you get a result similar to the image below. Here, the full visitor ID is the same ID, showing that these events all relate to one user. The start time is consistently the same, but the hit time is in ascending order.
All these hits are a sequence from the first user interaction to the last. In this instance, we looked at the granularity of page_path_level.
We can see from the page path that the user looked at the product details for a ‘draaideurkasten’, a certain type of closet. They then returned to the home page and entered a search query, before finally looking at another product.
With your GA4 data, you can create event logs for every customer that you have. Of course, if you have a big website with lots of users, you’ll end up with lots of event logs. After all, every customer has a journey that is unique to them.
3. Process mining customer journey on the event log data to discover commonalities in customer journeys
The goal, when you have logs of so many customer journeys, is to find commonalities. To do that, you’ll need to put your event logs into your process mining tool.
Luckily, you don’t have to program this yourself. There are a number of process mining tools that can do the task for you. You enter the event log and the process mining tool will try to find the commonalities in the paths.
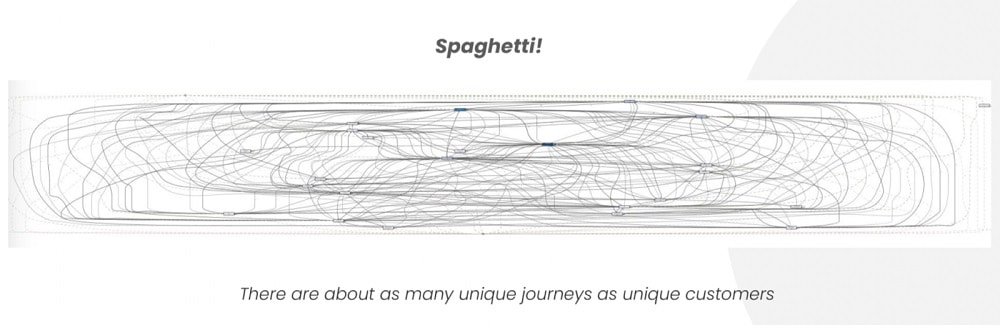
Unfortunately, you may end up with a similar result to the image below: spaghetti. Trying to make sense of all these different lines is impossible. We need to narrow our results down.
Introducing psychologist Jake
Jake is a psychologist who also works with Anna. Jake spends his days interpreting online customer behavior. In other words, his job is to make sense of the spaghetti. His goals are to figure out the wants and needs of the customer and help Anna with her analysis.
Anna asks Jake to provide some context and narrow down her results.
Jake’s recommendation: segment customers
Rather than looking at one group of customers in a very big pile, try to make some easygoing segments. For this particular story, the literature suggested that customer exploratory behavior is different for expensive vs. cheaper goods.
As Anna works for an online furniture shop, customers will be looking at different types of products. This ranges from beds to candlestick holders.
These products can be segmented based on the psychological principle. For example, buyers of more expensive goods spend more time on the page. They look at more pages and take longer to order.
Segmenting based on buyers of expensive vs cheaper products worked.
The image below shows customers who bought or are looking at expensive products- items priced at above €1,000. Rather than looking at thousands of lines, we can see more common themes appearing.
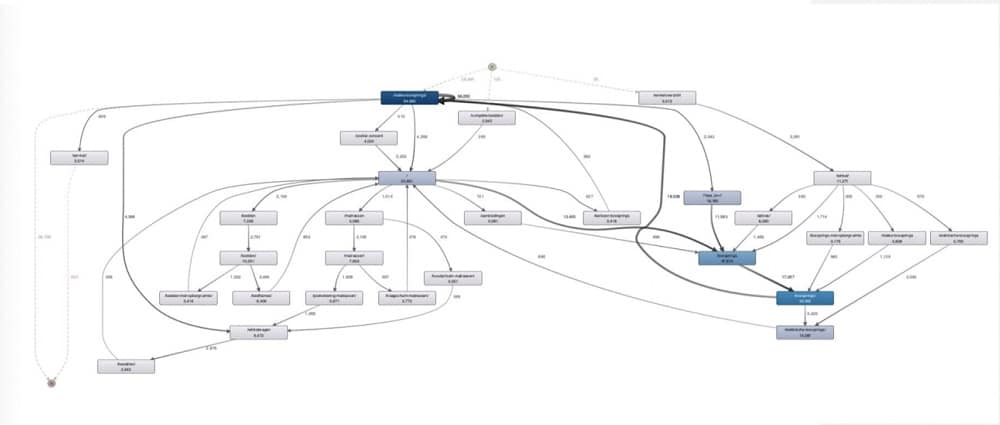
The boxes in the image represent URLs, and the gray lines show how customers go from one page to the next. The thicker the line, the more people followed the steps.
Essentially this is a more exploratory version of path analysis in GA4. Instead of having a linear process, however, we can see that people are moving in an organic way. We can map out these interactions. Not only are we moving throughout the checkout, but we can also see clickbacks and sidesteps.
We can look at other aspects of the journey and figure out what’s happening.
The new customer journey
Let’s go back to Anna’s perfect customer journey. We like to imagine that the customer’s journey on our website is very linear. But by process mining customer journey, we found out that there are more steps that we haven’t captured.
Actually, there is a slightly different customer journey, especially for customers buying expensive products. They enter the website, go to the product list page, and eventually go to the advice page or store locator.
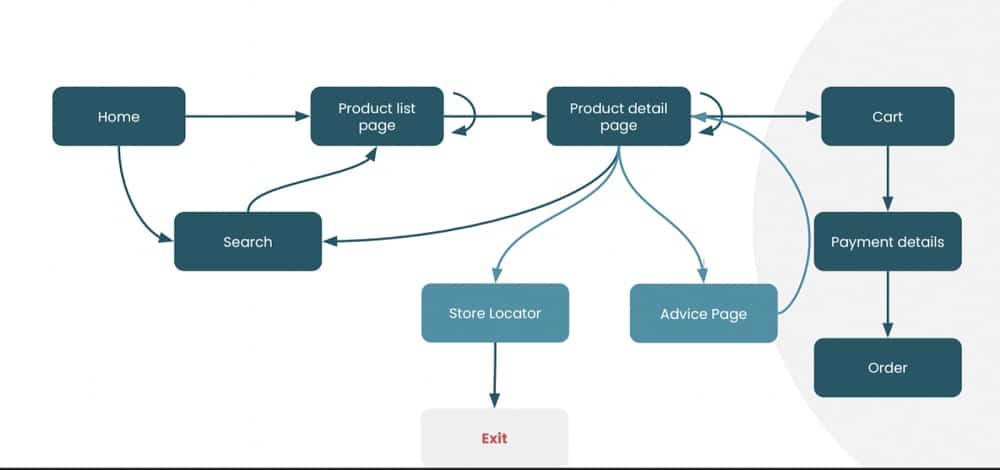
This is a part of the website that we didn’t look at. It isn’t in any of our funnels and doesn’t pop up frequently in our paths. It’s only visited by customers that buy expensive products.
By segmenting and looking at the needs of users, we can see there’s an area of the website we haven’t paid much attention to. There’s a missing step in the customer journey. Customers are going to the product details page and not getting enough information.
Validating the new customer journey
How can Anna validate her insights and make sure they align with customer needs? She introduces an advice tool on the product pages, to help the customer get the information they need. This improves customer experiences & conversion rates.
Using A/B testing, she sees customer behavior changes on the new page. In the A variant, we can see the standard page. In image B, an advice panel has been added.
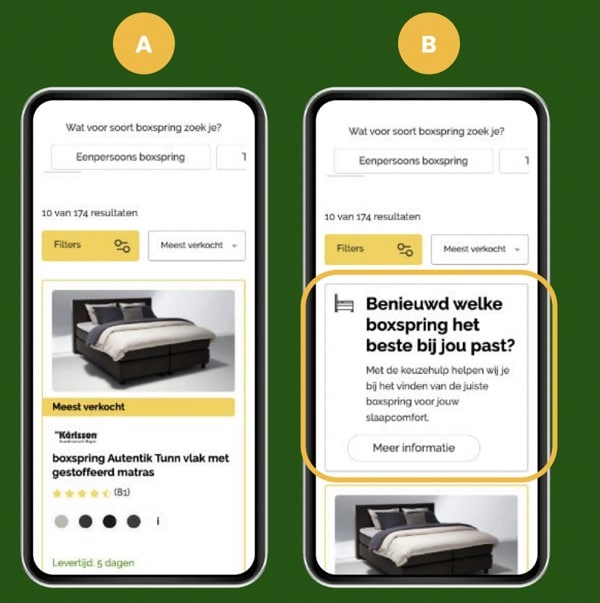
The new variation worked greatly, seeing a 5.2% uplift in conversion rates. There was also a 111% uplift in click-through rate to advice pages.
Key takeaways
To wrap up, let’s recap some of the key points in this article.
- Working with raw data has enormous potential. We can look at so many more aspects of data than on the GA4 interface. Making the most of GA4 integrations with tools like BigQuery is essential.
- Process mining customer journey will help you to locate blind spots, and improve overall user experiences.
- Psychology helps to untangle the spaghetti of user journeys. Working with raw data, things can get tricky. You need guidance and extra context to understand user behavior.
- The insights generated are new foundations for experimentation programs.
About Naomi Smulders
Naomi is a Data Scientist who has a background in Psychology (BSc) and Cognitive Neuroscience (RMSc) and an Engineering Doctorate (EngD) in Data Science. She has a keen interest in analysing large quantities of data to gain insights into human behaviour. This is perfect for her current job where she gets to design new data science products in an interdisciplinary team of psychologists, designers, and developers.

- Top 24 Google Analytics Chrome Extensions & Sheets Add-ons - 21/05/2026
- Best Consent Management Platforms (CMP) - 19/05/2026
- Google Signals and Consent Mode: What This GA4 Change Really Means - 23/04/2026