How to Optimize Your Google Analytics User Journey

Can you guess the number one question measurement marketers are asked? If you haven’t guessed it already, the answer is ‘what is working and what isn’t working?’. But why is this question so hard to answer? Put simply, businesses don’t have a marketing measurement framework to guide them.
But what is a measurement marketing framework, and how can it optimize users’ journies in Google Analytics 4? Let’s find out!
This is a write-up of the talk that Julie Brade gave at GA4ward. You can find her slides here and a link to the recording here.
The Three Steps of a Measurement Marketing Framework
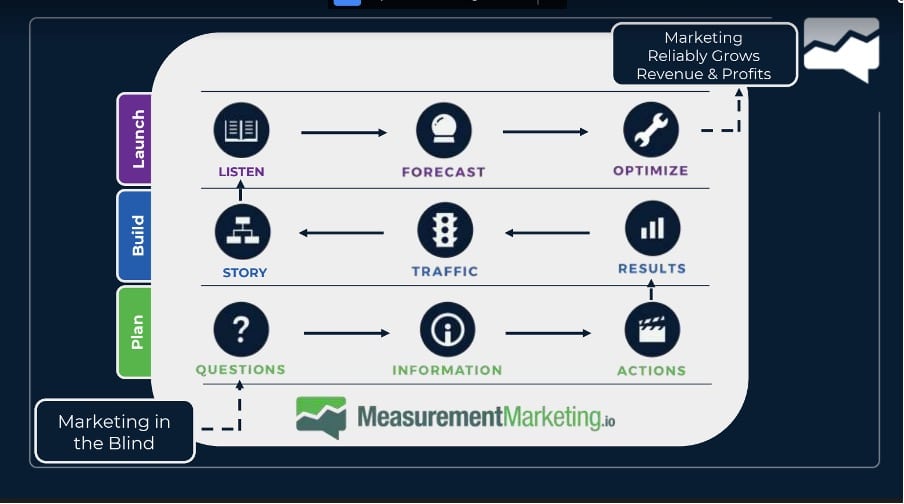
Every measurement marketing framework is made up of three steps: plan, build, and launch. The aim is to go from a position of marketing in the blind to a position of reliably growing profits. To do so, we need to travel through each step in the framework.
Each stage can be broken into three parts:
The planning stage:
- Questions – Which queries are needed to answer the questions that you have?
- Information – What information do you need to answer your queries?
- Actions – What actions can you take from the information that you have learned?
The build stage:
- Results – Have a clear understanding of your results.
- Traffic – Know the traffic that is causing these results.
- Story – How can you extrapolate these results into a wider story?
The launch stage:
- Listen – Understand what the story is telling you.
- Forecast – Use these insights to forecast future patterns.
- Optimize – Your story will also help you to optimize the GA4 user journey.
A.C.E.
You’ll use this framework again and again in your marketing strategies. For now, we’re going to focus on the ‘results’ step in the build stage. This means focusing on a concept called A.C.E. Let’s break this down.
- How many users are AWARE of the journey?
- How many users COMPLETED the journey?
- How many users ENGAGED along the way?
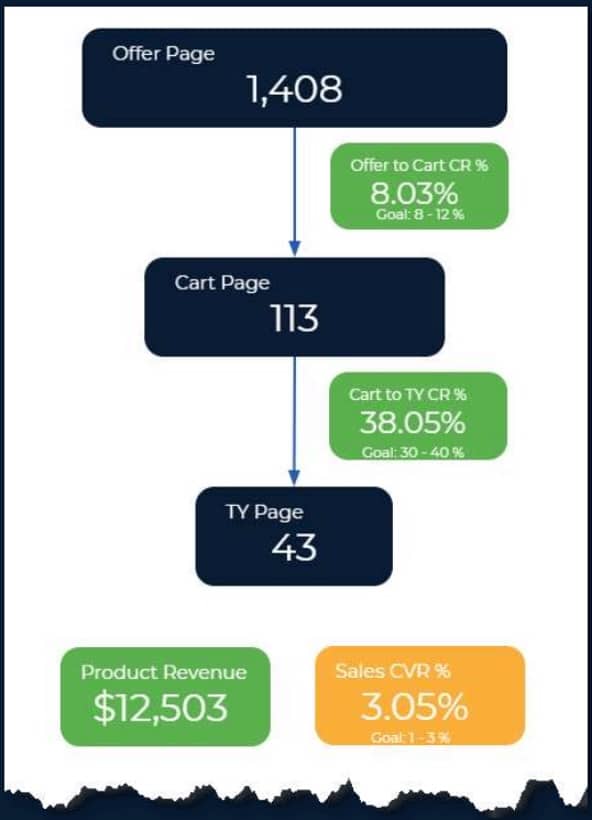
Let’s apply the A.C.E. concept to the graphic above.
- In the ‘Offer Page’ section, we can see the number of users that were aware of the journey. A customer has seen the offer page.
- We can see in the ‘TY Page’ section that 43 users completed that journey and made a purchase.
- In the middle ‘cart page’ section, we see that 113 users engaged along the way. In other words, they did something between the first and final steps.
We’ve gained all this information without using Google Tag Manager. You can use the A.C.E. method to see where users are visiting in their journey. Or, perhaps where everything is working, but traffic needs to increase.
Using A.C.E. In Google Analytics 4
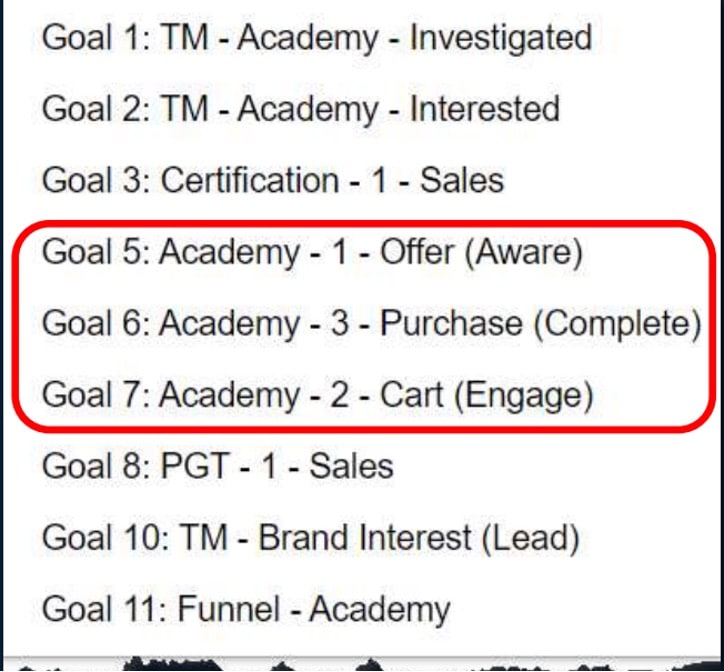
The image above shows how things would have looked in universal analytics, the older version of GA. You could look at your traffic sources and landing pages and see whether they were meeting your goals.
With Google Analytics 4, things have changed. Google has done away with goals and we now have a new metric called ‘conversions’. As you’ll notice from the image above, the A.C.E. method still applies. Products are grouped together (in this instance the product is called an academy).
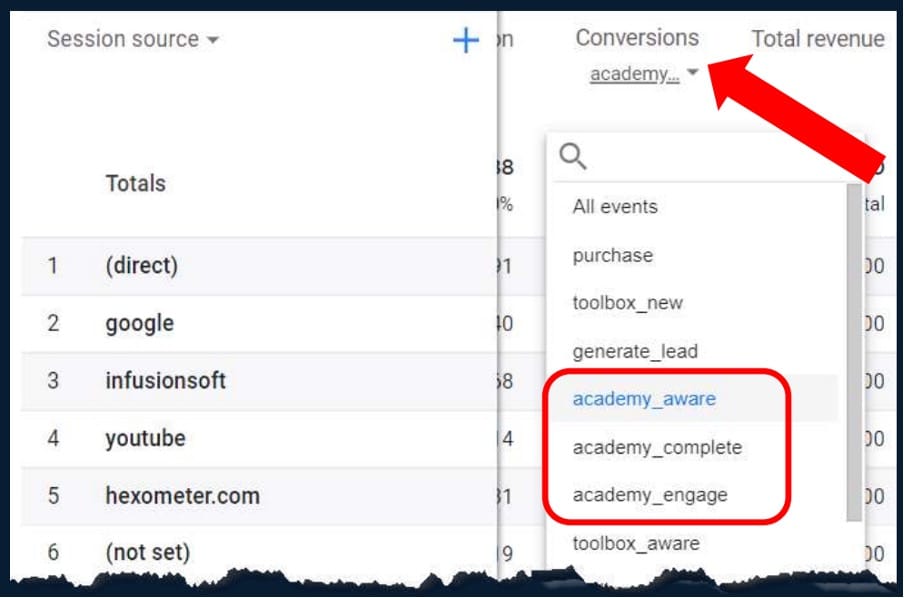
In GA4, we can again look at traffic sources and choose the option that we’re looking for. Going back to our original questions ‘what’s working?’ and ‘what isn’t?’, we can find the answers within GA4. For example, we can filter by traffic sources that are driving user awareness.
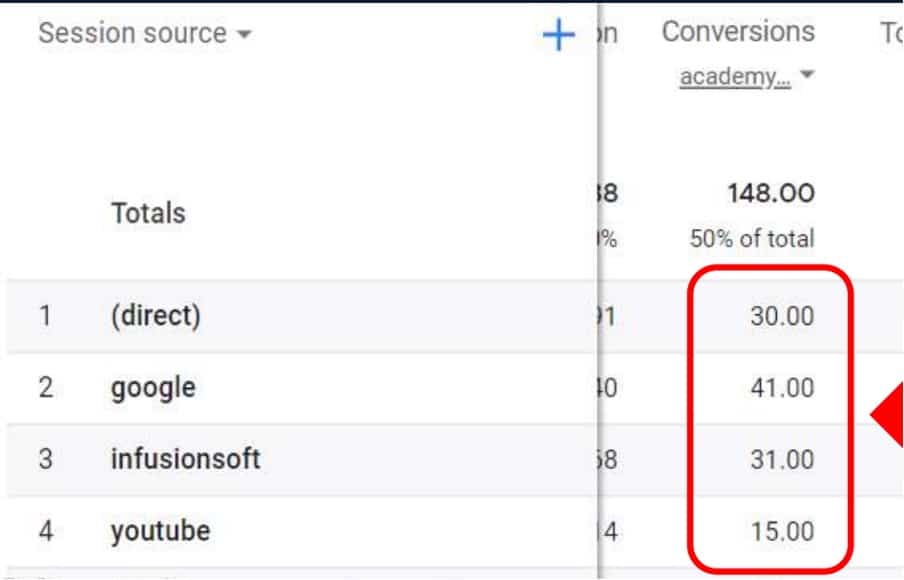
As you can see, we are able to view the number of conversions associated with different traffic sources. You can quickly see what is working and what isn’t.
Let’s Dive in…
Step 1
We can head over to Google Analytics 4 now. From your dashboard choose ‘Admin’ and then ‘Events’. From here you’ll see a list of all the events on your website. Some will have been created by you, others will be default settings within GA4.
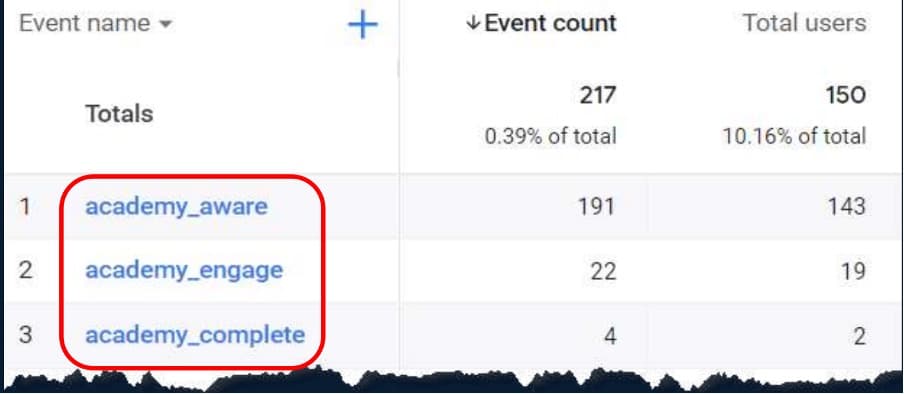
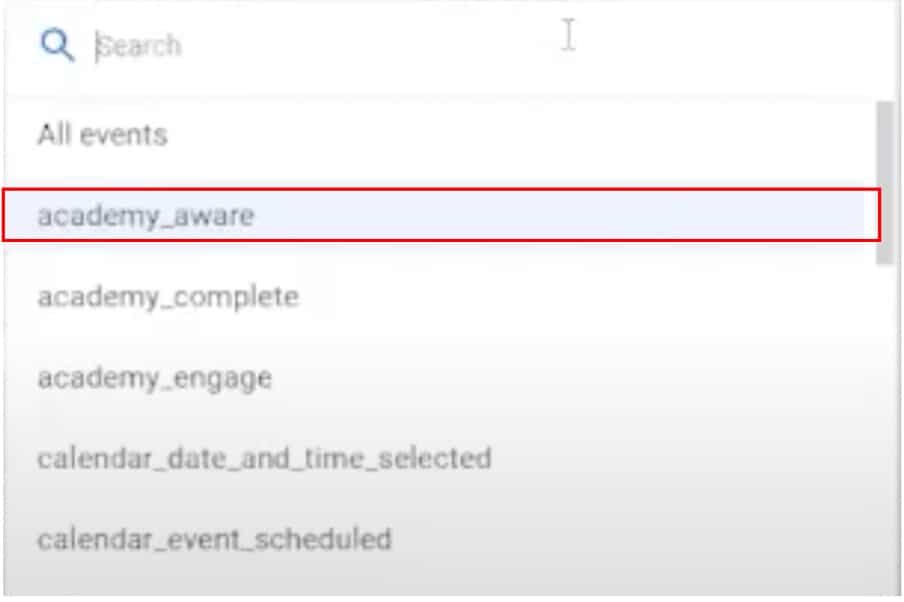
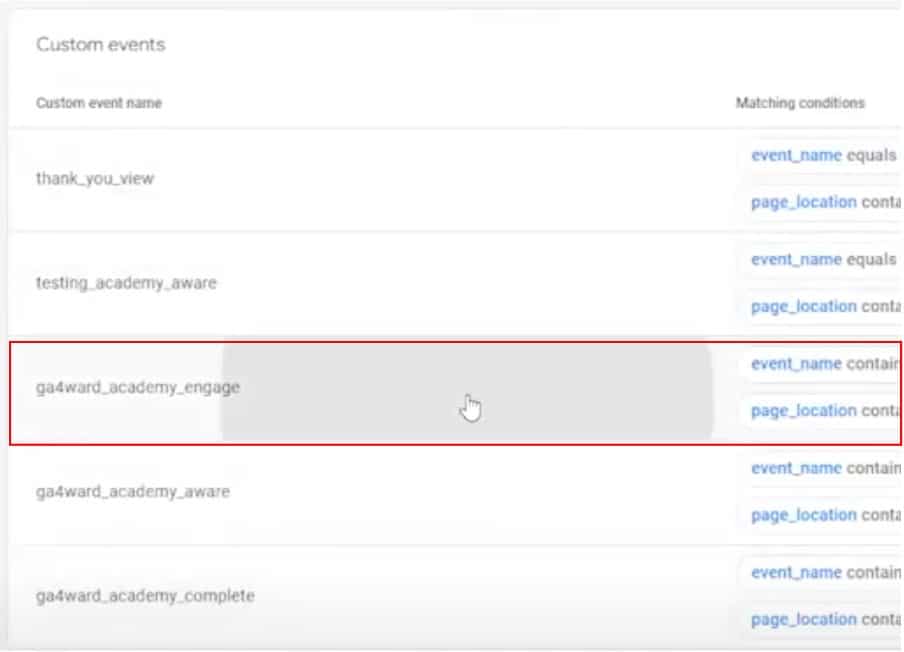
Step 2
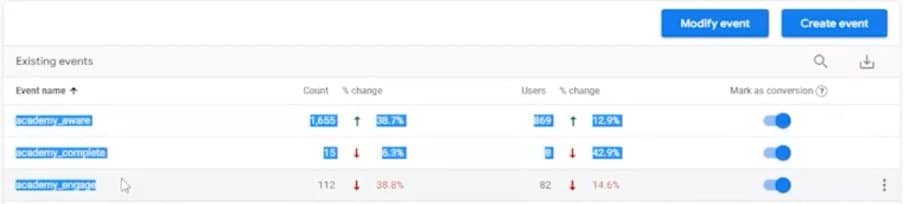
We’re going to focus on three events shown in the image above. These are ‘acadamy_aware’, ‘acadamy_complete’, and ‘academy_engage’. But how do we create these events?
Step 3
To begin we need to choose ‘Create event’ from the top right of our screens and choose your data stream.
Step 4

You’ll be shown a list of all the custom events you’ve created. Right now this box is probably empty. Let’s choose ‘Create’ from the top right of the screen.
Step 5
You’ll be taken to the event configuration screen. We’re going to focus on the options in the middle of your screen, shown under ‘Matching Conditions’.
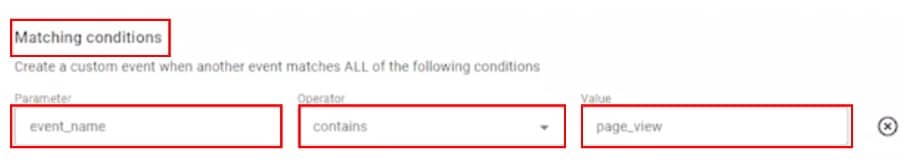
The first option shown under the parameter will already say ‘event_name’. We’re going to leave this in the same setting.
For the second option, ‘Operator’ we’ll choose ‘contains’.
Finally, in the third box labelled ‘Value’, you should input ‘page_view’.
![]()
![]()
Now we need to choose ‘Add condition’, and a new set of empty boxes will appear matching those above the button.
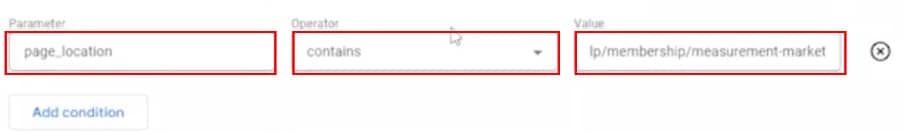
This time, under ‘parameter’, we’ll choose ‘page_location’ from the drop-down menu.
Under ‘operator’ we’ll select ‘contains’.
For ‘Value’, we need to head over to your website and select a portion of our URL that we want to use. We’ll paste this into our value box.
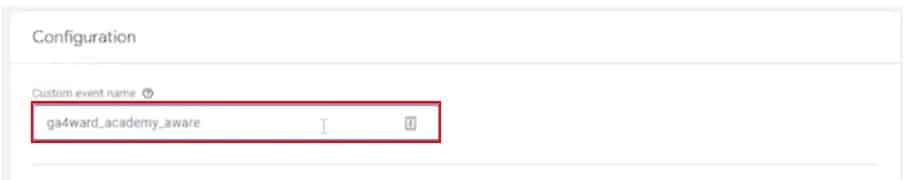
Finally, we need to enter a name for our event. Enter ‘acadamy_aware’.
We’ve given an instruction to GA. When there’s an event_name that contains page_view, look for the parameter ‘event_name’. This should contain our website’s URL.
When you’re happy that all elements have been entered correctly, choose to create. The event will now appear in your custom events list.
Step 6
The good news is that we can now copy the event we just created. We won’t need to input each individual field again. After copying your event, you should rename it to ‘acadamy_engage’.
Again head over to your website. Choose a point of engagement such as a form, and copy the URL. We’ll paste this into the final value box. We again hit create.
After only a matter of minutes, we already have two events created. We’ve covered two parts of the A.C.E. method ‘aware’ and engage’. Now for the final step ‘complete’.
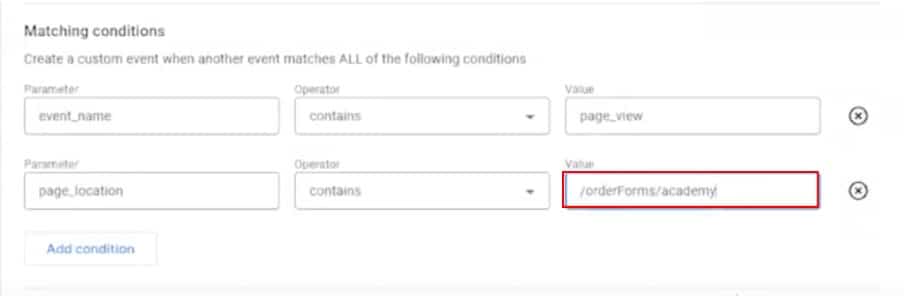
Step 7
Again, we’re going to copy the event that we’ve created. This time the event will be called ‘academy_complete’. In the value box, we’ll input ‘ty/academy’.
And there we have it, the full A.C.E. method has been set up for a funnel. By paying attention to the data you gain from this method, you can optimize your user journey.
You didn’t even need Google Tag Manager (GTM) to answer the questions ‘what’s working?’ and ‘what isn’t?’ (of course, you will be able to answer more questions by levelling up your measurements to use Tag Manager).
Using the A.C.E. Method
You’ve now successfully set up events for the A.C.E. method. But how do you use these events to answer the questions ‘what’s working?’ and ‘what isn’t?’.
Traffic Acquisition
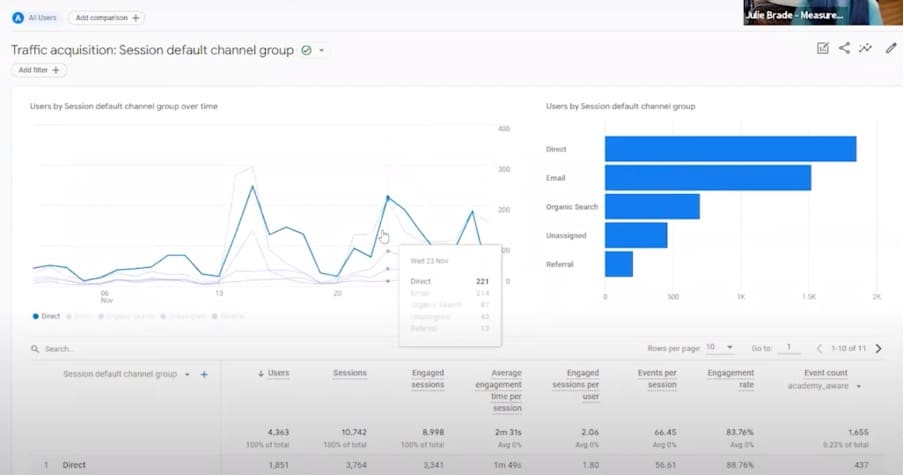
From GA4, head to ‘Life cycle’, ‘Acquisition’, and ‘Traffic Acquisition’. Your screen should now look similar to the image shown above.
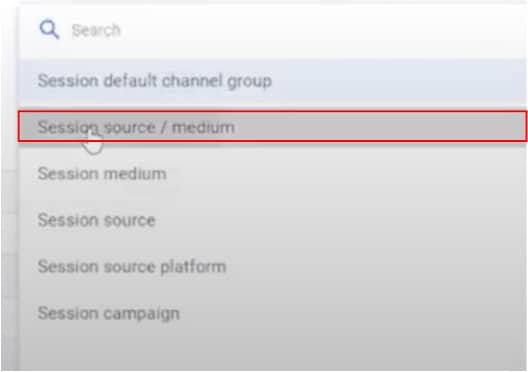
From the middle left of your screen, you’ll notice a heading labelled ‘Session default channel group’. Select this and choose ‘Session source/medium’ from the dropdown menu. This will help you learn whether users are taking specific actions during sessions.
Next, we’re going to choose ‘Event count’ from the right of our screen. This lets us choose a specific event for our data. From here can choose any of our recently created events. We’re able to quickly find information relating to this event within GA4.
If we want things to look a little smarter, we have the option of using a tool such as Looker Studio with GA4. This provides a quick way of gaining an understanding of what is happening on our user journey.
For example, we might find that YouTube is great for driving awareness but has low completion levels. When we find a source that isn’t performing as it should be, we can guide our marketing team to make adjustments.
Pages and Screens
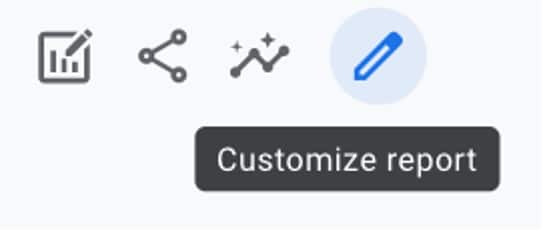
Let’s move on to another section in Google Analytics 4. We’ll again go to ‘Life cycle’, and this time choose ‘Engagement’ and ‘Pages and screens’. Unfortunately, the default options aren’t the best. Thankfully, we have the option of customizing our report. We can do this by choosing the pencil icon at the top right of our screen.
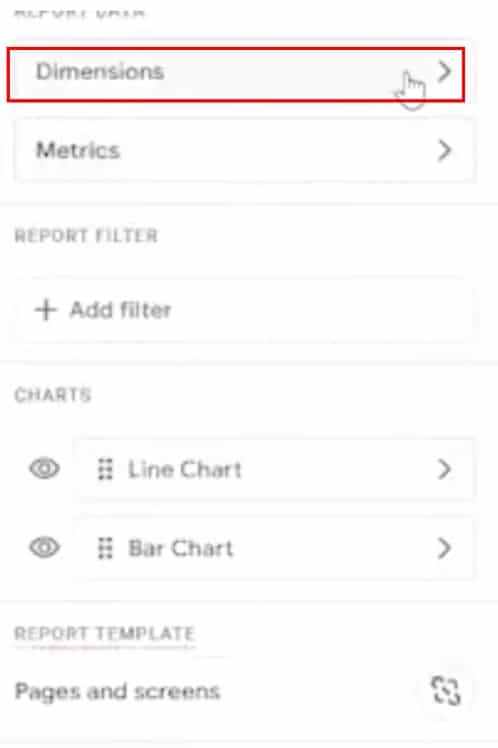
We’ll now choose the ‘Dimensions’ option.
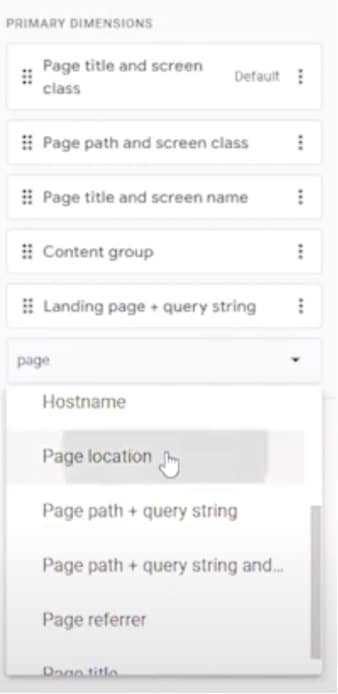
From here, we have the option of adding our own dimension. We have many different options but we’re going to choose page location. We should now choose ‘apply’.
We’re now going to save our new report. For this we have two options, saving changes to our current report, or saving a new report. If we save the current report it will be changed for every account that has access to it. It’s recommended that you save this as a new report if this isn’t your personal account.
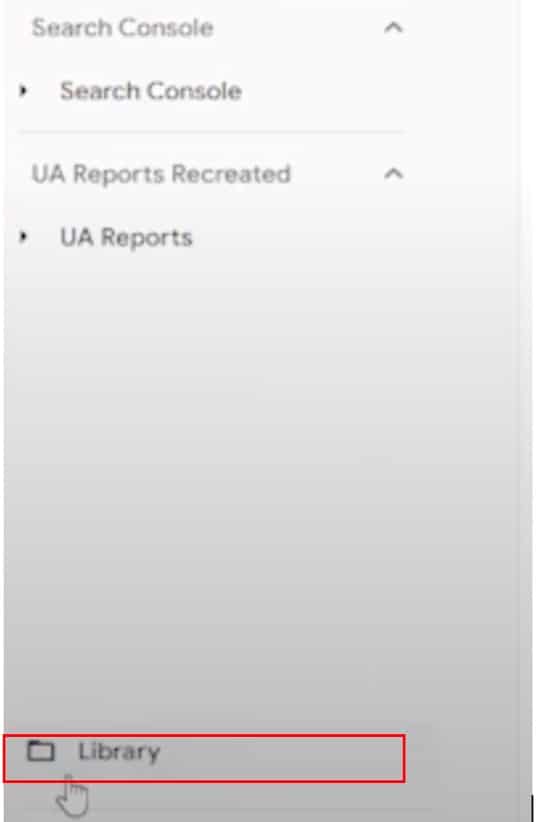
If you’ve chosen this option, you might be wondering where your report has been saved to. To find it, you will need to choose ‘library’ at the bottom of your screen.
When you head to the library page, you’ll see your report alongside others that have been saved.
Collections
From the library screen, we also have the option here of creating new collections. These allow teams to get the data they need without altering a client’s default view. For example, we recreated the universal analytics reports and created a collection of these reports.
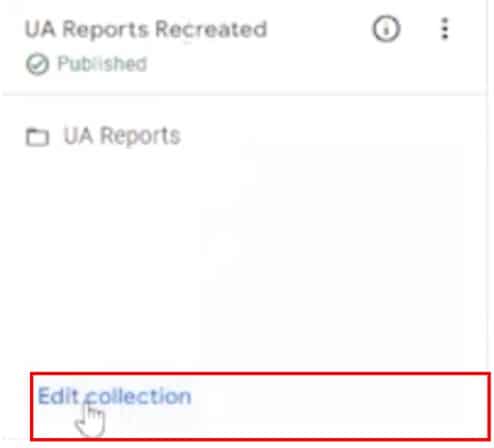
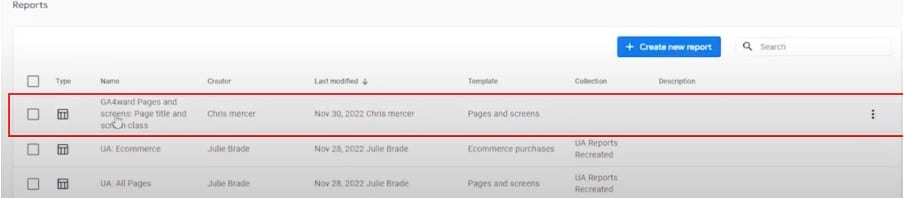
As you can see, we have the option of editing our collection. Let’s do that.
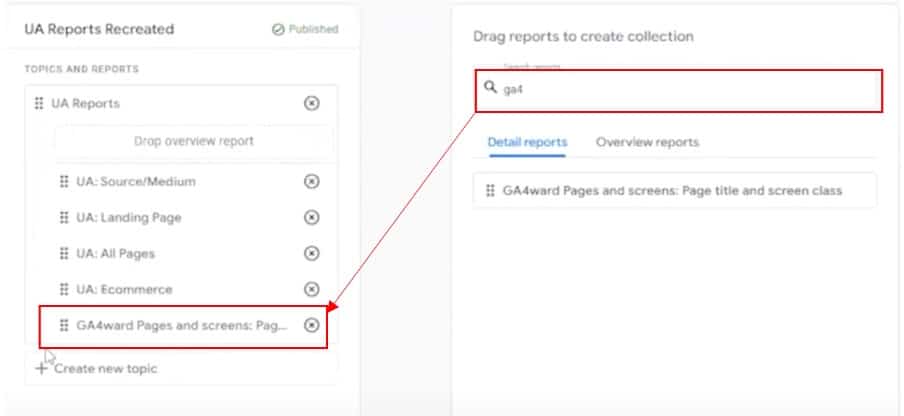
We can search from the reports that we’ve already created, and add them to our collection. In the image above, we’ve searched for our GA4award report and dragged it into the collection.
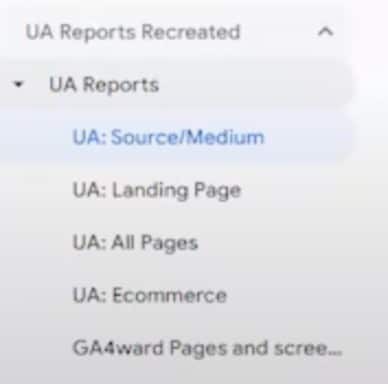
We now have easy access to our UA reports. We can get to our answers faster than ever before. This means you will be able to better optimize your user journey.
Conversions
Once we’ve configured our events we’ll start to see them coming through with traffic. Now we need to set them as a conversion. Why? Tools like GA4 and Google Ads give you access to new features. You’ll be able to utilize algorithms, gain access to special reports, and more.
To mark an event as a conversion, head to ‘Conversions’ and click the switch labelled ‘Mark as a conversion’.
But what if there’s a scenario where you’re unable to mark an event as a conversion? For example, let’s say that you have a launch at midnight and you don’t feel like staying up.

All you need to do is head back to the ‘create event’ option from the ‘Events’ page. Then, choose your data stream.
From your list of custom events, choose the previously created event ‘academy_engage’ (although this process works with any event).

Now, copy the name of the event. Back out, and return the conversions page.
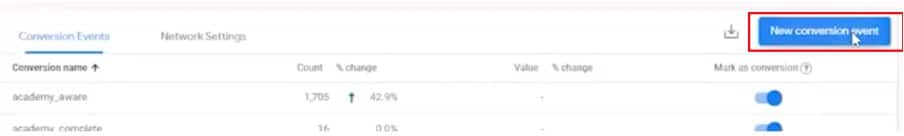
Choose the option to create a ‘New conversion event’.

Paste the event name into the following page (as shown above). Why are we using this method? GA4 is extremely case-sensitive. Any mistakes made during name entry will mean that your conversion won’t work. Once your name is copied, you can choose ‘Save’.
Your conversion is now set up. The good news is that you won’t have to stay up until midnight to mark your event as a conversion.
This simple process allows you to utilize the different reports of Google Analytics 4 and GoogleAds algorithms without even having to wait for traffic. A phenomenally easier process than what we had to deal with in Universal Analytics.
Utilizing A.C.E. Results In Explorations
By heading to your ‘Explorations’ page you can start to make use of your A.C.E. results.
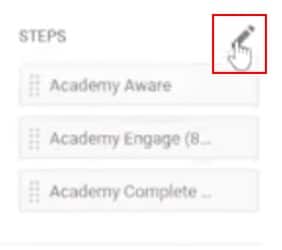
We’ll need to begin by configuring the different steps in the A.C.E. method. To do so, head over to the ‘Steps’ option on the left of your screen and click the pencil.
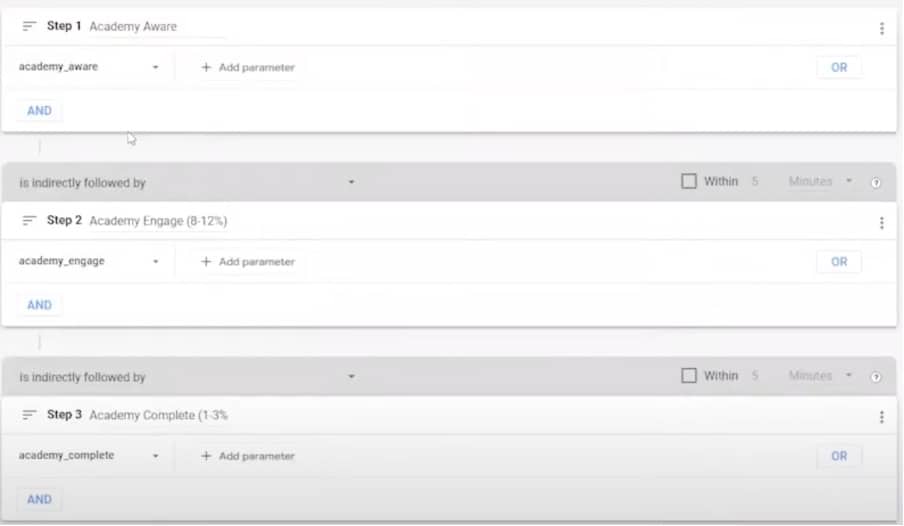
For step one choose ‘acadamy_aware’, for step two ‘acadamy_engage’, and for step three ‘acadamy_complete’. And, as simple as that, you’ve set up a funnel for the A.C.E. method.
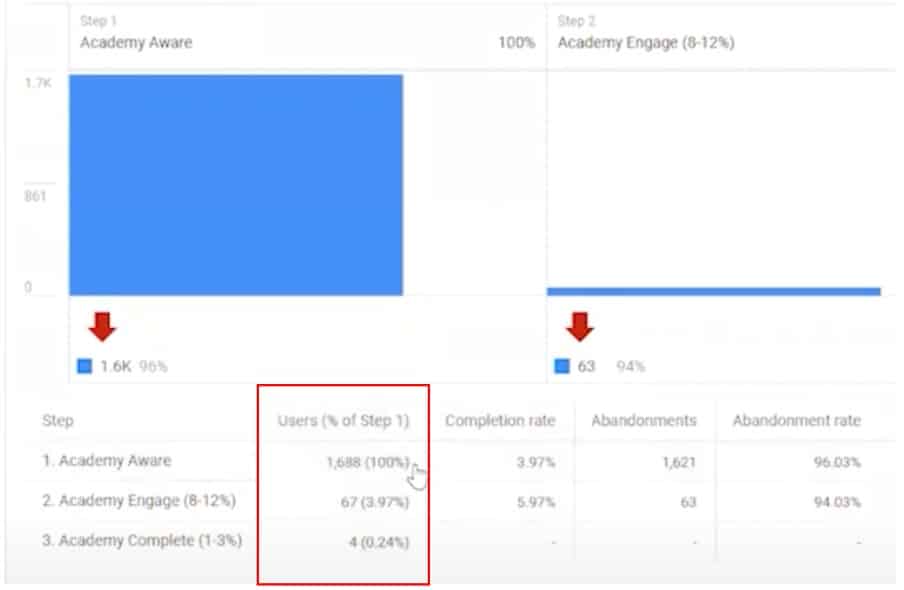
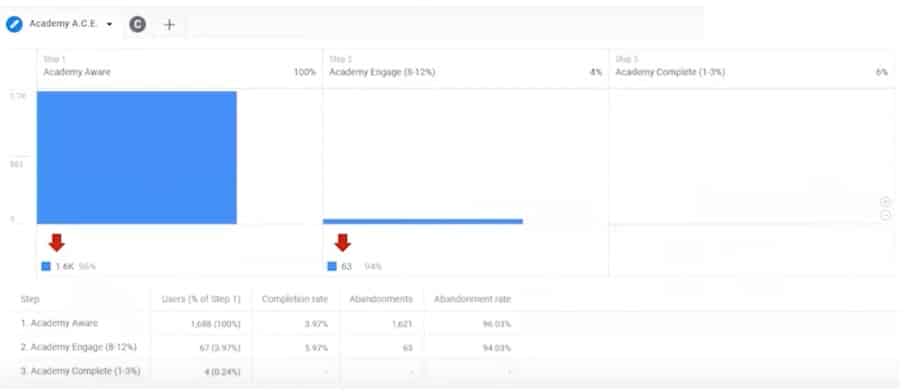
Looking at our funnel, we can very quickly see what’s going on. In step 1 we attracted 1,688 users. But only 67 users (3.97%) progressed to step 2. By the final step, the number of retained users has fallen further still to just 4.
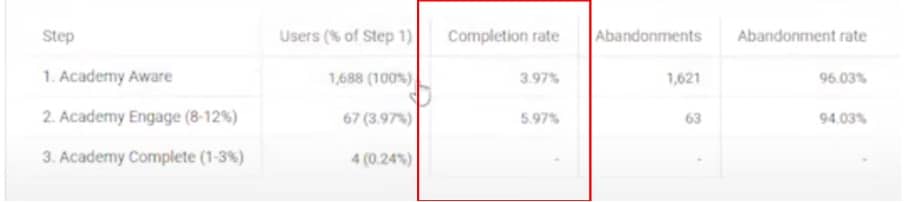
The ‘Completion rate’ panel, shows us the percentage of users that completed each stage. In the first stage, 3.97% of users went onto the second stage. Of that group, 5.97% then went onto the final stage. This means that only 0.24% of users from stage one progressed to the final stage.
Both measures are useful as it’s important to know how many people drop out at each stage. It’s also vital to know the percentage of users that reach the final stage.
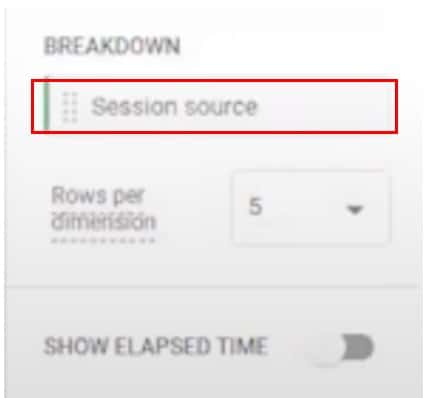
The third option is to break the session down by source. To do this, we need to choose ‘Session source’ from the breakdown section of ‘Tab settings’.
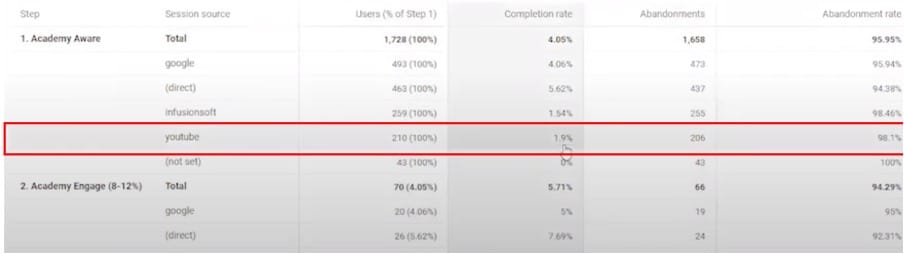
Here again, we can answer the questions ‘what’s working and ‘what’s not. Looking at YouTube, we can see that the completion rate is only 1.9%. This is only half of the success rate of other traffic sources. We can go to the marketing team with this information and help them adjust their messages.
What About Tag Manager?
This is a simple and quick method for users that aren’t familiar with GTM. As mentioned earlier, GTM can provide further useful information to optimize your user journey. It’s recommended that you move on to GTM eventually.
But how do things differ when using tag manager? Without going into too much detail, here’s why the process in GTM is extremely simple.
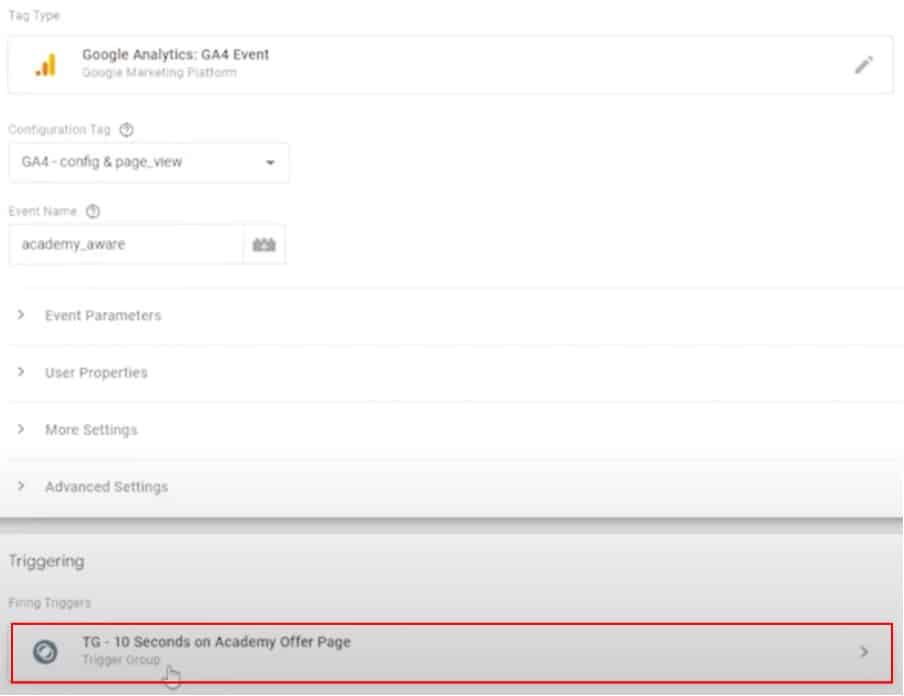
Above, you can see our acadamy_aware event within GTM. You’ll notice that our trigger is slightly different from a standard page view. We want to learn whether a user is on the page for 10 seconds or more. This excludes bounces and users logging in.
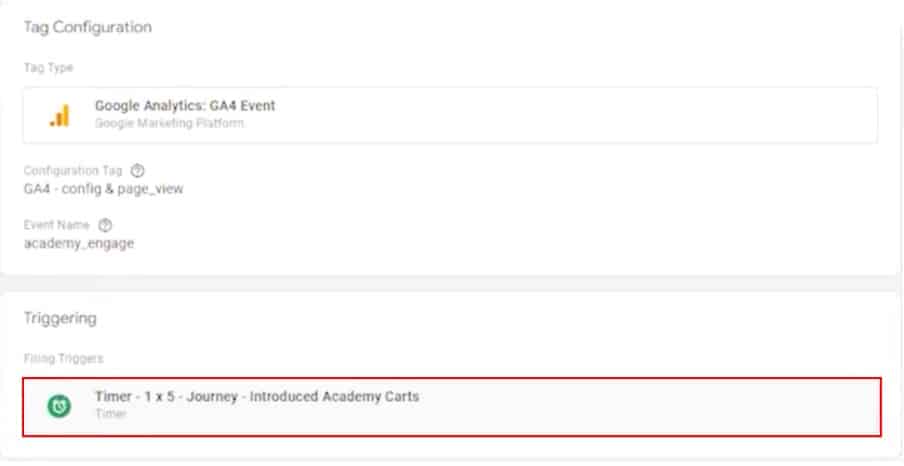
For our ‘academy_engage’ event, we’ve added a trigger for user dwell time on the cart. The event will only trigger if a user spends more than 5 seconds on the cart. This is to exclude the factors mentioned above.
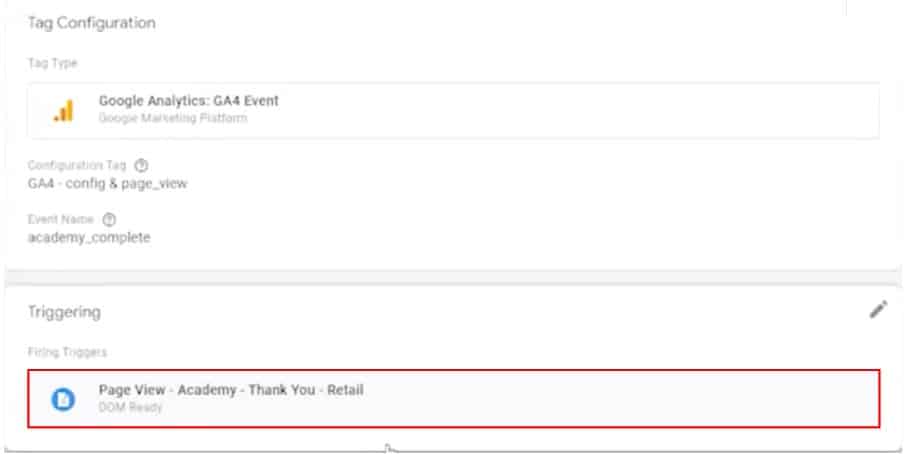
For the ‘academy_complete’ the trigger remains the same. We want to record every user that completes the funnel.
If you haven’t yet, why not try out GTM? As you can see, you can gain an even deeper insight and a better understanding of your funnel.
What Now?
There’s no denying the benefits of using GA4 to optimize your user journeys. It’s the key to improving your site and driving conversions. The A.C.E. method is crucial to getting the information you need.
But now you know what you’re able to do with your A.C.E. results, what is your next step? One option is to get a free course and tools from MeasureMarketing. At the beginning of this article, we talked about the need for a measurement marketing framework. This is the key that so many marketers are missing in order to optimize the GA4 user journey.
The course equips you with the skills you need so that you aren’t marketing to the blind. Why not head over and make the most of the free course?
Further Reading
Want more? Check out our blog for tips on Google Analytics, GTM, and a whole host of other Google packages.
About Julie Brade
Julie Brade has been creating actionable dashboards for a wide variety of companies for over 15 years. Since 2015, she has been with the MeasurementMarketing.io team and has risen through the ranks from assistant to Lead Instructor, Lead Account Manager, and Director of Measurement. She has helped hundreds of companies of all sizes improve their measurement so they can optimize and improve conversions fast and efficiently.

- Top 24 Google Analytics Chrome Extensions & Sheets Add-ons - 21/05/2026
- Best Consent Management Platforms (CMP) - 19/05/2026
- Google Signals and Consent Mode: What This GA4 Change Really Means - 23/04/2026