Google Analytics Acquisition: What Content Are Your Visitors Consuming?

The earlier posts in this series should have given you a grounding in Google Analytics. The articles covered how to use the platform for tracking and optimizing site performance. It also included a guide on how to set Google Analytics up correctly for your website. It’s now time to focus on some of the specific insights Google Analytics acquisition reports can offer.
When thinking about what content you want to create, you should take a look at what is already being consumed by your site visitors. A good way to explain what you can find out is by taking a kind of virtual trip through the proper dashboard. In this guide, you will learn how to use the Google Analytics Acquisition Report.
Previous articles in the Google Analytics Guide:
- An Introduction to Google Analytics (GA3) Universal Analytics
- How to Set up Google Analytics on Your Site the Right Way
- A Beginner’s Guide to Google Analytics Dashboards
- A Simple Guide to Site Search Tracking in Google Analytics
Google Analytics acquisition report
Acquisition is one of the 5 main tabs on your Analytics dashboard. Click ‘Overview’ beneath the tab and you’ll see your main acquisition overview report:
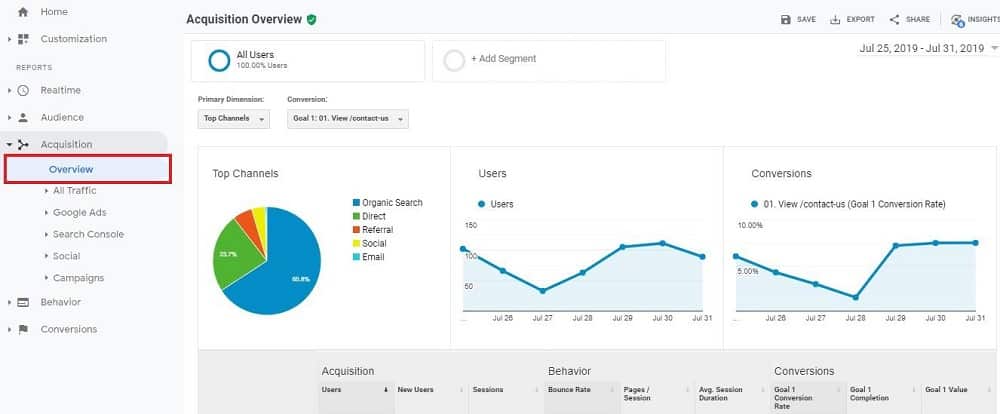
The Acquisition Overview report provides insights such as where your visitors come from and what they do on your site. Importantly, it also displays how that relates to your site’s performance. The main element of the report is the following table:
The table splits site visitors by channel. Channels are the routes taken by visitors to get to your site. In the image above, four channels appear down the left-hand side of the table. They are ‘Organic Search’, ‘Direct’ traffic, ‘Referral’ traffic, and ‘Social’ traffic.
- Organic Search: People coming from Google or a search engine
- Direct Traffic: Visitors who go straight to your website
- Referral Traffic: People who click on a link from another website and arrive on your site
- Social Traffic: People visiting your website from a social media channel like Twitter
Let’s focus on each of the table’s columns and what information they provide you regarding your site traffic.
Site Traffic Insights
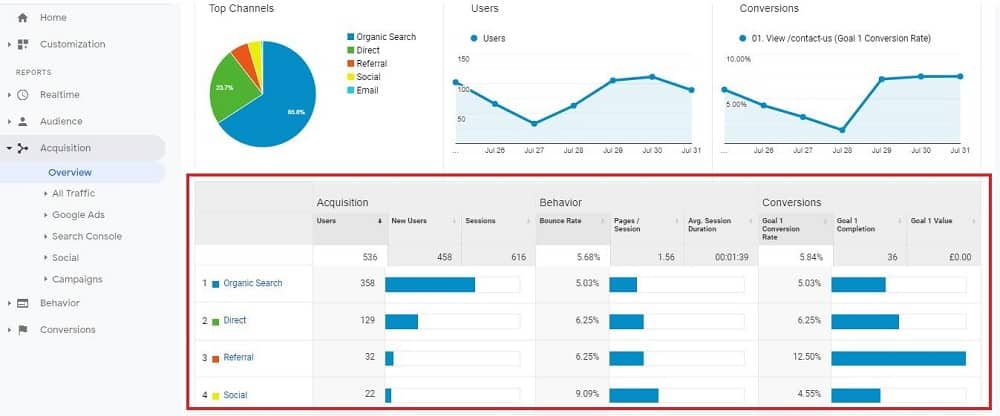
The table which forms the main part of the Google Analytics acquisition overview report has nine columns. Those columns are divided into three categories titled ‘Acquisition’, ‘Behavior’ and ‘Conversions’. That gives you an idea of what the data in each column shows.
The ‘Acquisition’ section of the table relates to the number of site visitors you get and from where.
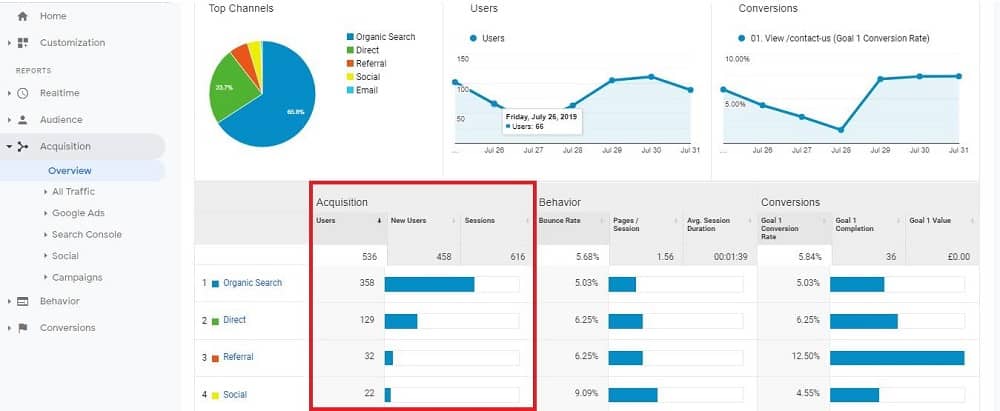
The three columns within the section are as follows:
Users
The number of unique visitors to your site. The total number of users appears at the top and the number of users per each separate channel follows below. From this, you can see which channels are most effective at driving visitors to your site.
New Users
The number of people visiting your site for the first time. Tracking how many new users your site gets is a good way to assess the effectiveness of your marketing efforts. Specifically, marketing aimed at reaching a new audience.
Sessions
Each time a user (new or returning) visits your site, it’s recorded as a session. The total number of sessions should always exceed the number of users. Sessions are an important metric. They help you assess how often users revisit your site. Secondly, knowing the total number of site sessions also allows for the calculation of other metrics (more on them later).
The middle section of the Google Analytics acquisition overview table is titled ‘Behavior’. It provides insights into how visitors use your site.
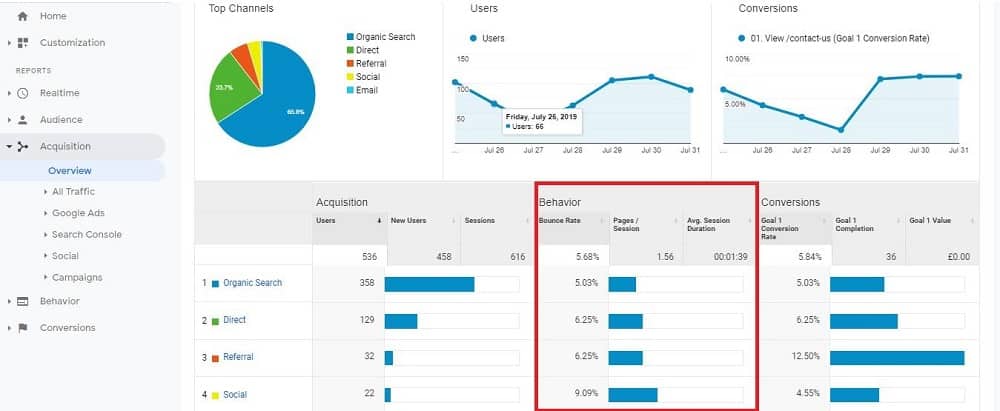
There are also three columns within the ‘Behavior’ section:
Bounce Rate
Although bounce rate is no longer in Google Analytics 4, it is still avaialble to those who still use Universal Analytics. Bounce rate is the percentage of people who visit only one page then leave. The best performing websites have low bounce rates. Knowing your site’s bounce rate helps you identify if and where you may have issues. You can use this information to identify pages to update to bring the bounce rate down if required. Your principal aim is to offer the best customer experience to site users as possible. If you do so, visitors will spend longer on your pages.
Pages/Sessions
This displays the average number of pages visited per site session. Sessions is a metric closely linked to bounce rate. In the same way as you want a low bounce rate, you want a higher pages/session figure. If site visitors view lots of pages in a session, it suggests they’re more engaged with your content.
Avg. Session Duration
The average amount of time that a session on your site lasts. This is a different metric that gives you similar insights to the pages/session figure. The longer visitors stay on your site per session, the more interested they are in your pages.
The final section of the Google Analytics acquisition overview table is the ‘Conversion’ section. This provides data related to specific goals you’ve defined for your site. Those could be marketing goals or retail objectives if you run ecommerce platforms or sites. How to set up and manage these goals is explained in detail in a later post.
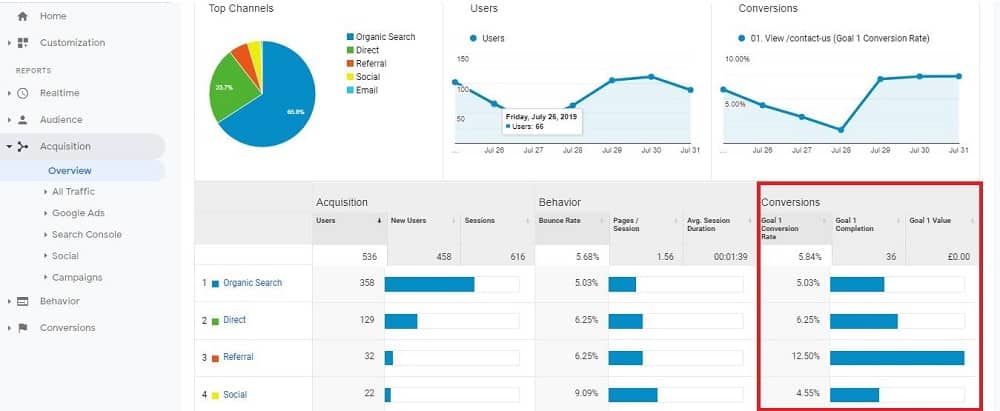
As you’ll expect by now, this final section of the table also includes three columns:
Goal Conversion Rate
The percentage of site sessions that end with one of your defined goals being completed. If you run an online store, that might be a purchase. It could also be a visit to a certain page, or a user performing a desired action. You want your conversion rate to be as high as possible.
Goal Completion
This is your raw data regarding goals. The figure displays the number of times site visitors complete your defined goals.
Goal Value
When you set up a goal, you have the option to give it a monetary value. Each time the goal is completed, the value is recorded and added to your total goal value. This metric can help put a financial figure on how much money you make from a marketing campaign.
Insights By Channel
The Google Analytics Acquisition Overview report splits up your traffic data by channel. All the insights above can be seen for each channel as well as for your site traffic as a whole. Let’s take a look at the different channels and why it can be valuable to view each separately.
Referral Traffic
Referral traffic covers people who come to your pages by clicking on a link from another website. It excludes traffic from search engines and social media. Click ‘Referral’ in the overview table and you’ll see your site’s referral traffic data:
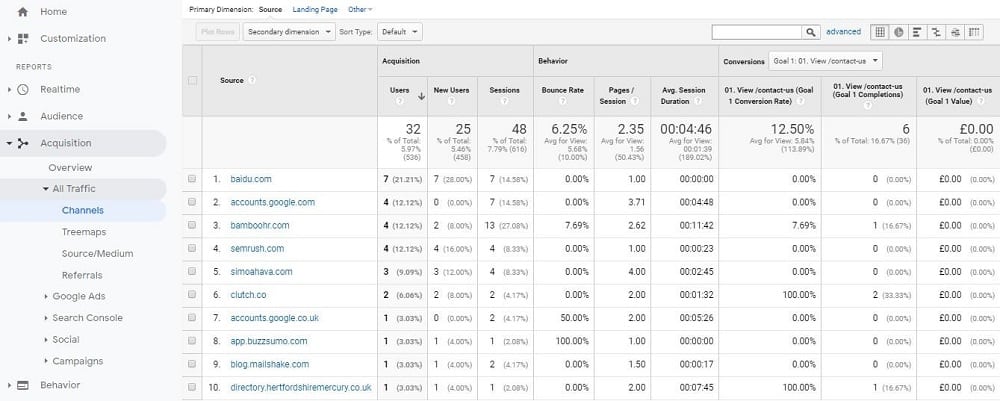
The referral traffic shows you the same insights as you get from the overview table, but by referring sites rather than by channel. You can use this information to spot if a certain site is starting to send new traffic your way. Reaching out to that site’s owner might be a good way to harness new marketing opportunities. You could, for instance, enter into a more formal arrangement for promoting each other’s content.
Organic Search Traffic
If you are running a website in English, most of your traffic will come from Google. These visitors will have found your content after performing a search, and then choosing one of your pages from the search engine results page (SERP). The table with ‘Organic Search’ looks a bit different from the other overview reports:
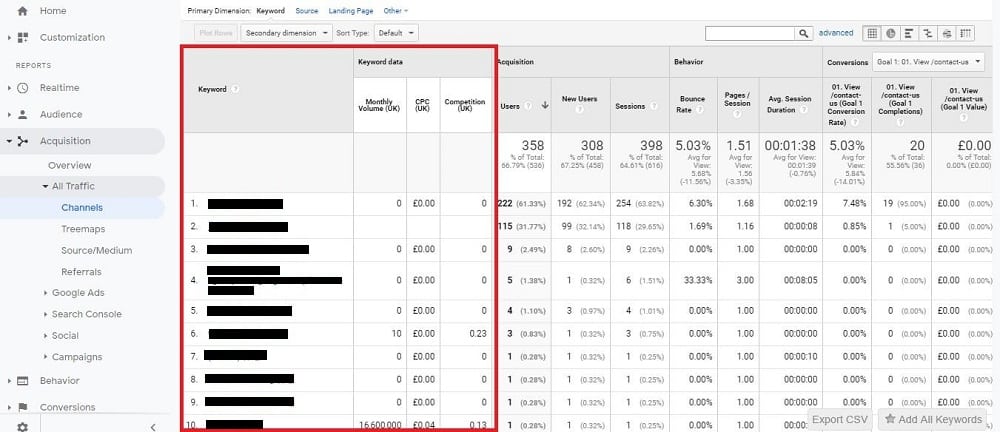
The organic search table has a few more columns than normal. On the table, you’ll see the keywords your site visitor searched for to reach your site. You can also find details here such as how often the keywords are searched for and how competitive they are.
Information like this can be useful for your wider marketing. Such keyword research is really handy when it comes to designing a content marketing strategy. More in-depth data on keywords is available via the Google Search Console. How you can harness this will form the basis of a later post.
Direct Traffic
Direct traffic is made up of visitors who head straight to your site. They don’t need a referral or even to perform a search to find you. Having a high level of direct traffic is a great sign for a site. It shows that people recognize the site’s value and ability to deliver what they need.
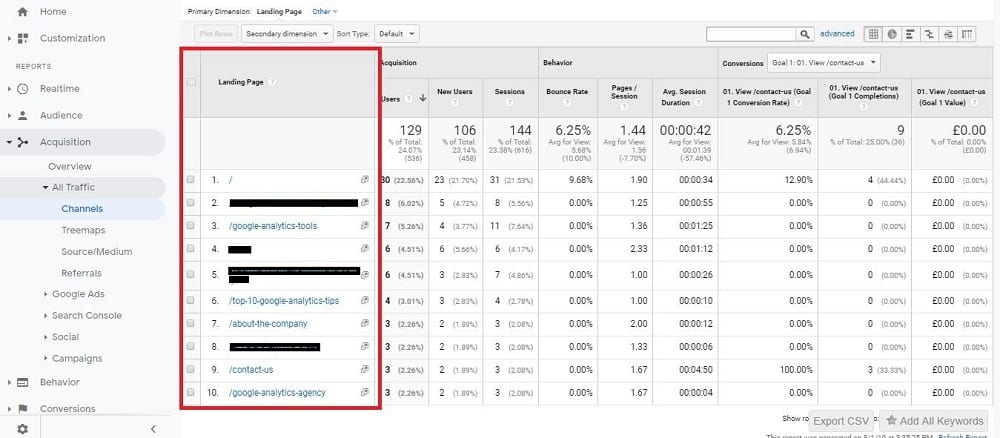
The direct traffic report in Google Analytics shows insights arranged by your pages which get direct traffic. You can see the parts of your site that get direct traffic most often, and how visitors to those pages behave.
A high amount of direct traffic to your site is likely to be linked to a high volume of branded traffic. Branded traffic is when people search for your company or brand name via Google.

Some companies gets a lot of brand traffic. That can sometimes mean that Google starts to show lots of related suggestions when you type your brand name which can sometimes look like this “Brand Name + Keyword” as shown above. The brand name is Versace and is therefore branded traffic, but there are a bunch of keywords attached to the suggestions, ie cologne, blue jeans or robe.
Social Traffic
Social traffic covers visitors that come to your site from social media platforms. That might be from a link via a particular tweet, Facebook update or other social media post that you put out. The social traffic report table looks like this:
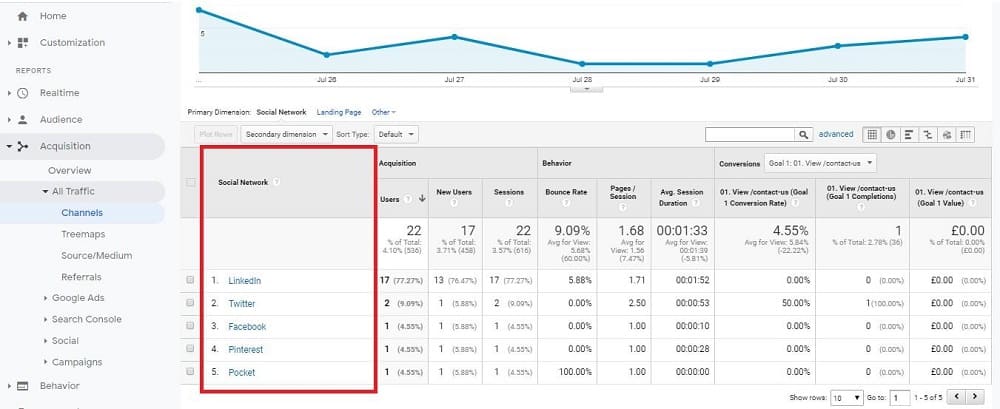
The table shows your site’s social traffic split by social network. From this, you can see which networks are delivering you the most traffic. This information is useful for planning or arranging any future social media marketing. The report also allows you to monitor the success or otherwise of any social media campaigns.
Conclusion
Google Analytics acquisition reports provide a wide array of different insights into visitors to your site. By analyzing these reports, you can learn who comes to your site, how, and what they do when they arrive. All of that is critical to optimizing your site’s performance.
Knowing the channels that deliver visitors helps you to improve your marketing campaigns. Seeing how visitors interact with your site enables you to identify issues with pages or features, and fix them. Learning how traffic relates to goal conversions allows you to put a value figure on site performance.
- Top 24 Google Analytics Chrome Extensions & Sheets Add-ons - 21/05/2026
- Best Consent Management Platforms (CMP) - 19/05/2026
- Google Signals and Consent Mode: What This GA4 Change Really Means - 23/04/2026