The GA4 Process Toolbox: How to get the most out of GA4

This is a write-up of Jeff Sauer’s talk at GA4ward. You can find his Slides here. You can also find a recording of his talk here:
In this talk, Jeff mentions his periodic table resource. It’s a must-have for analysts because it gives a visual display of all the options you have at your disposal in GA4. Check it out!
Today, we’ll be looking at the GA4 process toolbox and how you get the most out of GA4. This article will give you three simple DIY strategies.
- DIY #1 – Customizing the interface to look more familiar.
- DIY #2 – Aligning your reports to your marketing strategy.
- DIY #3 – Migrating to GA4 with Ease.
Let’s start by jumping into the first DIY.
DIY #1: customize your GA4 interface
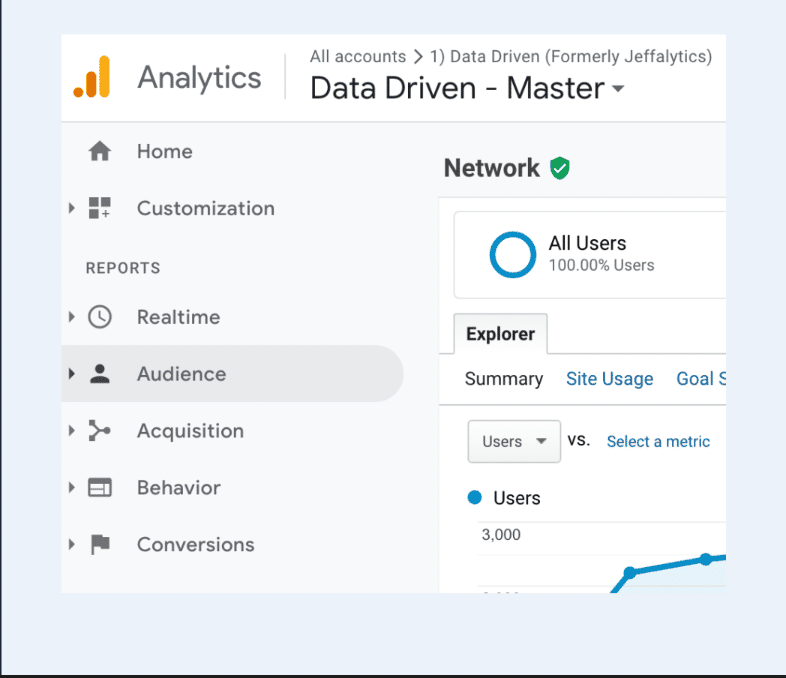
Let’s start by framing the problem. What is the biggest issue that people have with GA4? For many of us, it’s that the GA4 doesn’t match Universal Analytics (UA). The interface isn’t familiar, and we can’t find what we’re looking for. We want improved GA4 processes, but we want to appreciate them from the familiarity of the old layout.
Well, if you don’t like the interface, there’s some good news. You can make the GA4 interface look just like UA with a few steps.
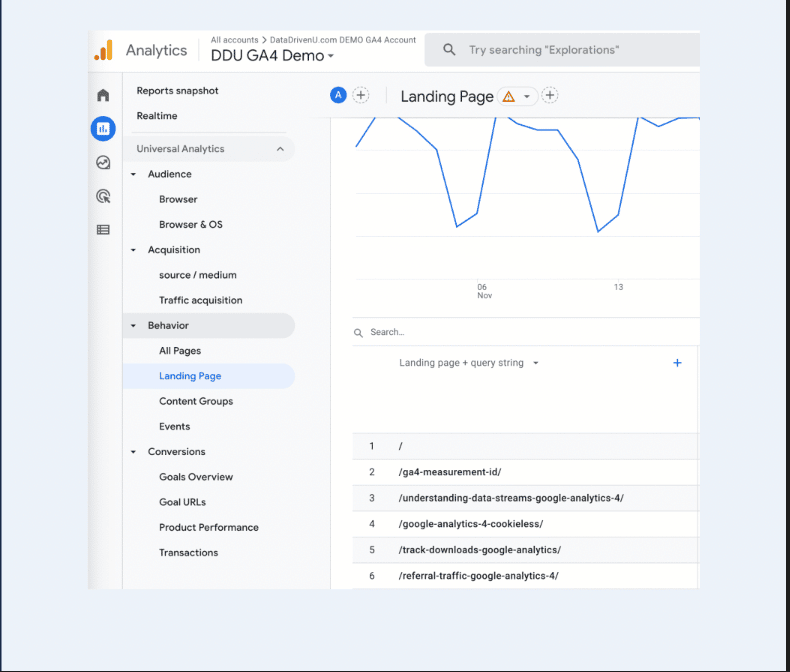
As you can see, our GA4 account now has the same layout as UA. Not only that, but we have brought back some of our favorite older reports.
Here’s how it’s done!
Recreating UA reports in GA4
The first thing is to accept that we don’t need all UA reports. Instead, we’ll create the best parts of UA within GA4. We’ll trim the reports that don’t matter and only add the reports that we need.
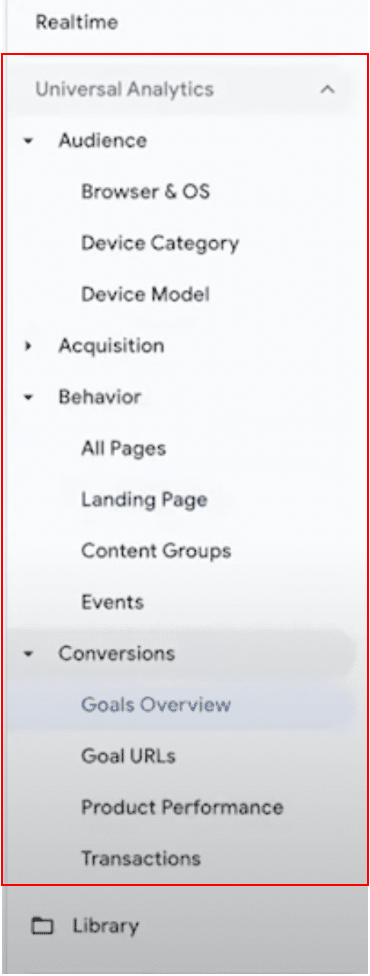
Here is our GA4 reports menu. Notice how instead of ‘Lifecycle’ we have ‘Universal Analytics’. We also have access to some valuable reports, including ‘Landing Page’, ‘Events’, and ‘All Pages’.
Here’s how we recreated this layout.
Let’s head into Universal Analytics. For this example, we’ll go to the Audience report>technology>Browser & OS> (although you can recreate report any report that you like).
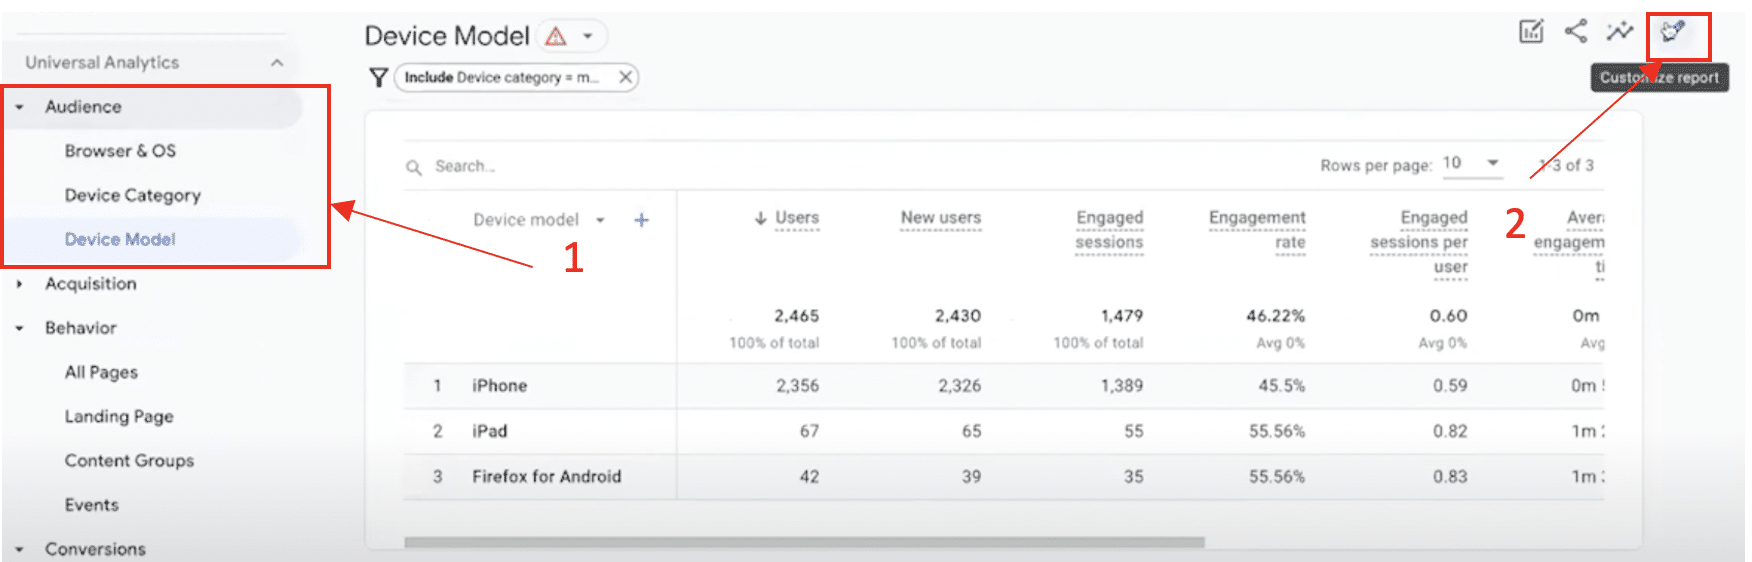
We’ll add this back into our GA4 report. We’ll go to Audience>Device Model, and then choose ‘Customize report’.
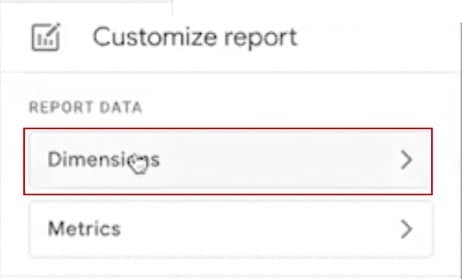
Next, we’ll choose ‘Dimensions’. We now get a list of primary dimensions which can be included in our reports. Many people don’t know about this feature and stick with the default dimension. By customizing our reports, we can choose any default dimension that we need.
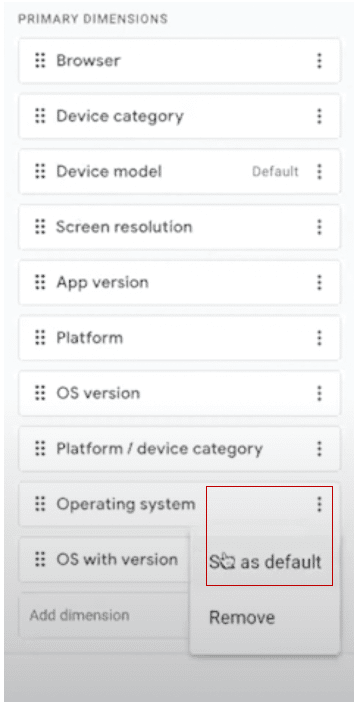
All we need to do is select the three dots on our chosen dimension and click ‘Set as Default’. In this instance, we’ll choose ‘Operating System’ .
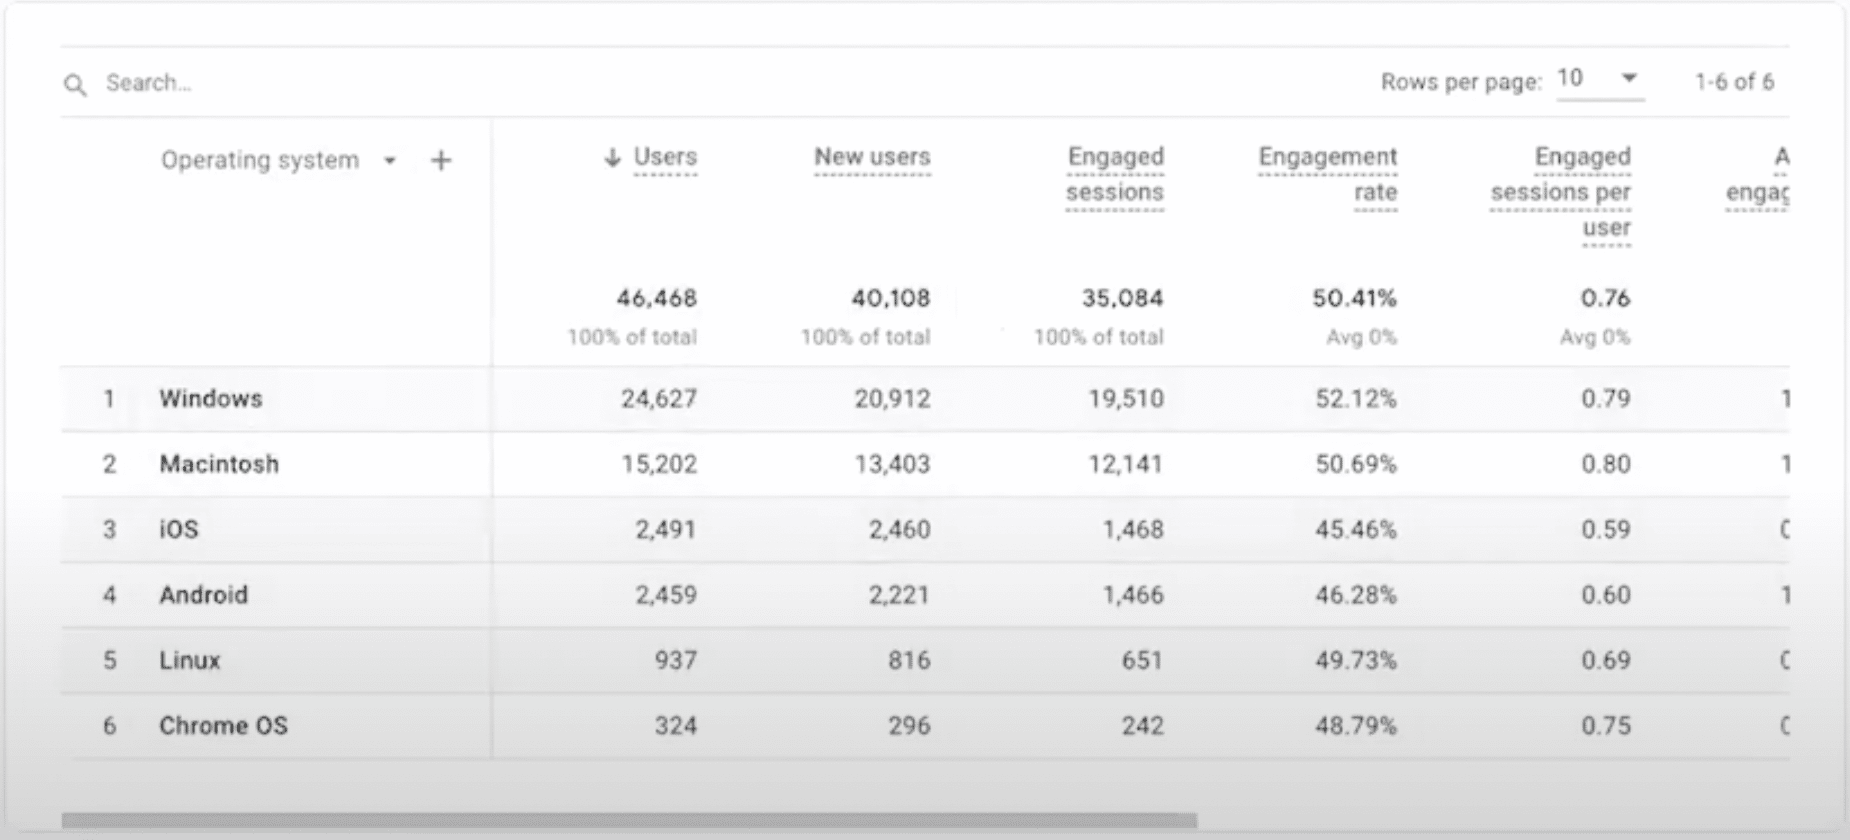
As you can see, the report has been updated to show a list of operating systems for users on our website.
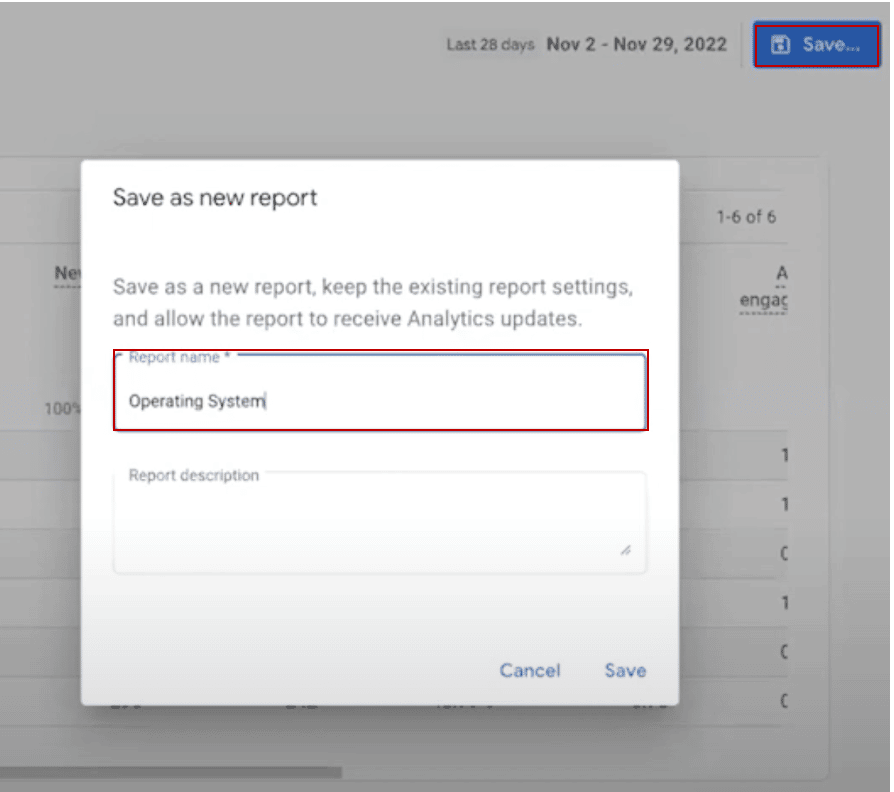
Let’s save this as a new report called ‘Operating System’. Now, we’ll head back, and compare this to the UA report.
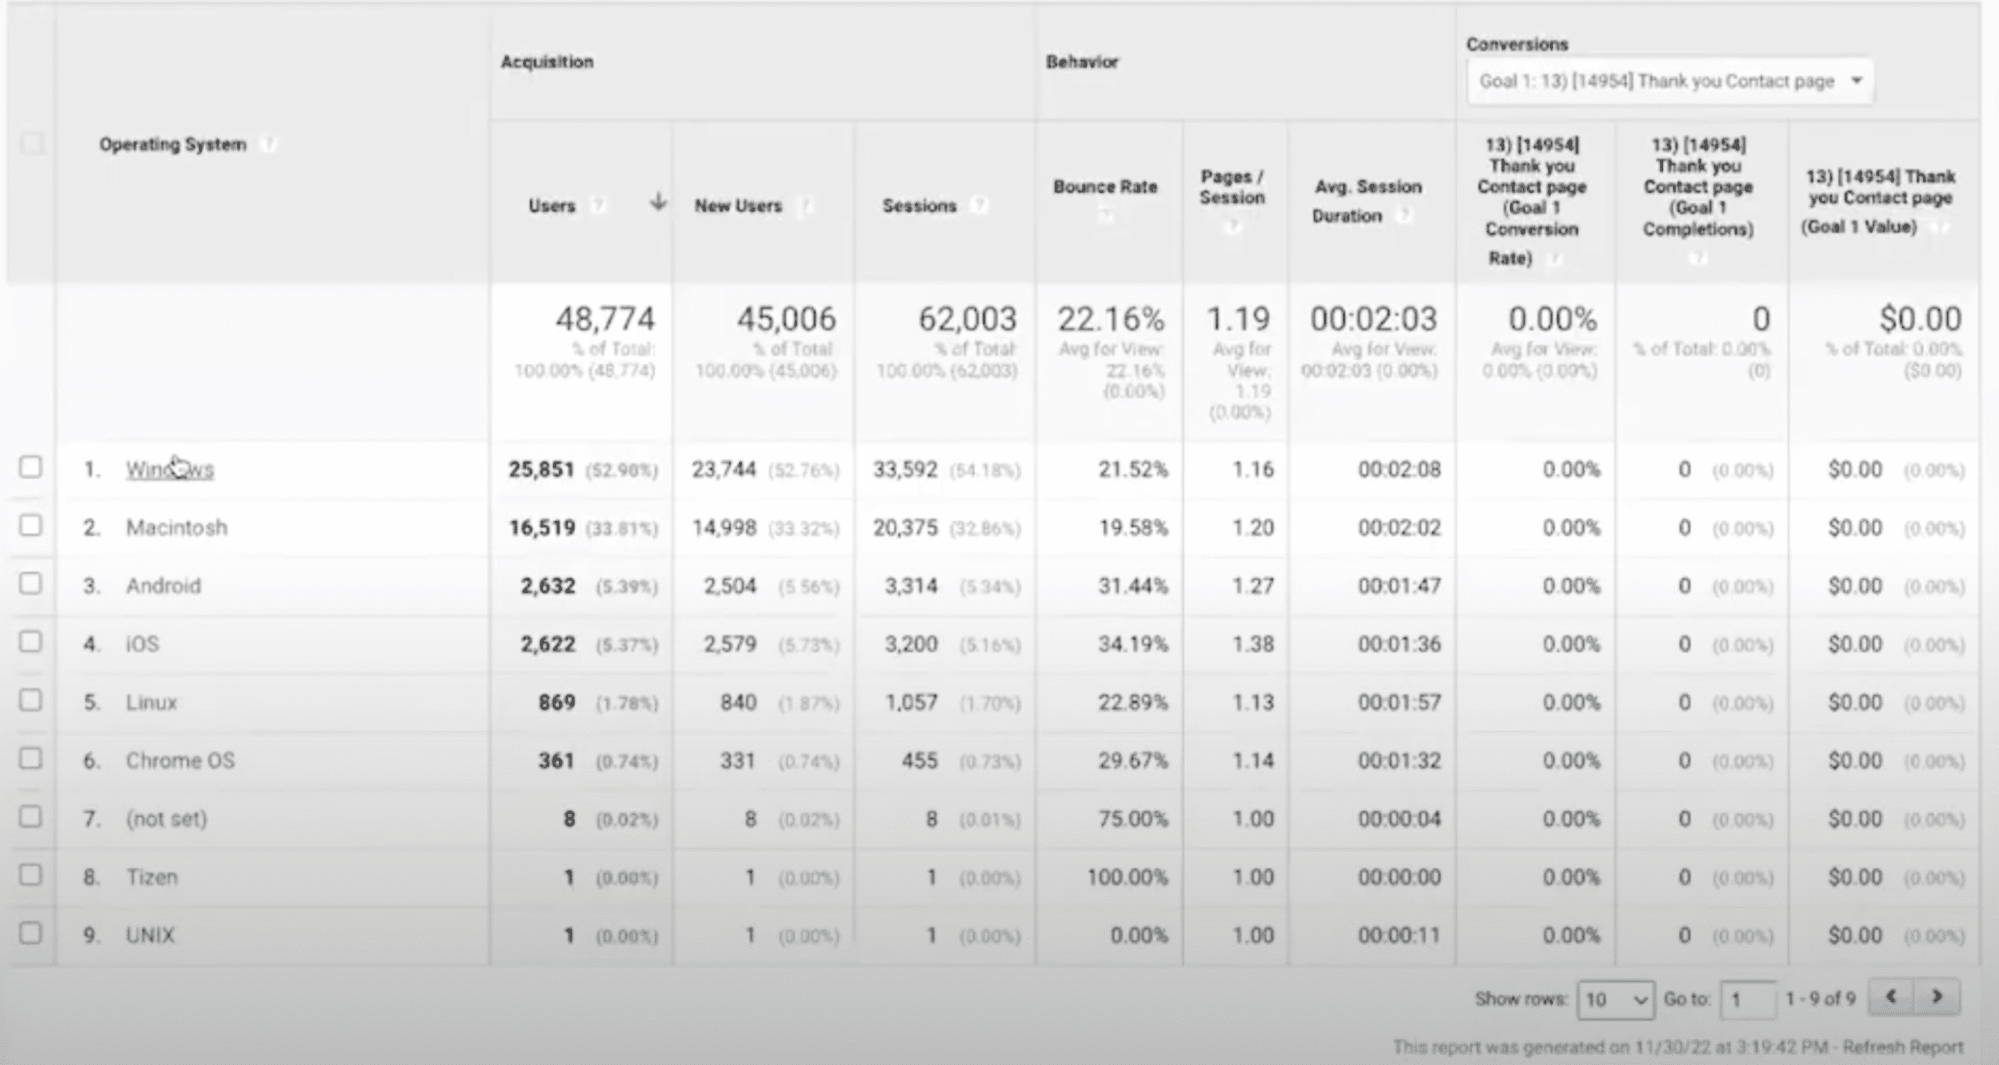
As seen above, we have pretty much the same data within UA. The only difference is there are fewer users in GA4 due to differences in user tracking.
Making reports a feature in the GA4 reporting system
Now, what if we wanted to make our new report a permanent feature in our GA4 reporting system?
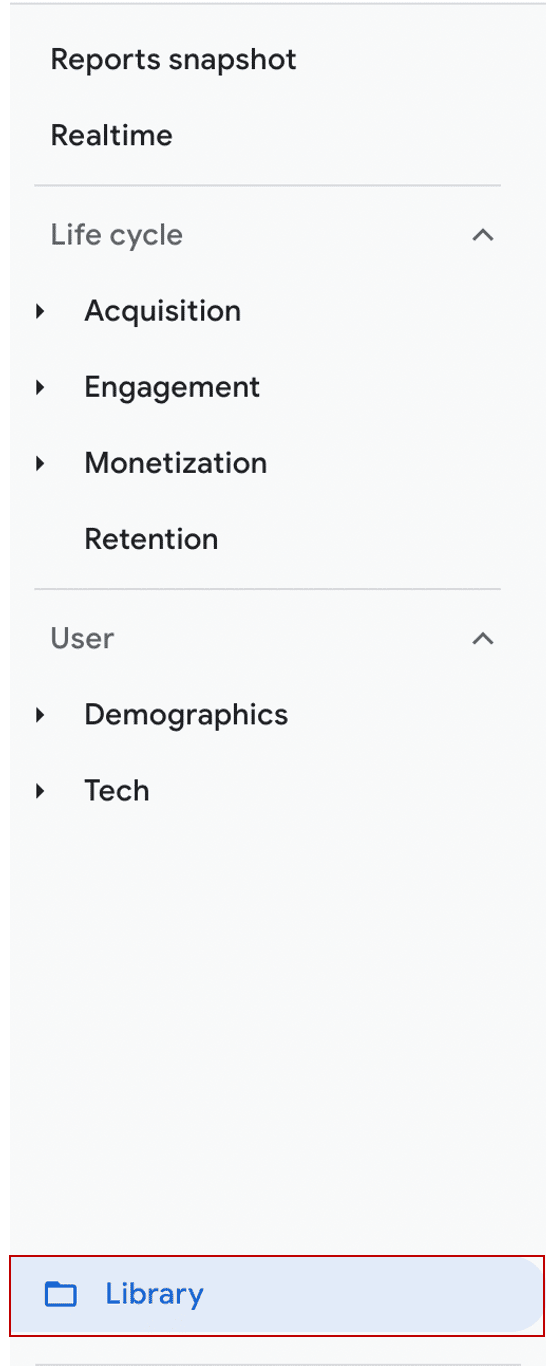
First, we need to go to ‘Library’ at the right button of our ‘Reports’ screen.
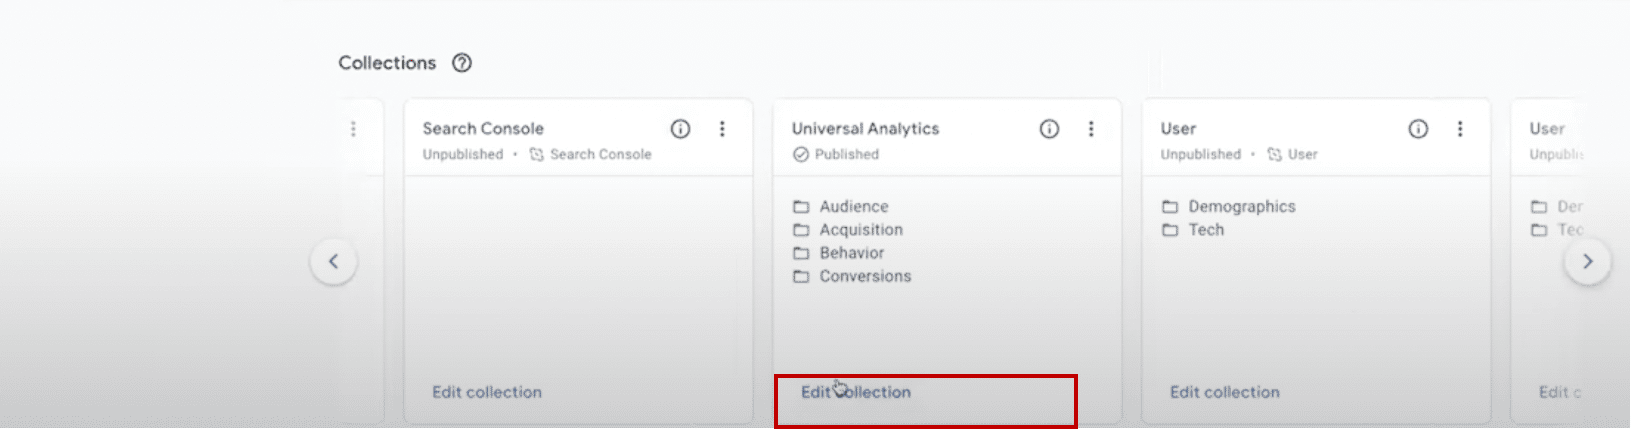
We’ll cycle along until we find our previously created ‘Universal Analytics’ collection (you will need to create this collection first). We’ll then choose ‘Edit Collection’.
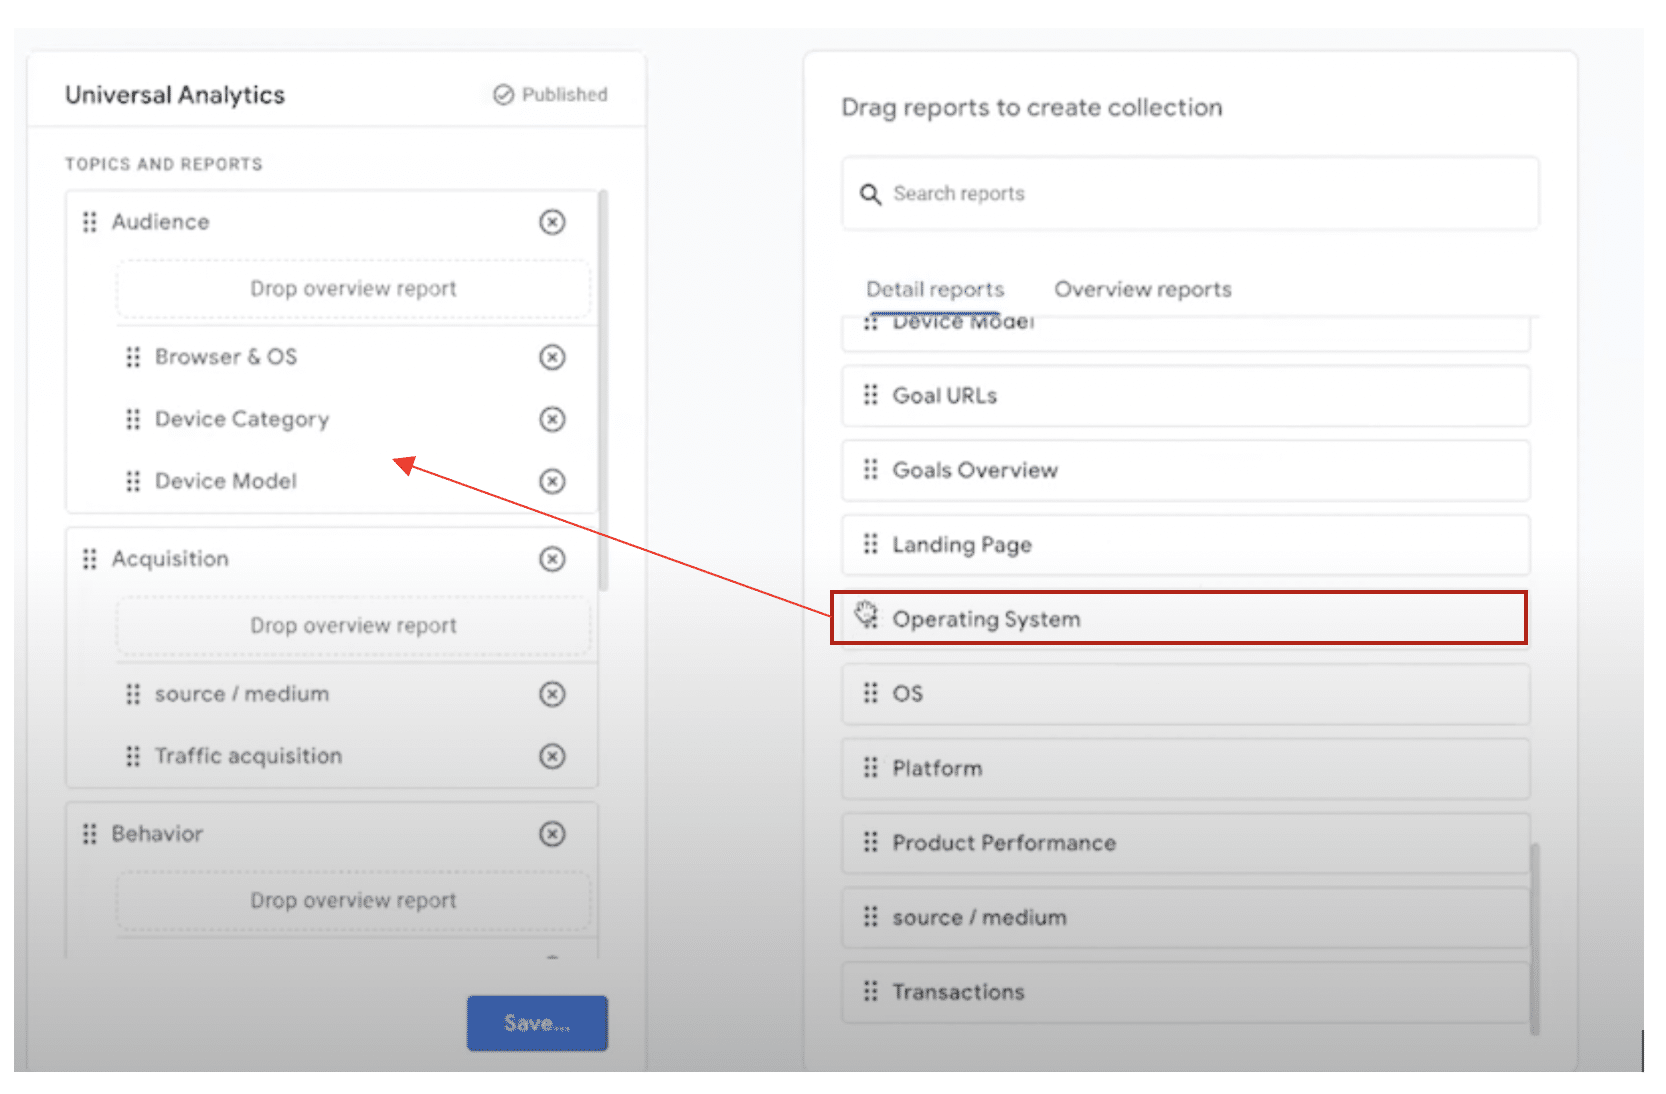
From the right, we have a list of previously created reports. We’ll drag our ‘Operating System report’ into the menu on the left.
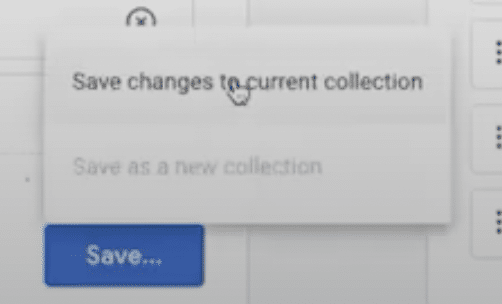
We’ll now choose ‘Save changes to current collection’.
The report is now a permanent feature within our analytics! One report at a time, you can build up the most important parts of Universal Analytics.
Of course, whilst customizing your interface is a key part of your GA4 toolbox, the process can be daunting. This is especially the case when you are trying to recreate each report from UA individually. To make things a bit simpler, make sure you have a standard operating procedure in place.
DIY #2: align reports to marketing strategy
Let’s look at 80/20 of GA4.
- Don’t touch Universal Analytics at all.
- Create a GA4 Property and a new data stream (if you haven’t
already).
- In addition to sending data to UA, send it to GA4 in parallel.
- *Go into your data stream settings and enable “Enhanced Measurement”.
- **Align your GA4 reporting to your company marketing objectives.
Congratulations, you have just set up parallel tracking!
*This can be done in as little as 5-10 minutes
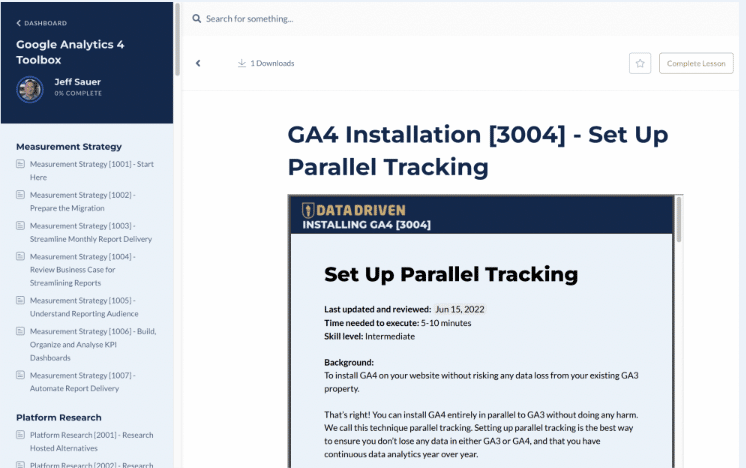
We have a process for this in our GA4 toolbox. This shouldn’t take more than 5-10 minutes, as long as you have Google Tag Manager in place. It does, however, require a more intermediate level of skill due to the use of GTM.
**Four-step strategy for marketing and measurement
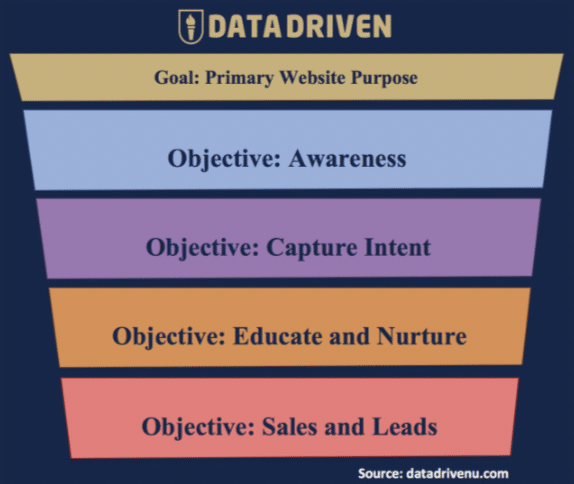
We have created ACES, a four-step strategy for marketing and measurement. You use this to set goals for your business.
- A – Awareness
- C – Capture Intent
- E – Educate and Nurture
- S – Sales and Leads
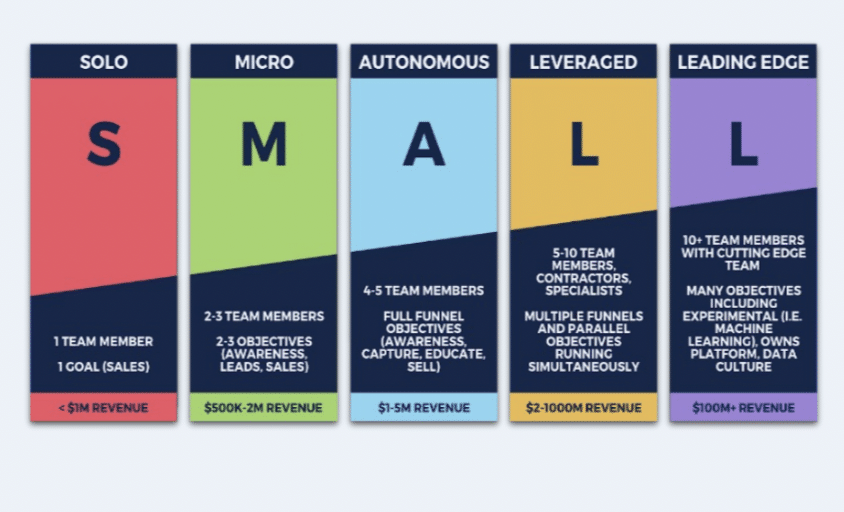
We also have another framework called SMALL. This helps you to understand where you’re at based on the size of your business.
- S – Solo
- M – Micro
- A – Autonomous
- L – Leveraged
- L – Leading edge
The SMALL model takes you through each stage of business growth. Each goal is aligned with objectives and KPI targets. A solo business has only one goal: sales. A leading edge business, on the other hand, has many objectives. This means many more team members and KPIs.
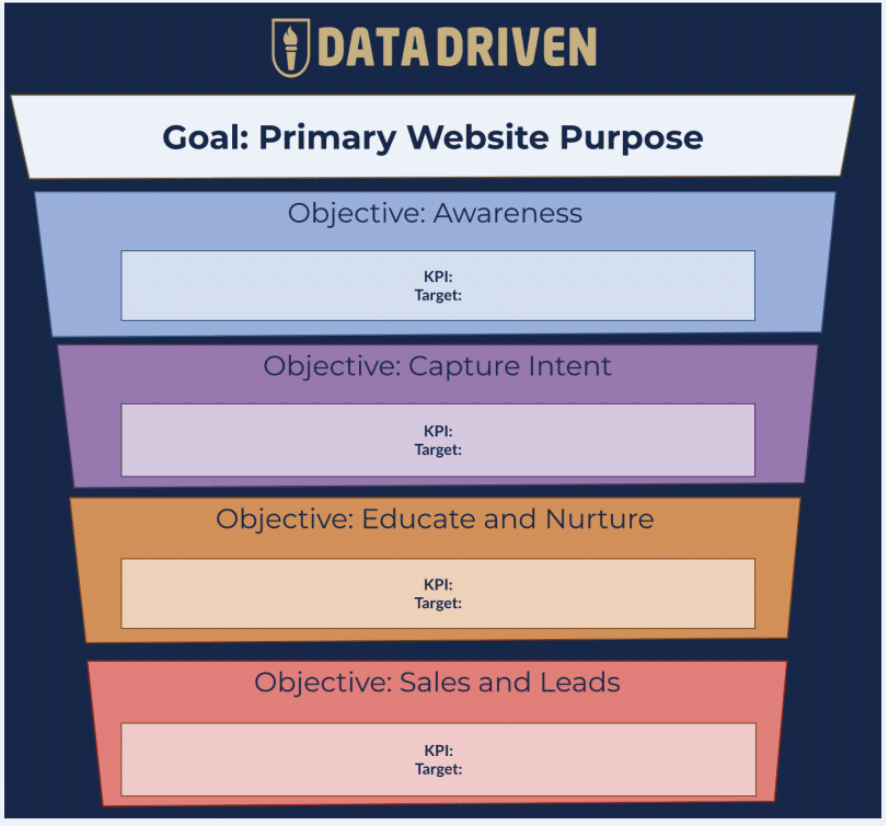
The KPIs you have identified are then aligned with objectives and KPI targets.
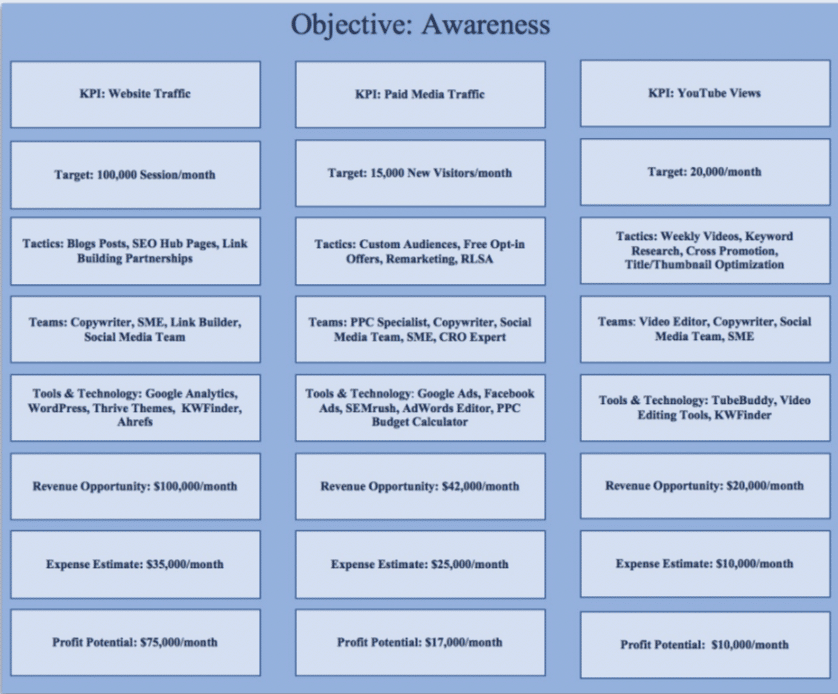
Eventually, for each objective, you can also set KPIs and targets using ACES. These will go into more granular detail, such as the tools and teams that are involved.
The key thing to remember is that your business’s finance department’s priority is profit. They will want to know what the payment for your investment will be. That’s what you can learn by utilizing this model.
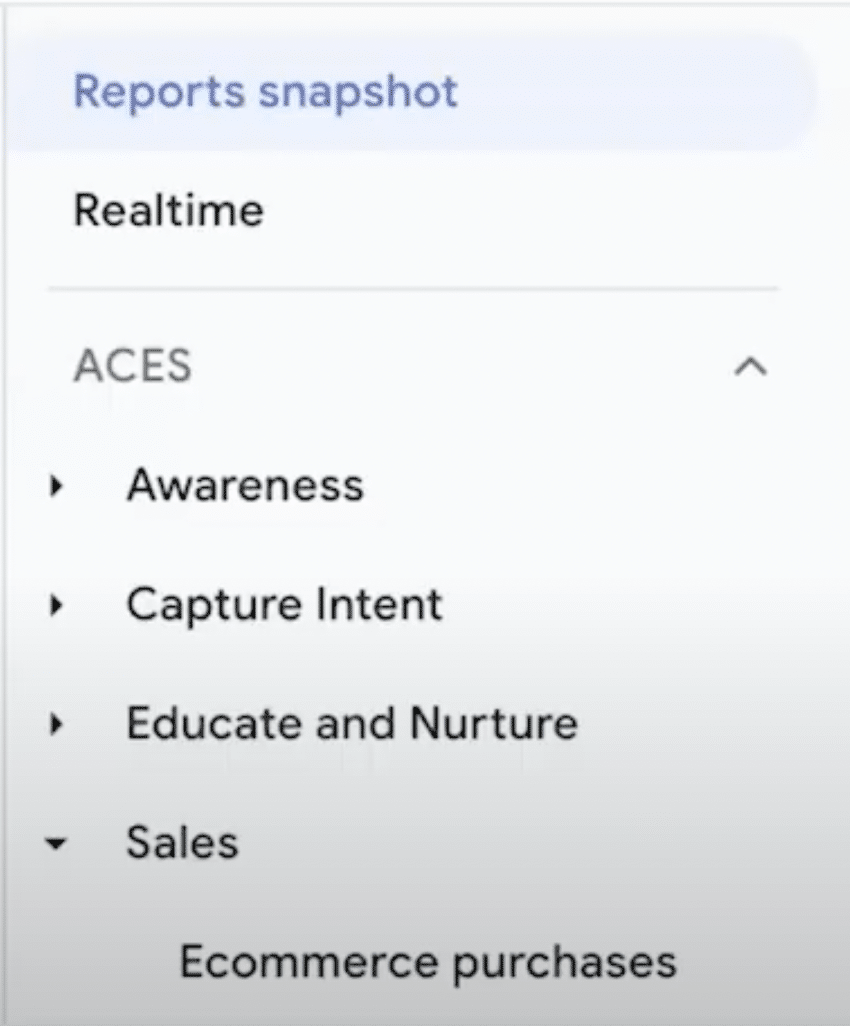
You can then go into GA4 and set up conversions for each of your KPIs. You can even make sure that GA4 matches your strategy. So, why not set up ACES (as shown above) within GA?
DIY #3 – Migrate to GA4 with ease
Let’s dig even deeper into the GA4 process toolbox and show how we can easily migrate to GA4. As we know, there are hundreds of things that we can do with the tool. Unfortunately, in the absence of much of a manual from Google, we have to figure things out ourselves.
The GA4 toolbox
Luckily, there are plenty of resources available online to help out. Blogs and support documentations are easily available.

The problem with blog posts and support docs, however, is that they aren’t written like checklists. For checklists, you need a dedicated resource. That’s where our GA4 toolbox comes in handy. This guides you through each stage of a GA4 migration checklist to track your progress.
The toolbox contains more than 80 different resources for DIY GA4. We have processes for
- Campaign tracking
- eCommerce reporting
- Tagging
- Debugging
- Dashboards
- Integrations
- Data quality
You can access our free migration report today – simply head to this link.
DataDriven periodic table
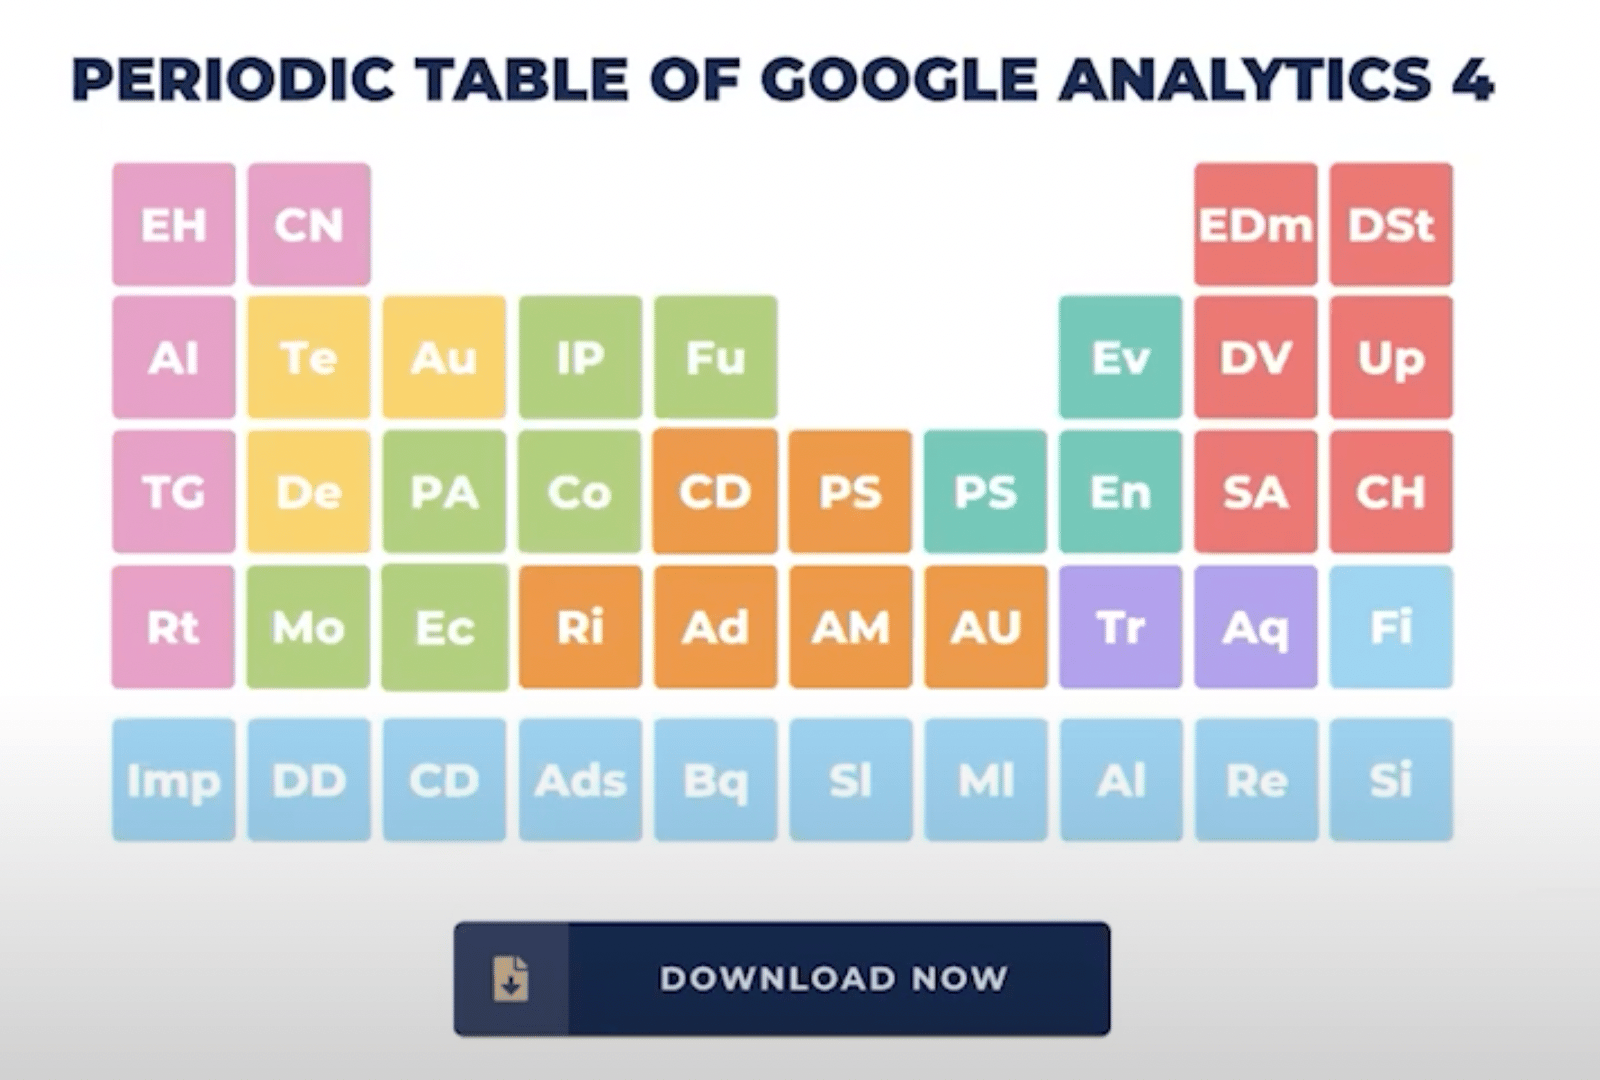
The GA4 periodic table is another resource offered by DataDriven. The Table is constantly updated and available to access now. Why not explore the different elements, and learn about many different aspects of GA4?
Remember the three tips!
So, we have looked at three DIY tips for GA4 success. And the best news is that you don’t need to be an analytics expert to put them into action.
By sticking to the tips, you can transform your GA experience. Migration will be easy, and you’ll feel quickly at home in GA4. You’ll have better interfaces that suit your needs. Finally, your reports will be aligned with your marketing strategy. You’ll produce more streamlined and effective marketing.
Remember, the DataDriven toolbox is here to help you on your GA4 journey. You’ll implement GA4 processes the right way, and get access to more than 80 SOPs, dashboards, and checklists. Why not explore the GA4 toolbox now, and learn more about what DataDriven has to offer?
Further reading
Want more? Check out our blog for tips on Google Analytics, as well as a whole host of other Google packages.
About Jeff Sauer
Jeff Sauer is the Founder of Data Driven U, agency owner, business coach, lecturer, and a digital nomad. A firm believer in data-driven marketing, Jeff has developed a world-class marketing curriculum that is taught in Universities.
He has also delivered over 100 keynote speeches in 20+ countries.

- Top 24 Google Analytics Chrome Extensions & Sheets Add-ons - 21/05/2026
- Best Consent Management Platforms (CMP) - 19/05/2026
- Google Signals and Consent Mode: What This GA4 Change Really Means - 23/04/2026