Advanced Google Analytics 4 (GA4) Tips & Tricks

This is a write-up of Charles Farina’s talk at GA4ward where he shared some advanced GA4 tips & tricks. You can find a link to his Slides here. And you can view a recording of his talk here:
User identity
In this article, we’ll explore some of the fundamentals of Google Analytics 4. Let’s begin by looking at user identity – how does GA4 identify users? More broadly, what can we do to track users with the different methods that we have?
One of the things that you may not know, is that for the first time, GA has a setting inside the admin page where you can change the identifier for user tracking.
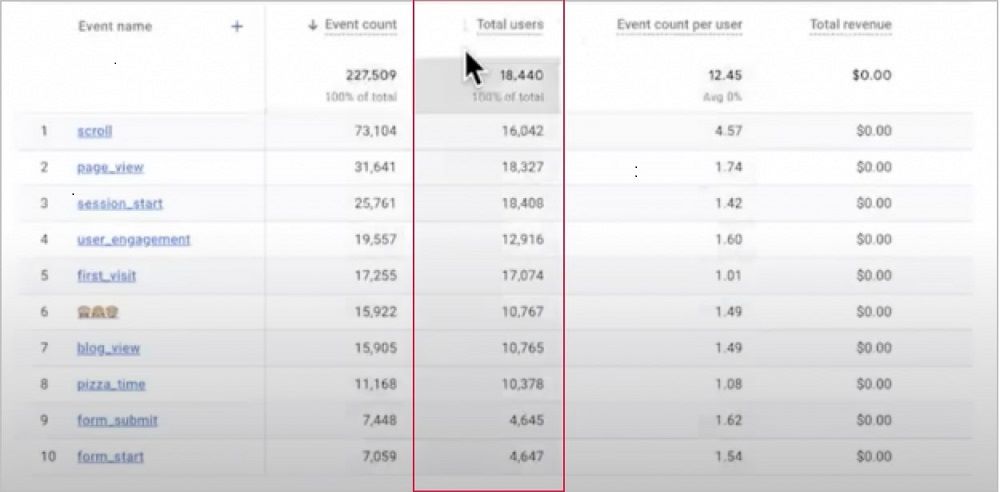
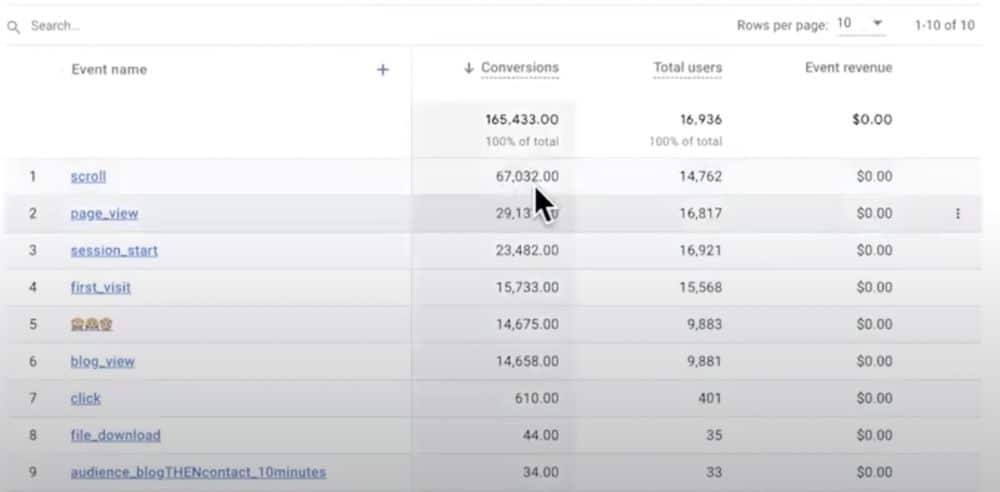
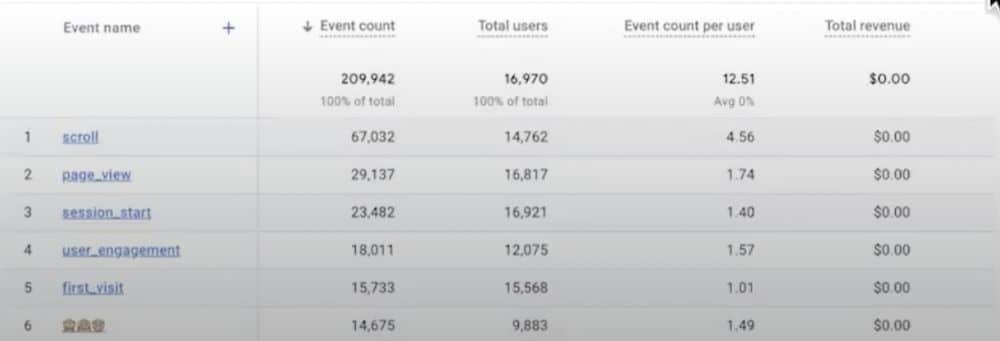
You’ll notice the ‘Total users’ metric in the image above. But what if we wanted to change how these users are counted?
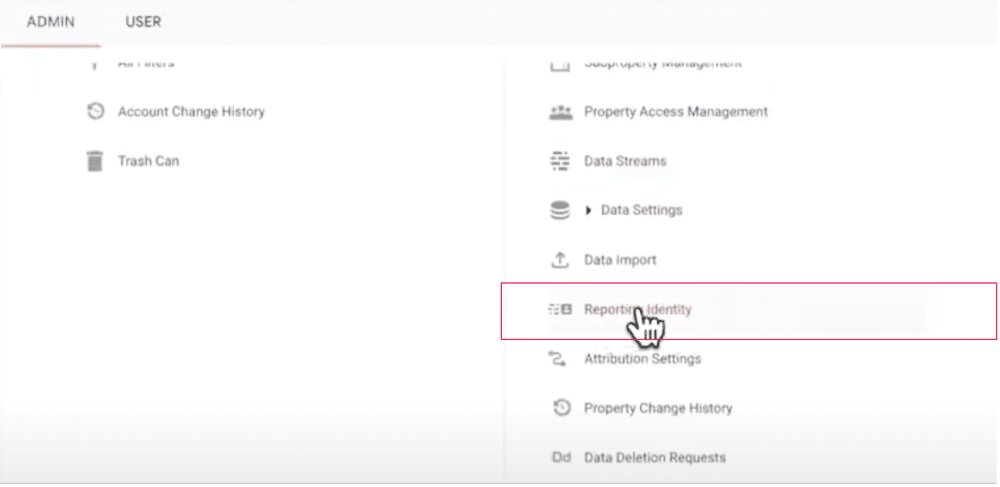
Let’s head over to the admin section. From here, we’ll choose ‘Reporting Identity’.
The best thing about this menu is that the settings are flexible. In Universal Analytics, any changes made to settings would have a permanent effect on incoming data. With GA4, on the other hand, settings have been built to be flexible and retroactive.
If you want to change the reporting identity within GA4 you can do so without worrying. If you want to change it back later on, you can also do so.
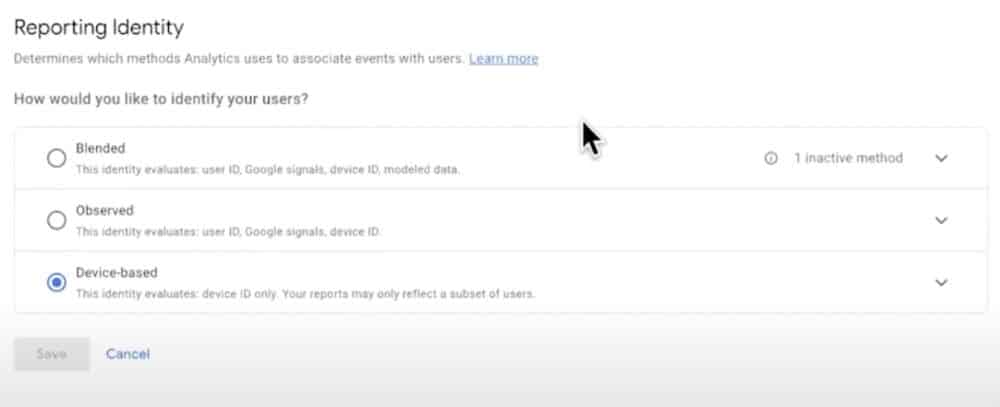
On the Reporting Identity menu, there are three primary ways that GA4 can identify users. These options are ‘Blended’, ‘Observed’ and ‘Device-based’. But what do these options mean? Let’s unpack them.
Blended reporting identity
The blended option tries to use multiple IDs. First and foremost it will look at User IDs. These are primarily obtained when users log in through your website. If no user ID is present, the blended option will look for the following IDs:
- Google Signals – Uses information from users that are signed into Google. More on this later.
- Device ID – Uses the client ID for websites or the app instance ID. When anyone visits your website or has a mobile app, it creates a mobile ID. This ID is then stored until a user clears it.
- Modelling – When no other options are available, GA will estimate user activity
Observed reporting identity
This option also looks at multiple IDs, covering all the options above, except for modelling.
Device-based reporting identity
This option is primarily using the first-party cookie. This is the default way that most marketing solutions work.
The ‘Blended’ option is the default setting for GA4. One of the first things that GA recommends, when using this option, is to enable Google Signals.
The importance of Google Signals
There are occasions when a website doesn’t have that many user IDs. This is because only a small number of users have created accounts. For websites in this situation, it’s more difficult to track users.
Luckily Google have spotted this issue and created a potential solution: Google Signals. This tool gains data from users that are signed in using Google Accounts (as long as they have granted permission).
Using their identity graph, Google can better connect users across devices and browsers.
What information do you gain from Google Signals?
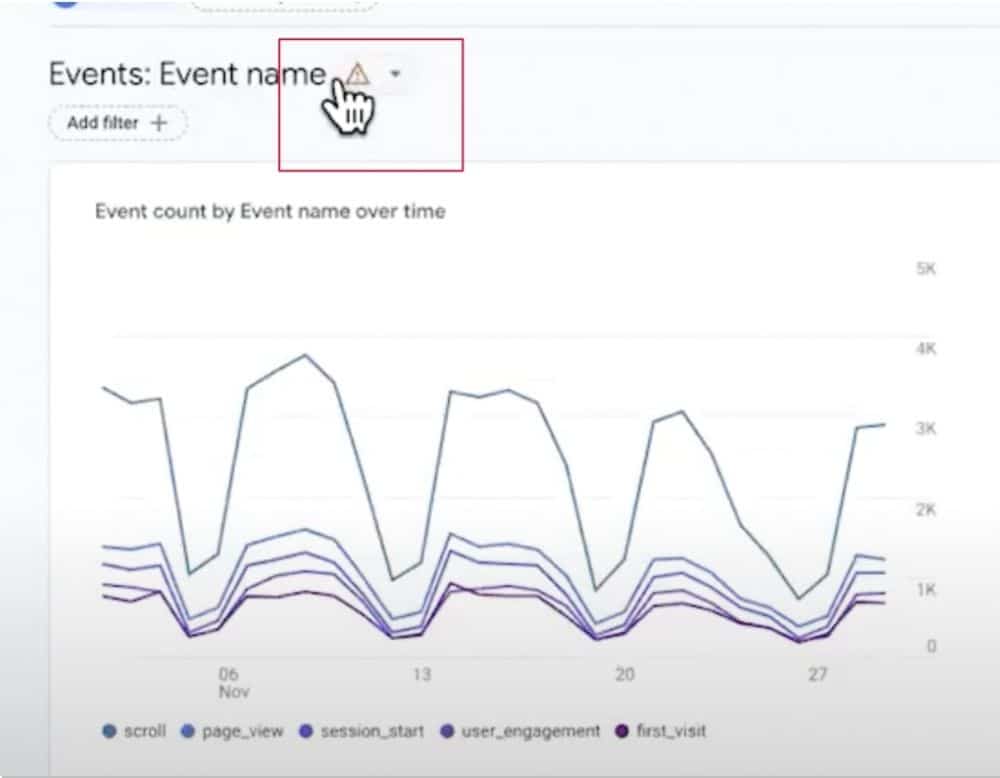
You’ll notice a box at the top of your reports. This will either be a triangle or a green check. But what do the two symbols mean?
When using Google Signals, you’ll notice that reports contain the former. This is because you are using Google’s proprietary data. In other words, you cannot differentiate between Google users and none Google users. Google is thresholding data to protect privacy.
This has the effect of removing reports that have a low number of rows. It’s worth taking a closer look at this, as it can be confusing.

Let’s say that we change the date range to the previous week. Now let’s look at the rows in our report.
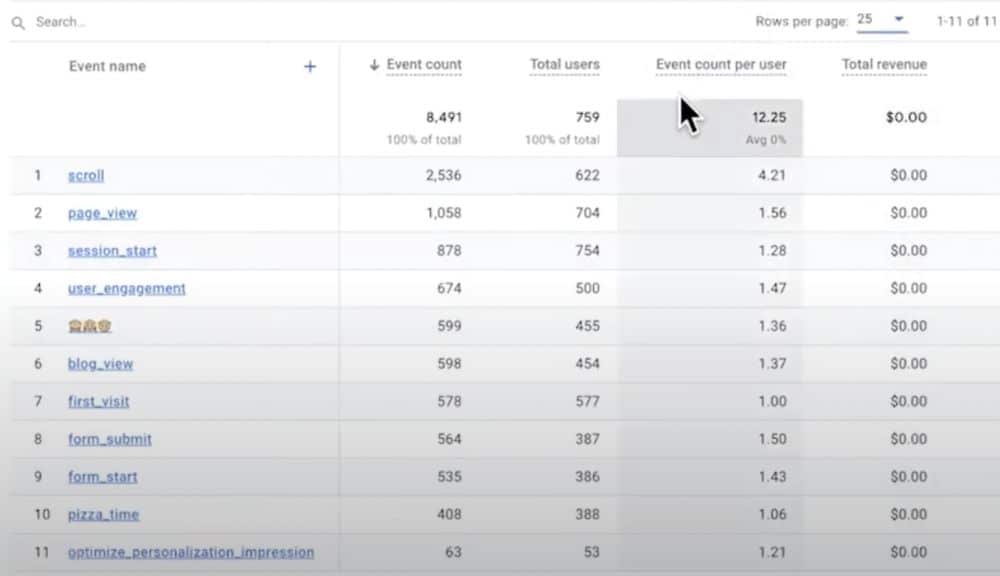
You’ll notice that we only have 11 rows. If we expand the date range to cover a longer period of time, more rows will be available. Under the Google Signals setting, depending on the amount of data that you’re using, you might not actually be looking at a full report.
But what can we do about this problem? The best solution is not to use the blended identity setting. Instead, choose the ‘Device Based’ Option. This way, Google Signals data isn’t counted in your data, and information isn’t excluded.
Attribution
Attribution has always been the fundamental reason that some marketers use Google Analytics. In GA4, attribution has become much more flexible. For the first time ever in GA, you can change the default attribution model within the platform.
But this flexibility also adds some confusion, especially for new users.
Attribution scopes
Many people are pulling the wrong sorts of data or reports. This means that they are often analyzing or digesting information incorrectly. This is because there is a misunderstanding around scopes and how attribution reports work. To unpack this, it’s important to start with the three basic components of attribution in GA4.
- Attribution at an event level.
- Attribution at session level.
- Attribution at the user level.
Previously, in Universal Analytics there was only the session-scoped attribution. This made things much simpler. But in GA4, there is a new sophistication. We have a first touch or user approach, in addition to an individual event-level component.
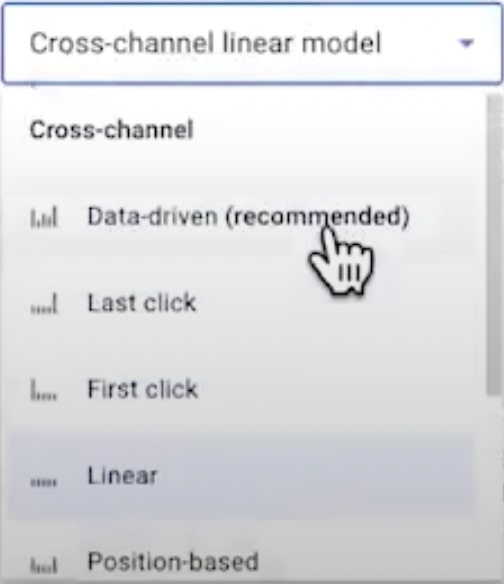
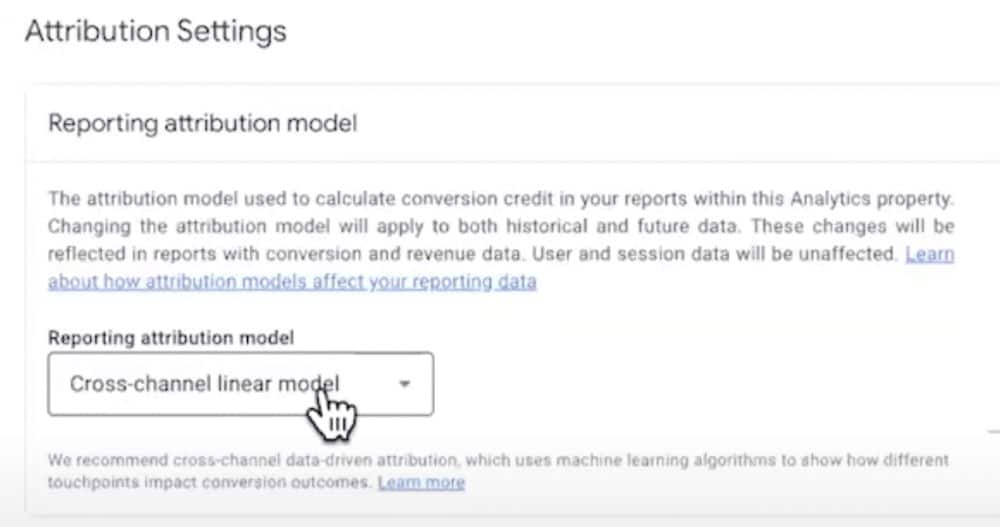
Within attribution settings, we can now pick an attribution model. In the past year, GA4 began to use data-driven attribution by default. Rest assured, any changes you make will not permanently alter any of your data. All of the core data is unaffected, you can make changes as many times as you’d like.
Finding the data from your data-driven attribution model
Let’s imagine that you’re using the data-driven attribution model as your reporting attribution. But where can you go to access the information that you’re gaining from this model?
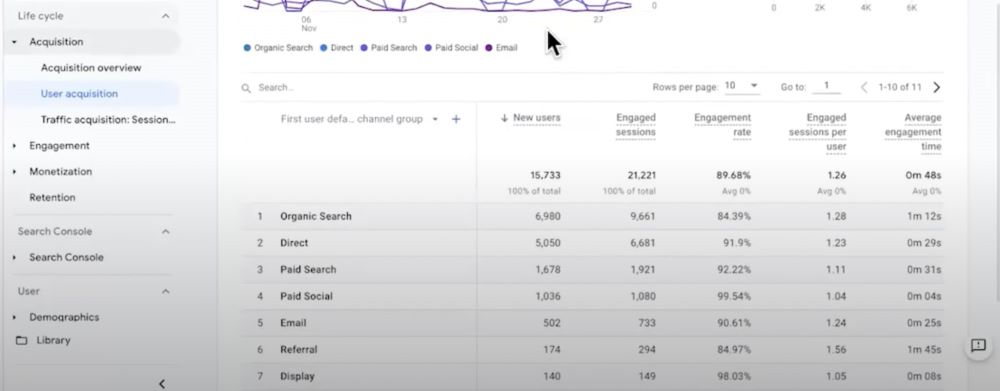
First, you might go to your user acquisition report. Looking at the image above, is this a data-driven attribution? The answer is no. This is the user acquisition report, meaning it is using a first-touch attribution model.
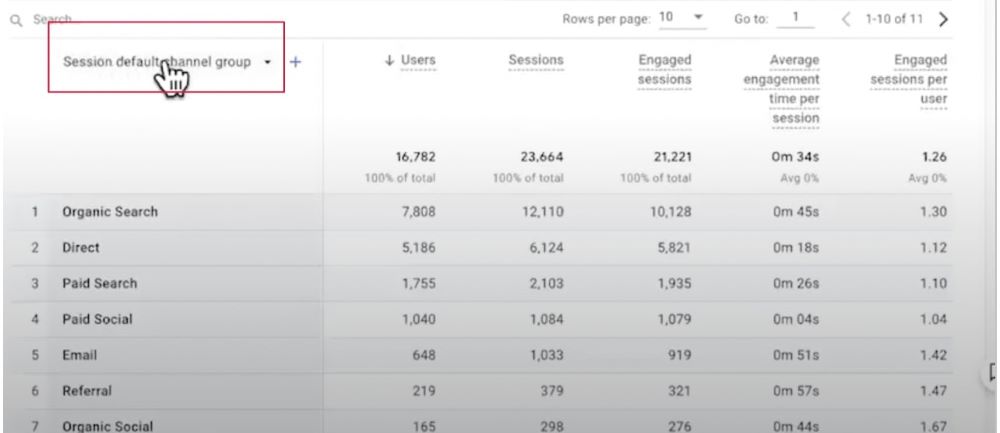
Next, we might try the traffic acquisition report. If we look at the dimension, we can see that it’s called ‘Session default channel group’. Again, is this a data-driven attribution model? Again, the answer is no.
We would know if this was a DDA by looking at the numbers. We would see fractions or decimals. In the image above we see only whole numbers. This is a non-direct attribution model at a session level. In other words, similar to what Universal Analytics was doing.
But if neither of these reports are data-driven attribution, where can we find our DDA data?
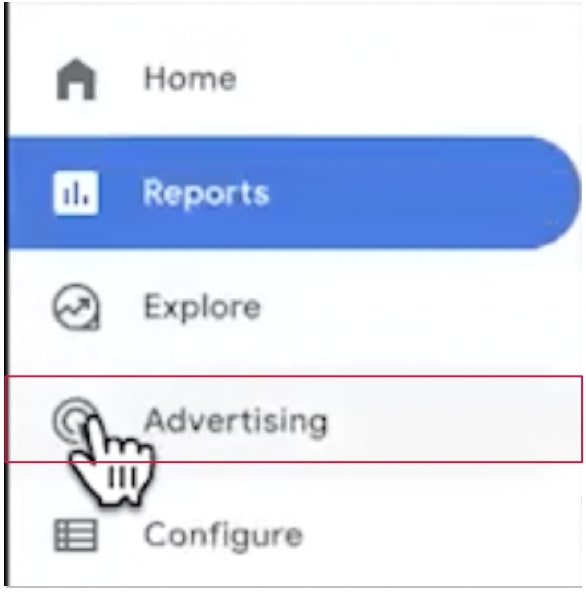
There are two places we can go. The first is in ‘Advertising’.
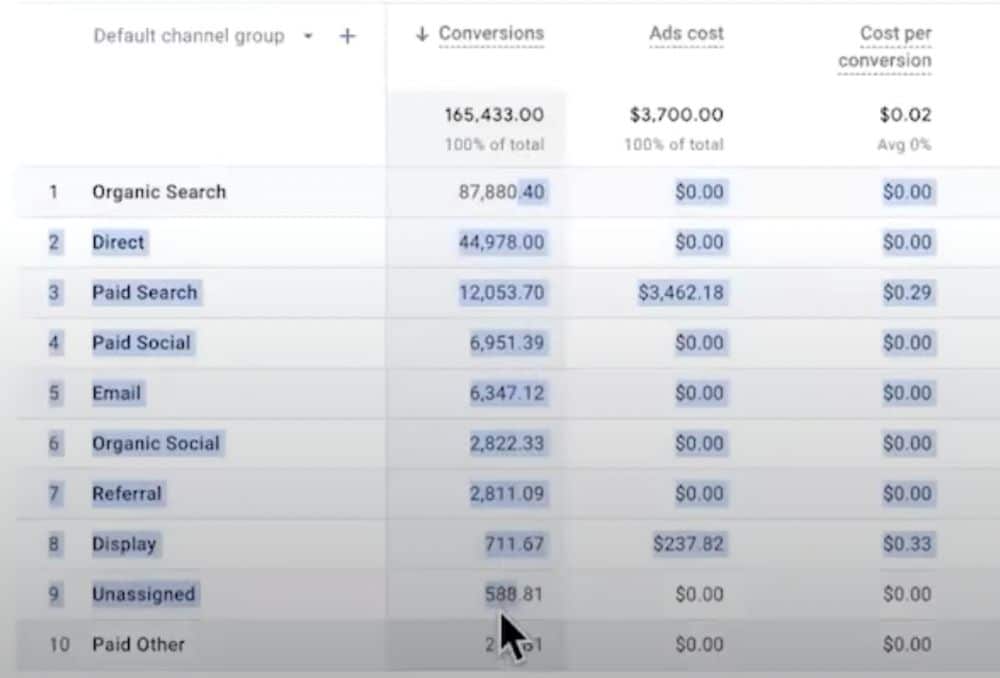
Here we can find attribution reports – immediately we can see that our reports contain fractions.
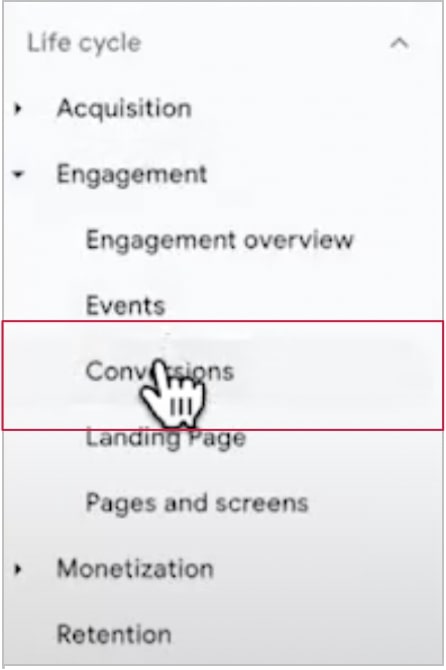
The second place to find our DDA model is in Engagement>Conversions.
Is this a data attribution report? Almost, but not quite. You’ll see that we have decimals, but each ends in zero. This will only be a DDA report if we click on an individual event.
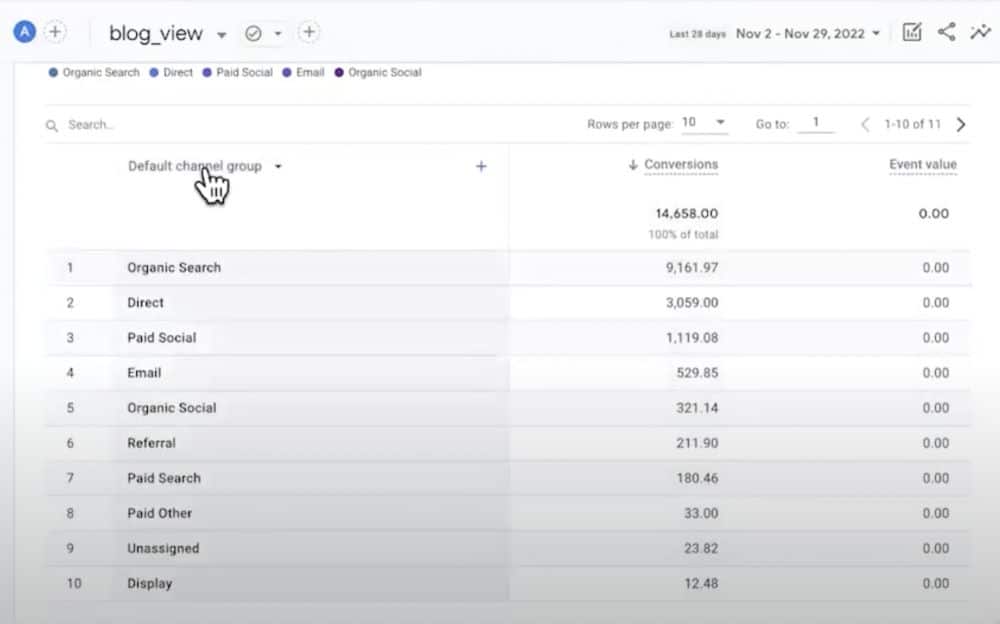
The image above shows data after clicking a blog_view event. You’ll notice that we have numbers after the decimal point. This means that we are now looking at data-driven attribution.
Exploration
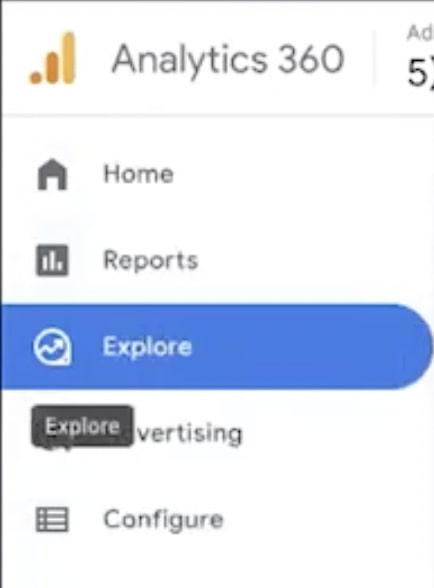
To illustrate the above points more clearly, let’s go to ‘explore’ from the GA toolbar.
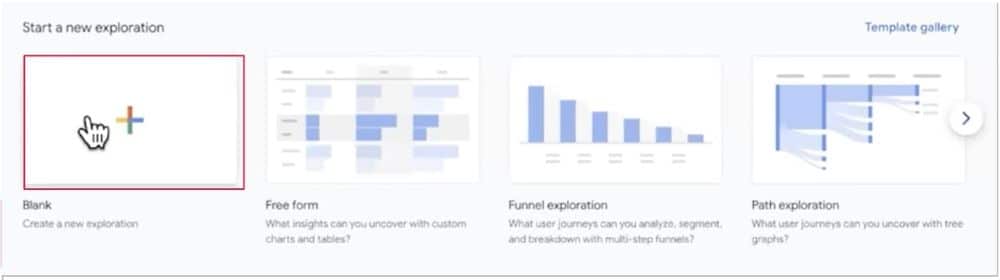
The Explore area is one of the most important parts of GA4. From the menu, let’s choose a new blank exploration.
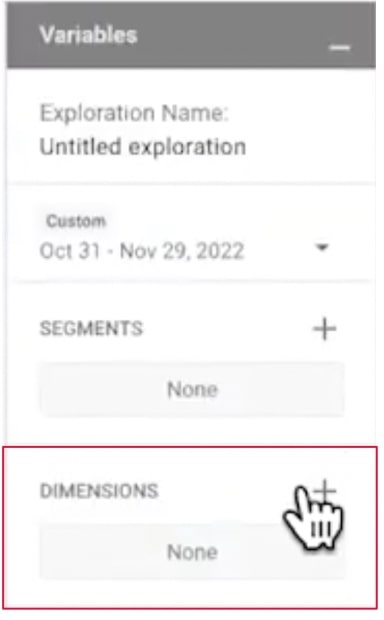
From the following screen, choose ‘Dimensions’.
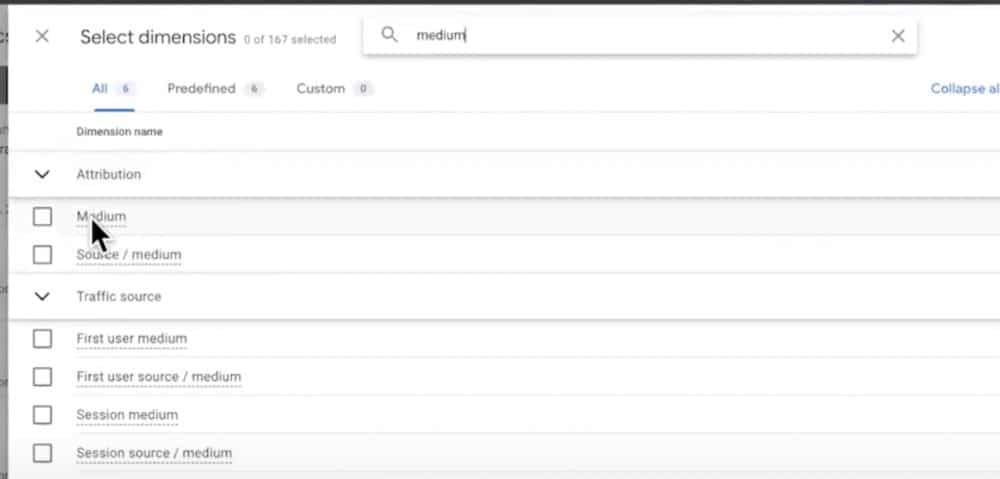
If we search for ‘medium’ we get the results seen above. At the top, we can see the attribution, and below, the traffic source, which includes the user and the session scope.
If you’re trying to use a flexible attribution in GA4, just make sure that you are always looking for event-scoped options. These will usually be called campaign, medium, or ‘source. If you’re using first user, know that it’s first touch.
If you see session in front of anything, know that this is the last non-direct component. Let’s imagine that you have a session with three events.
- Someone came to your homepage from a paid ad.
- Immediately after, they searched on Google for something else. They then clicked on an organic result and came back to your site.
- Later on, they return to your site from a mail link.
In a session scope, only the first event would get credit. The only way to see all three sources is by using the medium dimension for your attribution.
How to avoid confusion with attribution
To avoid running into confusion, start building some knowledge around the three different scopes. Make sure if data is being shared across your organization, that you apply a lot of scrutiny to ensure the right dimensions are being mixed with the right metrics.
Changing the attribution model everywhere in GA4 might have seemed exciting, but after diving in, you’ll find it more limited than you would think. Remember, it’s only applying to a specific set of reports and dimensions.
Standard reports vs. explorations
There are two distinct areas of Google Analytics 4, the standard reports, and explorations. A lot of people don’t realise that different parts of GA4 pull from different data sources.
If we head to our events reports, we see a set of standard events and metrics. If we go on to customise this report, we could apply a conversion instance.
But if we head to our explore reports, and start building a report from scratch, there are different sets of dimensions and metrics.
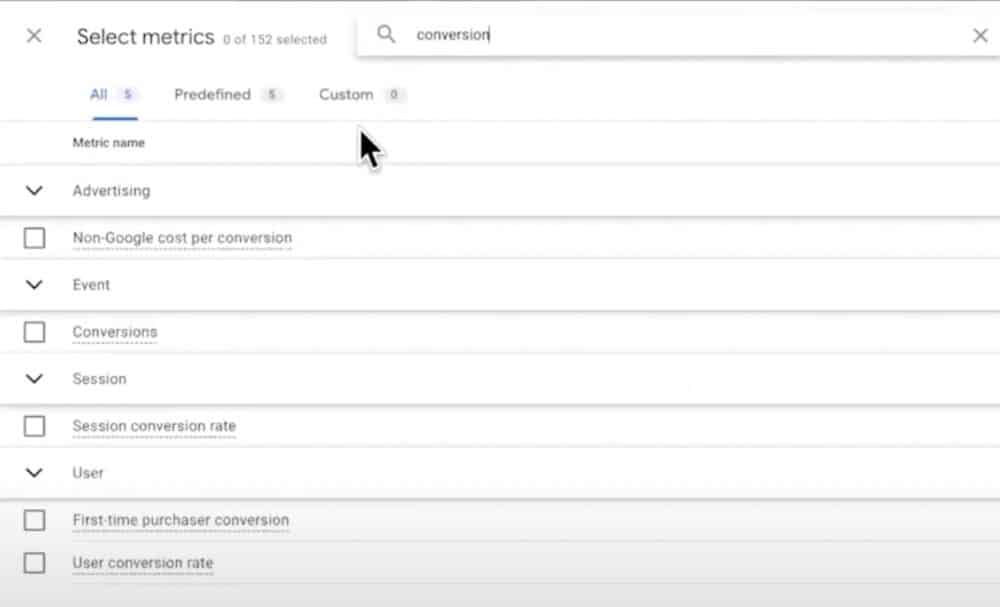
For example, here is a search for ‘conversion’. You can see that we have ‘Session conversion rate’ and ‘User conversion rate’, but we don’t have an individual conversion rate. This means that we can’t report on individually unique events like forms or downloads. In other words, we can’t easily create reports for individual conversions.
Data Studio
Data Studio uses data from standard reports rather than explorations. Unfortunately, this means the standard data reports in Data Studio are extremely limited. Instead, it’s useful to spend as much time as possible in explorations for reports.
Wrapping up
As you get deeper, there’s a whole new layer of learning GA4. It’s important to ask questions about the data that you’re looking at. Pay attention to your user identity, make sure you’re paying special attention to attributions, and start building familiarity.
Know which parts of GA4 you’re pulling data from. By doing so, you’ll build better reports and make the most of GA4’s advanced features.
Further reading
Want more? Check out our blog for tips on Google Analytics, as well as a whole host of other Google packages.
About Charles Farina
Charles is an analytics specialist with deep experience in the Google Marketing Platform (Google Analytics 360, Tag Manager, Data Studio, etc.).
He has provided hundreds of training and public speaking sessions on Analytics for universities, Fortune 100 companies, and conferences. He has focused primarily for the last few years on business development and new growth initiatives.

- Top 24 Google Analytics Chrome Extensions & Sheets Add-ons - 21/05/2026
- Best Consent Management Platforms (CMP) - 19/05/2026
- Google Signals and Consent Mode: What This GA4 Change Really Means - 23/04/2026
I thought GA4 used last non-direct click on user and session level?
Attribution depends on 3 things:
The property level default attribution setting (the default is data-driven)
The definition/dimension used:
– First source/medium (first non-direct user)
– Session source/medium (last non-direct session)
– User source/medium (last non-direct user)
The report selected – which can be event/session/user-scoped attribution such as Advertising >> All Channels Conversions or Engagement >> Event Drilldown
GOOD article