Google Analytics (GA3) Universal Analytics Legacy Guide

Welcome to our legacy guide on Universal Analytics (UA), unofficially referred to as Google Analytics 3 (GA3). Here we’ve collated the best posts and guides related to UA into one mega-post.
Contents
- An Introduction to Google Analytics (GA3) Universal Analytics
- GA4 vs Universal Analytics: What’s the Difference?
- How Google Analytics 4 Will Replace Universal Analytics
- How to Backup Universal Analytics Data Easily
- How to Backup & Visualize GA3 Data for Free


Phil Pearce
First published December 8th, 2021
An Introduction to Google Analytics (GA3) Universal Analytics
In this article we will be discussing Google Analytics 3 (GA3) otherwise known as Google Analytics. If you would like to learn more about Google Analytics 4 (GA4) then you can go to our Google Analytics 4 guide. Think of this article as a Google Analytics for beginners guide.
One of the first things that you will want to do on a brand new website is set up a tool to collect important metrics like the number of people who are visiting your site. There are many online tools that let you do this. By far the most popular is Google Analytics.
Much of the content that you will find online about Google Analytics contains complex jargon that is aimed at people who have been using the tool for a while. This introduction to Google Analytics will provide a beginners’ overview of the platform. It will cover how Google works and provide information on the type of insights that Google Analytics can provide. That’s whether you’ve used one of the available website builders to knock up your first ever site, or own an established domain.
What Does Google Analytics Do?
Fundamentally, all Google Analytics does is provide you with information regarding the actions taken by a person visiting your website. The information it can collect covers everything from the really general stuff like which website they came from – for example Facebook or Google – through to very specific metrics like how much of the content on a page visitors viewed.
Google Analytics processes all of this data and turns it into reports, with graphs and stats that you can analyze. A lot of people will only ever use the main reports the tool generates, which is fine. In this sense, Google Analytics is a very simple solution. Where Google Analytics gets complex is when it comes to the advanced functions that experts can use to collect additional insights.
The next few sections of this guide will cover in a bit more depth how Google Analytics collects data, how the data is processed, and the kind of reports you can get access to. There will be a couple of technical terms, but we’ll do our best to explain them.
Collecting Data
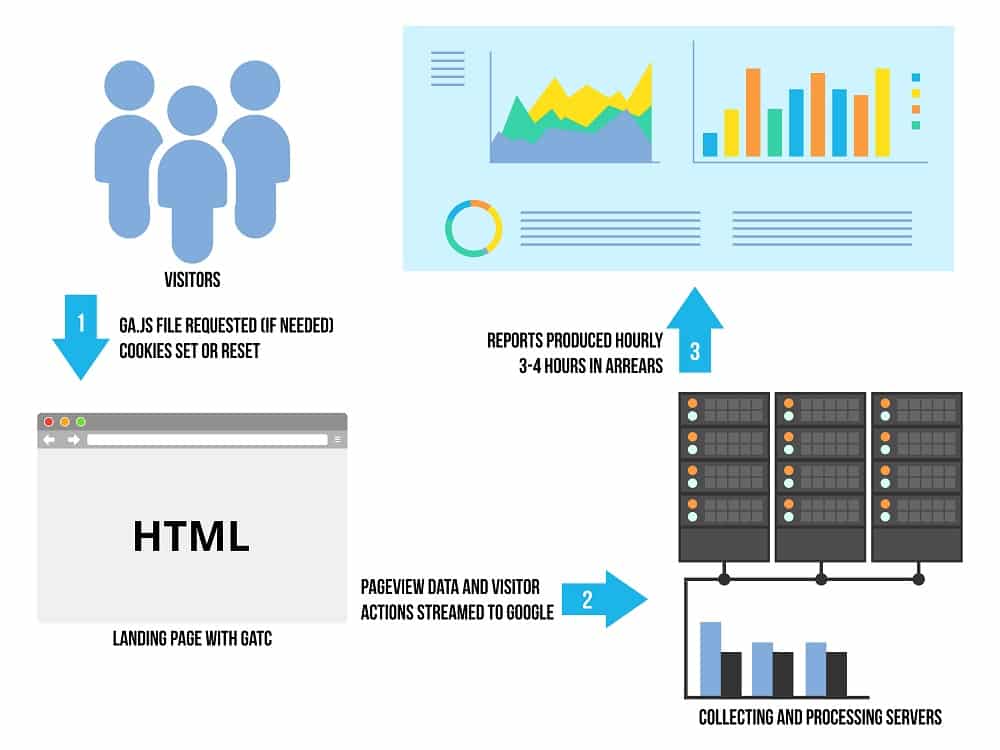
As mentioned earlier, Analytics gathers data about visitors to your website. It records things like how many visitors you get and what they do on your site. What lets it do this, is a small piece of code that you add to your site. You need to add it to every page, but we’ll cover this in more detail in a later post.
The code enables Google Analytics to drop a cookie in the browser of each site visitor. The cookie is what lets Analytics track what the visitor does on your site. Each time a person does something on your site the Cookie tells Google Analytics.
These actions are called a hit. There are three main types of hit involved with using Analytics:
- Pageview Hit – This is the most common. It’s sent to Analytics when someone visits a page on your site. It will contain information like which page is visited. As well as which browser and device the visitor is using.
- Event Hit – These are sent when a visitor performs a certain action on your site. That might be playing a video, clicking a specific link or filling in a contact form.
- Ecommerce or Enhanced Ecommerce Hit – These are hits to do with making purchases. They tell you what products get purchased. They can also record the pages visited before a customer bought a product.
When you review the type of hits Google Analytics can collect you get a sense of the information that you can access through the tool. So that’s how Google Analytics collects data.
Processing Data
The data provided by the hits mentioned above, is then processed by Google Analytics. One of the first things the tool does is to arrange the data by users and sessions.
As you might expect user data concerns an individual visitor to your site. When someone visits one of your pages, Google Analytics creates a random and unique tracking code for them. This happens the moment a person arrives on your site.
The time that a user spends on your site before leaving is called a session. When a person leaves your site the cookie is left in the browser. If they return later on, then Google Analytics will recognize that this is a return visitor rather than a new visitor.
During a session, Google Analytics can collect information based around each of the three main types of hits (pageview hits, event hit, ecommerce hit), and more. This will provide information like time on site, how many pages they viewed, and plenty of other insights.
Each user session on your site ends after 30 minutes of inactivity. The point of session data is to give you an insight into what visitors do on your site. If a user returns to your site within 30 minutes, their activity is counted as part of the same session.
How Analytics processes data is a little more complex than that. Or at least, there are other elements involved. There’s no real need to drill down too deeply at this stage. Once you’ve got your head around users and sessions, you can start thinking about the reports Analytics provides.
Generating Reports
Reports are how Google Analytics presents you with the data that it collects and processes. At the most basic level, they’re tables and graphs to help you make sense of the data. Every Analytics report combines dimensions and metrics.
- Dimensions – This is information about the user. For example, a common dimension is what city a person comes from, or what device they were using when they accessed your site.
- Metrics – This is the number of something. For example, the number of visitors to your site or the amount of time people spend on average on your site.
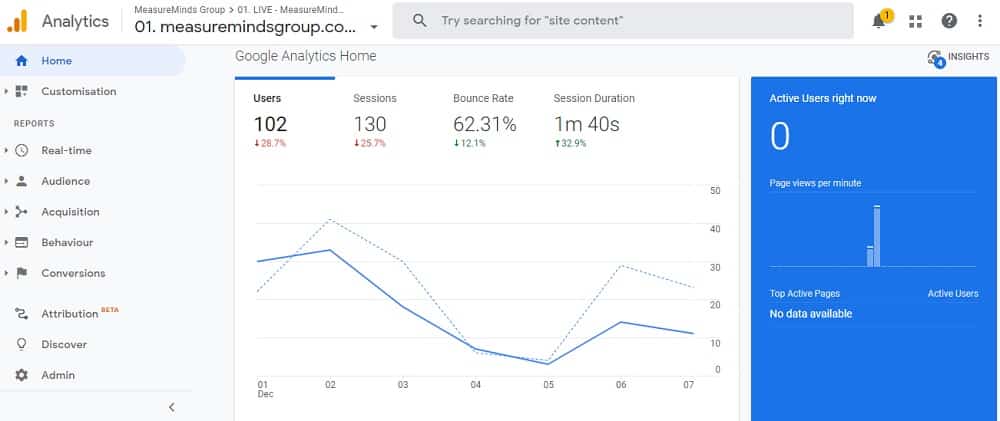
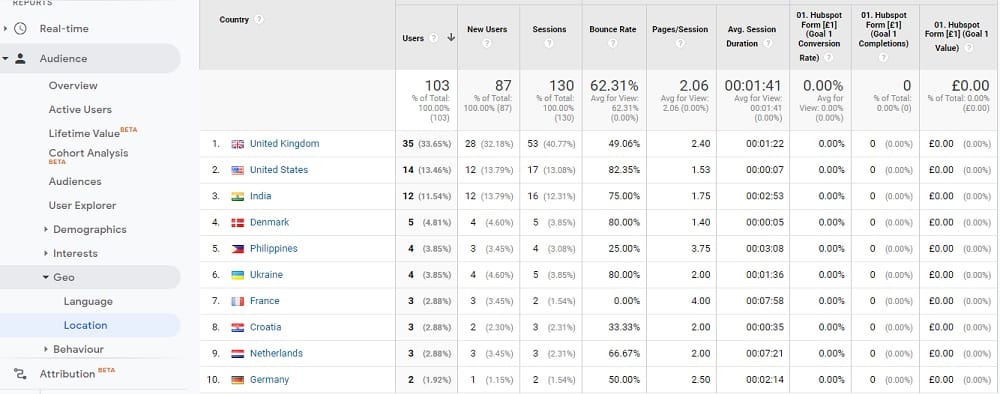
On Google Analytics, reports displayed as tables almost always list dimensions in rows and metrics in columns. For instance, a report combining ‘City’ and ‘Sessions’ might look like this.
By default, Google Analytics will provide you with a set number of standard reports that combine dimensions and metrics to provide you with insights into your website. If you choose to, you can create your own custom reports that combine dimensions and metrics in different ways.
Hopefully, at this point, you should have a good overview of how Google Analytics works and the kind of information you can access through the dashboard. Let’s now turn to how you can use this information.
What Can You Use Google Analytics For?
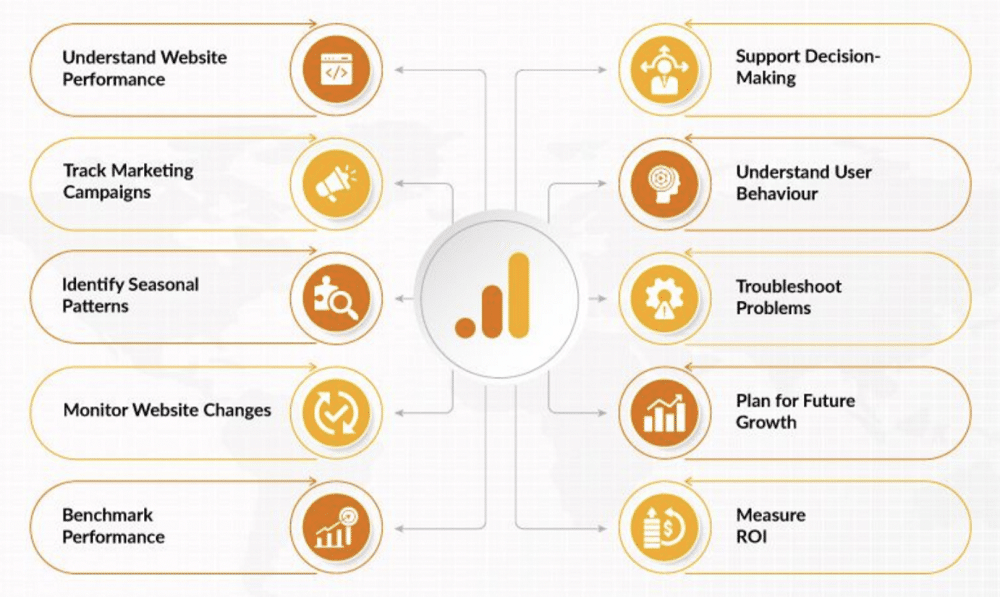
Google Analytics can provide you with insights into the performance of your website. The best way to offer you the kind of insights you can get is with a handful of examples. The following are some common insights that Google Analytics can offer. They’re simplified examples but should give you an idea of how valuable a tool it can be.
How’s Your Marketing Working?
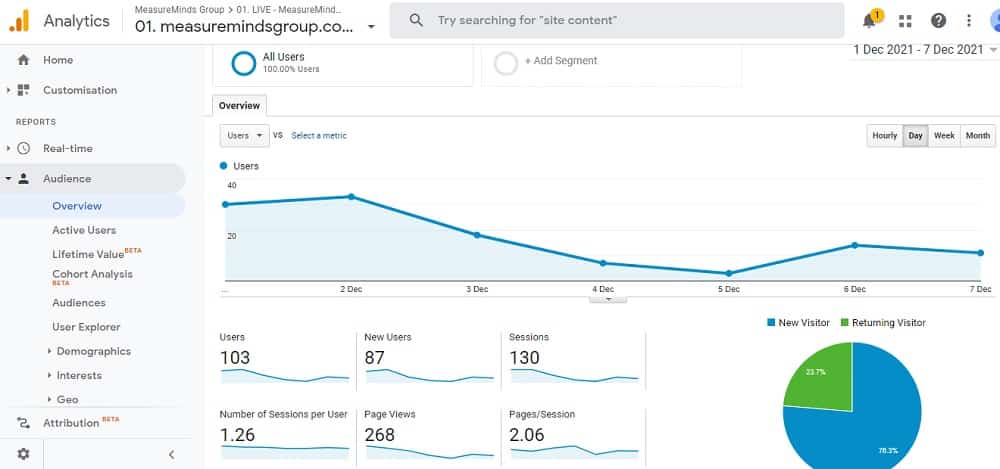
Analytics is crucial for understanding how well your different marketing efforts are working. For example, you can view Analytics reports that display the site which a person came to your website from. By default, Google Analytics will helpfully group traffic by source.
The three traffic sources you want to pay most attention to are:
- Organic Search: This is how much traffic you are getting from a search engine like Google. The more traffic you are getting the better your SEO is performing.
- Referral: This is where someone came from a different website to yours. If you are getting traffic from a site then they are linking to your content. It might be worth making friends with that person.
- Direct: This is where a person enters your website name and goes straight to your website. Generally, when you are getting a lot of direct traffic it means you are offering a great service or producing good content.
- Social: These visitors are coming from social media like Facebook, Twitter, etc. If you are getting a lot of followers on social media then you have a good social media strategy.
Below is an example of a report. You can see how dimensions and metrics are used in the report.
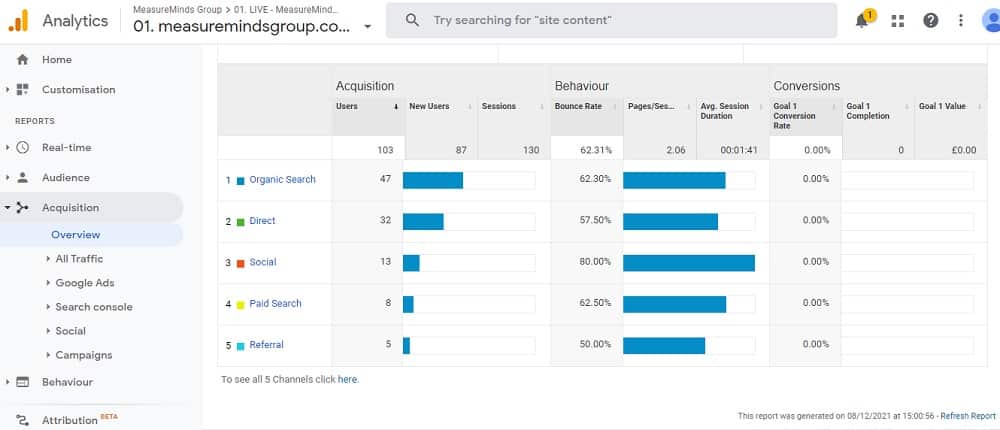
You can break each of these groups down and look at the individual sources. For example, by clicking on referral you would be able to see each individual website that a visitor came from.
By analyzing this information you can gain insights into the effectiveness of your marketing. You can see what is working for you, and prioritize channels on which to focus.
What Parts of Your Site Do or Don’t Users Like?
Tracking user behaviour on your site can also be really useful. Ensuring top-notch customer experience is a priority for all modern businesses. There are a lot of ways you can use Google Analytics to improve the experience your website visitors have. One of the simplest ways of doing this is analyzing time on-page.
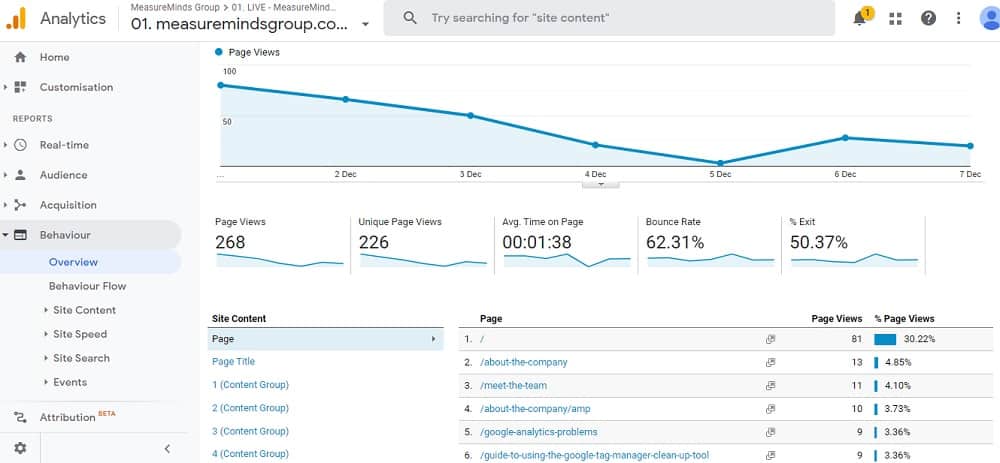
The average time on a page is a good guide to how interesting or useful the content on that page is. If people spend more than one minute on average on a page it’s a good sign. It means that people think the content is useful. If, on the other hand, the time on the page is very low – say 12 seconds – you can assume the information on the page is not useful.
You can use this information to identify content on your site that needs to be improved. Making updates based on these insights will help you provide a better experience for your users. This is just one way that you can use the information Google Analytics provides to analyse what people like or don’t like on your site.
Is Your Site Good at Converting Visitors Into Customers?
Google Analytics also lets you track goals and conversions on your site. A later post will get into this in a bit more detail. At the simplest level, it means you can assess how well your site performs in guiding a visitor through to a sale. Or another action that you want them to take.
You can see and analyse how visitors move through your site, toward your goal. You can then pinpoint the stages along the process where you lose visitors. With that information, you can work to make the process more efficient.
Conclusion
You should now have a good idea of how Google Analytics works. You will hopefully also have some ideas about how you might benefit from using it. This post was just the start of a series focussing on Google Analytics. In the future instalments, you’ll learn more about using the service, and how to get it working for you.
GA4 vs Universal Analytics: What’s the Difference?
Phil Pearce
First published June 29th, 2022
An estimated 30-50 million websites are taking advantage of GA. That’s because good digital analytics is essential for producing the most targeted and effective marketing. And as Google starts to close the curtains on Universal Analytics (UA) and introduces Google Analytics 4, we need to stay up-to-date. Which begs the question: GA4 vs Universal Analytics, what’s the difference?
Why is data analytics important?
This might seem like a stupid question. Data analytics is now commonplace for businesses across the world. But if you’re a new business or a business that is moving online for the first time, you might not know the answer.
Effective data analytics is what separates the good marketing campaigns from the bad. We no longer have to guess the sort of marketing materials that might appeal to a specific demographic or audience. And that’s all thanks to Google Analytics. GA lets us learn very specific information about individual users at the click of a button. We can learn a user’s demographic, country of origin and even the content that they lingered on.
This information can then go on to build wider user profiles that can then be used in your marketing. Data analytics make the crutch of most modern advertising campaigns. Have you noticed that the advertising you see online is directed to products or services that interest you? Well, this is a result of analytics and remarketing.
Analytics is quickly becoming an essential part of running a business. Studies show that 71% of consumers feel frustrated when a shopping experience is impersonal. Now, more than ever, people like content to be tailored to them. If you don’t take advantage of this, you can bet your competitors will. By choosing the most up-to-date analytics software you can keep ahead of the game.
What’s the difference between Google Analytics and Google Analytics 4?
Well, nothing. Google Analytics 4 is simply the name for the newest version of Google Analytics. The end.
Joking! To properly understand why GA4 is different to what preceded it, it’s important to have an understanding of how the software has evolved over time.
A timeline of Google Analytics
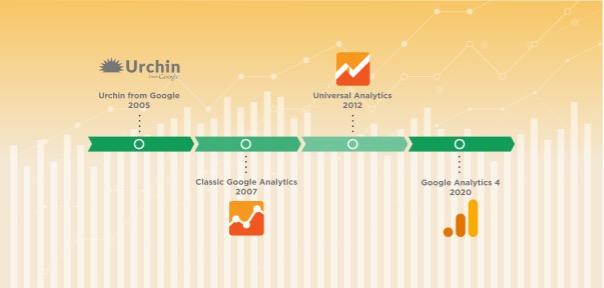
Urchin from Google – (March 2005)
It all began when Google bought Urchin. Urchin was a web analysis company delving into innovative ways of learning about traffic online. It would become the first version of Google Analytics. It lasted until 2012 when it was discontinued in favour of the later version of GA, Universal Analytics.
Key features:
- An insight into the number of visitors that came to a site each day.
- The global location of traffic.
- Insights into new and returning visitors
- The ability to track the effectiveness of web traffic campaigns.
- The Source of web traffic.
Classic Analytics – (May 2007-2016)
By 2007, Google decided that it was time for a revamp. Introducing ‘Classic Analytics’. Classic was a more robust option of GA. It built on many of its predecessor’s features. As with Urchin, Classic Analytics was eventually discontinued, being merged with its successor in 2016.
Key features:
- The opportunity to track e-commerce transactions
- Greater customisation features.
- A more accessible display.
- The ability to analyse subsets of traffic.
- The option to create custom reports in order to better organise data.
Universal Analytics – (March 2012-2023)
In 2012, Google decided that it was once again time to make a change to its program. Introducing Universal Analytics. If you’ve used GA before, this is probably the version that you are most familiar with. As with Classic Analytics, Universal Analytics brought a whole range of features to the table. Although it will be discontinued in 2023.
Key Features:
- New tracking codes to provide more data about users.
- The ability to track the same user across different devices.
- Integration with Google Ads.
- An improved User Interface.
- Real-time reports to better understand user behaviour.
How has Google Analytics 4 changed things?
![]()
![]()
Despite all the changes and innovations that had driven Google Analytics, Google was still not fully happy. In late 2020 they launched Google Analytics 4. It’s fair to say it has shaken things up quite dramatically.
If you have set up Google Analytics 4, you’ll know that Google fundamentally changed the ways in which data was collected. Now, each user interaction was classed as an ‘event’. With GA4 you can program custom events. This means that you can set specific parameters on your site for measurement. This basically gives you the power to measure any area you like, from downloads to page scrolling.
Alongside events, GA4 improves on mobile tracking. With GA4 it gives you the option to track users visiting from mobile and other devices. This provides a 360 ° view of your customer’s actions.
So, in essence, GA4 isn’t a new program. It’s the latest effort in the long process of improving Google’s data analytics package.
The differences between GA4 and Universal Analytics
There’s a long list of benefits of Google Analytics 4 that make it better than Universal Analytics. However, change can be something to be wary of. But don’t panic! Universal Analytics isn’t going anywhere anytime soon. In fact, Google currently advises running it in tandem with GA4.
Different data measuring models
With Universal Analytics, interactions were measured based on sessions and page views.
GA4’s new model means that any user interaction that takes place on your site is automatically categorised as an ‘event’.
Google has broken events into 4 different categories:
Automatically collected events
These events are activated by basic interactions with your app or site. They’ll start being tracked as soon as you install the GA4 base code on your site. Most automatic events don’t need additional code. These events include:
ad_click: When a user clicks an ad. (app only).
first_visit: The first time a user visits a website or launches an Android instant app with Analytics enabled.
in_app_purchase: When a user completes an in-app purchase, including an initial subscription, that is processed by the App Store on iTunes or by Google Play. (app only).
Google provides a list of automatically collected events.
Enhanced Measurement events
These events allow for the measurement of interactions with content from within the Google Analytics interface. Google recommends that before activating Enhanced Measurement, you are clear on the sorts of data that will be collected. These events include:
Scrolls: The first time a user reaches the bottom of each page.
Video engagement: When a user views a video.
Site search: Each time a user performs a site search, indicated by the presence of a URL query parameter
Recommended & Custom events
Google has also compiled a list of recommended events for your site or app. To save you time that would otherwise be spent scrolling, Google has categorised each event by industry. These cover:
- Retail/Ecommerce
- Jobs, Education, Local Deals, Real Estate
- Travel (Hotel/Air)
- Games
Google has also implemented custom events. These are arguably one of the biggest features of GA4. They can be based on whatever metric you decide. Currently, Google limits us to 500 events for each Google Analytics property.
You can connect Google Analytics 4 to BigQuery
![]()
![]()
If you’re a big business dealing with lots of data, this one is for you. And this is definitely one of the biggest benefits of GA4 vs Universal Analytics. The best part is that connecting GA4 with BigQuery is completely free. It used to cost $150,000 to buy GA360 in order to access this feature.
What is BigQuery?
You’re likely gathering data from all kinds of places. Be it your app, website, email or marketing campaigns. Sometimes, it means you’re gathering lots of data from a variety of locations worldwide. With all these data sets, you need a location to store everything.
This is probably going to blow a hole in your budget. You’re not just paying for the location but maintenance and security. There’s also the issue of processing all of this data. Sometimes an analytics report can take days to formulate. That’s time you could have spent improving your marketing campaigns and growing your brand.
Google Analytics 4 is more noob friendly
Although you may have heard a lot of backlash online about GA4. This is usually from advanced users complaining about missing features. Which is totally justified. We will be writing an article about the missing features of GA4.
However, if this is your first delve into analytics, it can be quite daunting. The amount of information can be difficult to handle. But with GA4 vs Universal Analytics, there are more built-in features that can help you find information about website users.
There are also a huge number of custom settings that you can apply to GA4. The good is that you don’t have to implement these if you don’t want to. GA4’s automatic reports provide you with a wealth of data, custom settings only enhance the data that you’re receiving. So for the standard user GA4 tends to be easier to use.
Google Analytics 4 builds on old technologies
Although Google Analytics 4 only arrived in 2020, Google had been laying the groundwork many years prior. GA4 was built on the back of a few different technologies developed by Google. The utilization of these technologies make some significant differences between GA4 vs Universal Analytics.
Google Signals
Dealing with ‘anonymous’ users will be something of a pet peeve for many website owners. Anonymous users are people that have not entered any identifiable information onto your site or have not agreed to your cookie consent banner.
Being able to identify these users and include them in your analytics reports is essential for good data. It’s now possible to use Consent Mode with Google Signals to upscale conversions. That way, conversion data that would ordinarily be missing when someone rejects your cookie banner, is now made up for with upscaling. This is a huge win for GA4 vs Universal Analytics. We have an article more about this and other GA4 features.
Firebase Analytics
Over the last ten years, people on average have acquired new devices and ways of getting online. This has presented a problem for businesses that operate online. When people own so many devices, they are likely to access your website from different sources. In fact, Google themselves found that 90% of people switch between screens to complete tasks. This includes using an average of three different combinations every day.
How can we track the same user across different devices? Firebase Analytics was Google’s attempt to answer that question. The program helped to better track returning users from different devices. Firebase introduced the idea (now found in Google Analytics 4) that each user interaction would be classed as an individual event.
When should I make the switch to Google Analytics 4?
Ideally, as soon as possible. Google Analytics 4 is packed with features that can improve your digital analytics. GA4 features more customization than ever. It’s got better data collection and deeper integration with other services than ever before.
Universal Analytics discontinue. So get in early with GA4 so you can be a set ahead of your competitors.
Get ahead with Google Analytics today
So, as we’ve established, there is no difference between Google Analytics 4 and GA. Rather, GA4 is the latest result in Google perfecting its analytics formula. If you’re not using analytics on your website or app, there’s no better time to start than today.
Every day spent without effective analytics, is a day falling behind your competitors. With the right data, you have the potential to transform your marketing and your business. Put simply, there is no path to success for a business online without the right data.
Beat the competition
![]()
![]()
It is easy to see the importance of good data management. It would be understandable, however, if this still seems quite daunting. We have helped many businesses, in sectors from banking and Local Government to healthcare, to navigate the hurdles involved and deliver real benefits to their organisation. We would love to help your business to thrive.

How Google Analytics 4 Will Replace Universal Analytics
Phil Pearce
First published March 23rd, 2022
The time is nigh! The Google Gods have once again stricken us with some pretty heavy news. This time with the execution date of our old, dear friend. We all knew Google Analytics 4 would replace Universal Analytics. But now we have an actual date for it, it just all seems a bit too real.
So, naturally, we wanted to exploit the death of our friend by creating a great article explaining what businesses should do to prepare.
When Will GA4 Replace Universal Analytics?
I suppose this is a good place to start… Russell Ketchum, Director, Product Management, at Google Analytics says that GA4 will replace UA on the 1st of July 2023. GA360 Universal Analytics properties will meet their end on the 1st of October 2023. That’s 11 years after UA was created and about 1.3 years from when this article was written.
How Will GA4 Replace Universal Analytics?
Admittedly, I’m being a bit doom and gloom. I keep referring to this as the death of UA. Although, essentially, there is no migration path, only the option of a fresh GA4 account.
On the dates listed above, new GA3 hits will stop being processed and no data will be processed for those properties. Hence GA4 is a replacement, not an upgrade.
After those dates, you will have 6 months to access historic data.
How to Know if You’re Using a Universal Analytics Property or GA4 Property
GA4 was released on the 14th of October 2020. It was also made the default when you created a new property. With that in mind it’s probably safe to say the following:
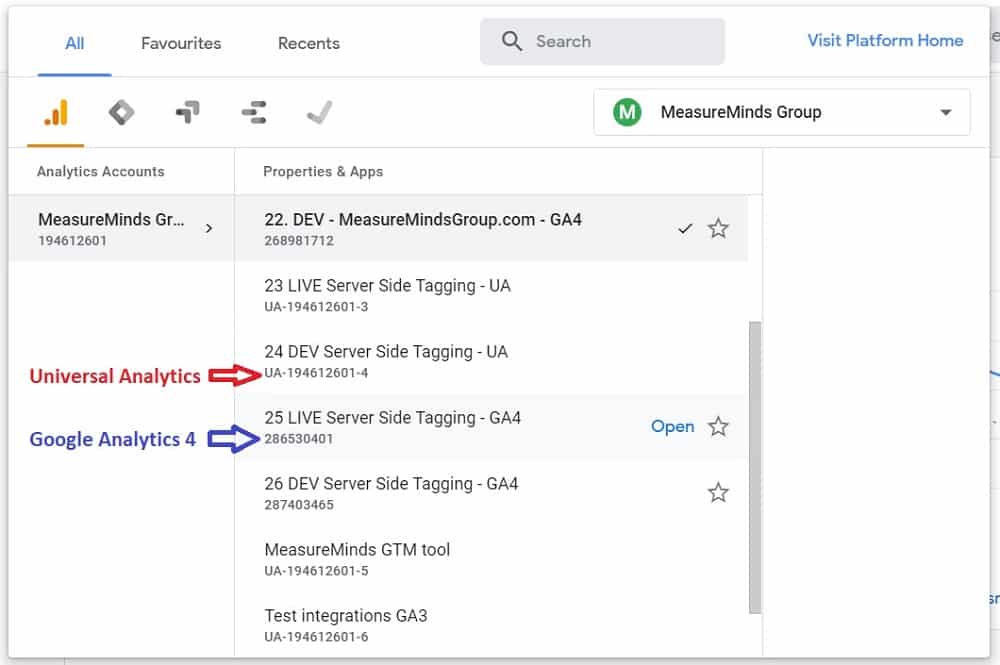
If you created your GA property before the 14th of October 2020, you’re probably using Universal Analytics. If you created your GA property after that date, you’re probably using Google Analytics 4.
If your accountID is UA-xxxxx-x then it is GA3 (Universal Analytics), if it is G-xxxxxxxx then it is GA4.
How The Change to GA4 Will Effect Your Business
If you’re already using GA4 and GA4 only, then this change will have no effect on your business at all. However, if you’re using Universal Analytics, this could have some significant effects on your business.
You Will Stop Receiving New Data on UA Properties
If you continue to use UA, you will stop receiving data after the 1st of July 2023. This is pretty significant. You obviously don’t want to miss-out on valuable marketing data after that time. So you need to make sure you set up Google Analytics 4 before then.
How This Will Effect Your Google Ads Campaigns
If you are using GA3 goals or transactions imported into Google Ads, then these will stop working after the 1st of July 2023. This will mean:
- UA site metrics such as bounce rate will disappear
- Remarketing audiences will stop adding new users
- CPA bidding on goals or transactions will start underbidding
So again, it’s highly recommended that you migrate to GA4 and then link your Google Ads Campaigns to your GA4 account instead. You should then:
- Import GA4 conversions for bidding
- Disable GA3 conversions to prevent double-counting
- Add GA4 audiences to a campaign or Ad group for remarketing
How to Ensure That You Don’t Have Any Problems During the Switch to GA4
- You should add a GA4 pageview straight away and run this in parallel with UA so that you start building historic benchmark data. Just remember to add GA4 goals.
- For new GoogleOptimise tests, you should use this new GA4 property.
- Once you have 30 days of data then switch your DataStudio dashboards to use GA4 as a data source. I suggest duplicating DataStudio dashboards so you have a backup to compare GA3 vs GA4.
- Start building your GA remarketing audiences as these will reset as part of the migration. So the sooner you add GA4 the better.
- Also, remember to link GA4 to Google Ads and switch the goals to use GA4 goals instead of GA3.
How to Migrate to GA4
So we’ve definitely established that migrating to GA4 from UA is something you need to do! But how do you do it? We’ve already created a really great guide on how to do this:
So please click through and follow that guide if you haven’t already. Although there are some other things to consider during this migration.
Export Your Universal Analytics Data
Definitely export your Universal Analytics data. I recommend doing this any time up to the day before new hit data will stop being sent to UA. That means exporting your data on the 30th of June 2023. I say the day before, just to be safe and to not have any gaps in your data in case the overlap isn’t crystal clear.
You have to remember, you can still run GA4 alongside UA. So it doesn’t really matter when you export the data, as long as it’s before the date that new hit data will stop being processed for UA accounts. Currently, there are a few ways to export your UA data.
One option is to export individual reports into any of the following formats:
- CSV/TSV
- Excel (XLSX)
- Google Sheets
Alternatively, you could export the data via the Google Analytics reporting API.
Why Google Analytics 4 Will Replace Universal Analytics
If you’re an analyst or an avid GA and GTM user, you probably have some mixed feelings towards GA4. We do too. But whether we like it or not, Google Analytics 4 will replace Universal Analytics. We actually have quite an optimistic view of the future with GA4. But before I get into that, I want to discuss the underlying reason why Google are making this substantial change.
The Move Towards Cookieless Data
Ultimately, UA was built for cookies. But as we transition away from cookies to remain GDPR compliant in the face of the ever-changing privacy landscape, we need to look at new ways to capture and analyse data. GA4 doesn’t rely exclusively on cookies and instead uses an event-based data model that can operate across platforms.
Essentially Google Analytics 4 has been designed with privacy as a focus. Here are a few ways it does that:
- GA4 anonymises IP addresses by default
- Supports consent mode and ability to upscale cookie-based sessions & conversions using a new cookieless sampling pixel. This is important when you consider what happened to Facebook on iOS when Apple forced Facebook to change from a 100% opt-out model to a 10% opt-in model. Thus 90% upscaling using a sampling pixel is a critical feature to maintain conversion benchmarking.
- Has better user-deletion data control and the ability to set regional controls
Amongst others…
We’re currently writing a blog post on the benefits of GA4 and we’ll talk about everything in a bit more detail then. But here are a few key benefits.
GA4 Uses Better Machine Learning to Provide Automatic Insights
Universal Analytics, bless its cotton socks, did have some machine learning capability that allowed it to provide some really cool insights. But GA4 just uses better machine learning models that will provide users with better alerts to a broader range of trends in your data.
This may help us better understand our customers and their demands. Furthermore, it will allow us to paint a clearer and more intricate picture of which customers are more likely to convert. Which in turn allows for better targeting.
GA4 Integrates with BigQuery for free
GA4 integrates with BigQuery for free, it used to cost $150K for GA360 in order to get access to this feature. This has its own plethora of benefits, for which, we have an article that discusses this:
GA4 also now offers better integration with YouTube for example. This allows for a better understanding of the ROI of your YouTube marketing budget.
GA4 Supports Better Sessionisation and Thus is More Accurate at Cross-Platform Tracking
Now you can paint a fuller picture of your customer journey by bringing together web and app performance into one account. This allows you to optimise certain parts of your journey that you were previously unable to connect the dots between. As a lot of customer interactions now span across different platforms, this is a huge benefit!
When should I migrate from Universal Analytics to GA4?
Don’t migrate entirely just yet! But do add the GA4 pageview pixel straight away.
There are some features missing from GA4 such as exclude parameters, regex goals, page path & landing page reports, automatic Google Sheet API integration, pageID dimension widening and most importantly the default reports are very difficult for the average user to find and use. Also, many call tracking, live chat and social widget providers do not currently support sending events into GA4.
These missing features will hopefully be addressed and there are GTM workarounds using JS regex for goals or location.pathname custom dimensions to mitigate some of the issues mentioned above.
I expect the interface will improve over time and it is possible to create a library of custom reports that replicate the GA3 default reports.
Also, support of historic event imports or refund events or offline CRM actions are welcome new features.
Thus the future looks bright for GA4.
We want to create some FAQ-style articles that provide solutions to your GA4 questions and problems. If you have any, then comment down below or get in touch with us. We’d love to hear what you need answered.

How to Backup Universal Analytics Data Easily
First published June 28th, 2024
On July 1st, 2024 Google will finish the process of replacing Universal Analytics with Google Analytics 4. All UA data will be deleted, without a backup you’ll lose this information for good. In this article, we’ll explore why UA data is important. We’ll also show you how to back up universal analytics data with a step-by-step guide.
This article is a webinar write-up for the GA4ward talk by Ameet Wadhwani, Product Manager of Analytics Canvas. You can find his slides here and a recording of his talk below:
Why back up your Universal Analytics data?
There is no chance that Google will extend the deadline beyond July 1st. Once your UA data is gone, it’s gone. Google is telling you loud and clear that it’s time to back up.
But why should you? Here are the top three reasons for backing up:
- Historical Data Analysis – We cannot analyse past trends without historical data. This means we can’t look at how websites and campaigns have performed. We’re also unable to look at the impact of seasonal changes. Having historical data located in one place is a huge benefit for analysts.
- Policy – Businesses in many industries, from government to healthcare, need UA data. Agencies, in particular, that have been paid for performance, need data as evidence.
- Blending with GA4 – Stakeholders who aren’t up to speed with UA and GA4 don’t want to see a new set of reports. They want continuity in reporting and need to be gradually brought to GA4.
If you’re still unconvinced, further reasons for backing up UA data can be found in the image below.
What to backup
Prioritise the following areas.
- Your existing dashboards and reports – You’ll probably currently be doing most of your historical analysis within Google Analytics dashboards. They’re also likely what your stakeholders are used to seeing.
- The most relevant metrics and dimensions – These will be essential if you’re considering blending your data.
- Anything you routinely review in the web interface – Ask your stakeholders which custom reports are most important to them.
- Anything you may want to analyse again in the future – For example, device, ads, site speed, etc. Take a survey of the key data that has been relevant in recent years, and dial this into your backup.
- Anything else mandated by your organisation or client – Organizations or clients may have specific expectations about what they want to see backed up. Make sure these requirements are met in your backup.
How far back should you go?
A good base point is to go back as far as your last major website backup. If you’ve significantly changed your site, then data before this point will not be relevant.
Think about your budget. There are plenty of free solutions available, you could also opt for or low-cost choice, such as Analytics Canvas. Free solutions are less effective. Even with a lower-priced solution, the more you back up the more you’ll be paying.
Data retention settings
It’s important to consider your data retention settings. Someone in your organisation may have put a data policy program in place. If this is the case, you will only be able to get a certain amount of data.
Once data retention settings are activated, they will be applied on a rolling basis, so data will already be gone.
To deactivate this setting go to the admin section of a Universal Analytics property, choose “Tracking Info” > “Data Retention,”. From here, you can find settings that allow you to specify how long Google Analytics retains user and event data before automatically deleting it. From the menu choose ‘do not automatically expire’.
Other backup considerations
Audit your backup
Under Admin choose Property > Custom Definitions. From here, check for Custom Dimensions and Metrics. If they are used, determine what they are and which tables or reports should contain them.
Audit for goals
Not everyone used all 20 Goals in UA, this could be a simple way to scale back your backup. To audit for Goals choose Admin > View > Goals, From here, check for Goals to determine which Goals to include in the backup.
Audit for events
Some people have defined a lot of events within their workloads. Make sure you’re collecting the right dimensions and metrics alongside the events on your site. To carry out this audit go to Admin> Events > Overview, and check for events. Discuss the use of events with stakeholders to understand the tagging strategy and how to create valid event reports.
Audit for demographic and interest reports
Audience and demographic reports aren’t enabled for all sites. If they are enabled, they can be viewed under Reports > Audience > Demographics > Overview. Oddly enough, the more dimensions you add to the table, the fewer results you’ll get. This is because Google is attempting to anonymize data and ensure that individuals aren’t identifiable.
Audit for segments
As many organisations carry out a lot of segmentations this audit is critical. Segments can be found under Admin > View > Segments. It’s also asking stakeholders if they applied segments to their reports.
Three options for backing up UA data
Google has provided us with a few options for backing up our UA data. The first is the Web UI – from here you download your reports individually as PDFs or Sheets files. This option is way too time-consuming.
The second option is to use the BigQuery export. This option is only available to Google 360 customers and is a nested model. You’ll need a strong knowledge of SQL to complete this successfully.
The last option is to use the API alongside commercial tools. Google has also offered a solution that connects to the API via Google Sheets. There is a long list of challenges associated with reporting against this API. These include:
- There is no “download all”.
- Sampling (500K+ sessions).
- Report Query Limiting (50K+ rows).
- Max 9 dimensions + 10 metrics per query.
- Partitioning on Unique metrics (USERS).
- Limit of 100k rows per request.
- Some dimensions return no data (demographics).
- Some combinations of Events exclude data.
- Inclusion of custom dimensions limits results.
- Some valid queries will simply not return data!
- “Limiting dimensions” restrict sessions in results.
- Quota limits. API errors! etc. etc.
The Analytics Canvas Solution
With little time to back up our data, the only realistic option is to use an off-the-shelf solution. Analytics Canvas has been building an engine for the past ten years. This has been designed specifically to extract UA data scales across large sites.
- Pre-built backup data model.
- Eliminate sampling + RQL.
- Access to a 20-page Looker Studio Report.
- Get the full history from unlimited Views
- Publish to BigQuery, Sheets, Excel + CSV
- Most affordable pricing in the industry.
How to backup UA data in Canvas
Let’s look at how to back up Universal Analytics data in Canvas step-by-step.
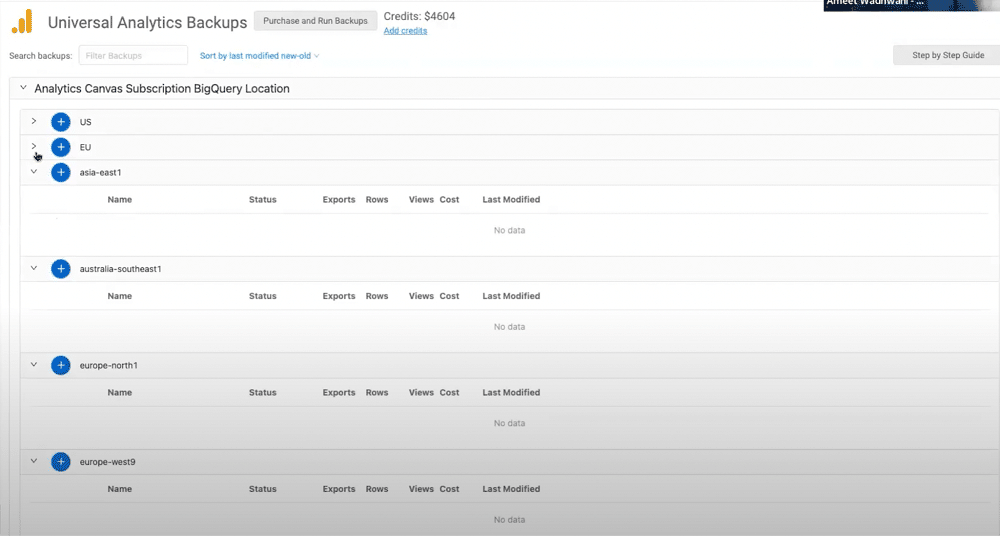
Step 1 – Choose a backup location
From the UA backups menu in Canvas, you can back up to any data location that BigQuery supports. Choose a location that makes sense to you and build your backup there.
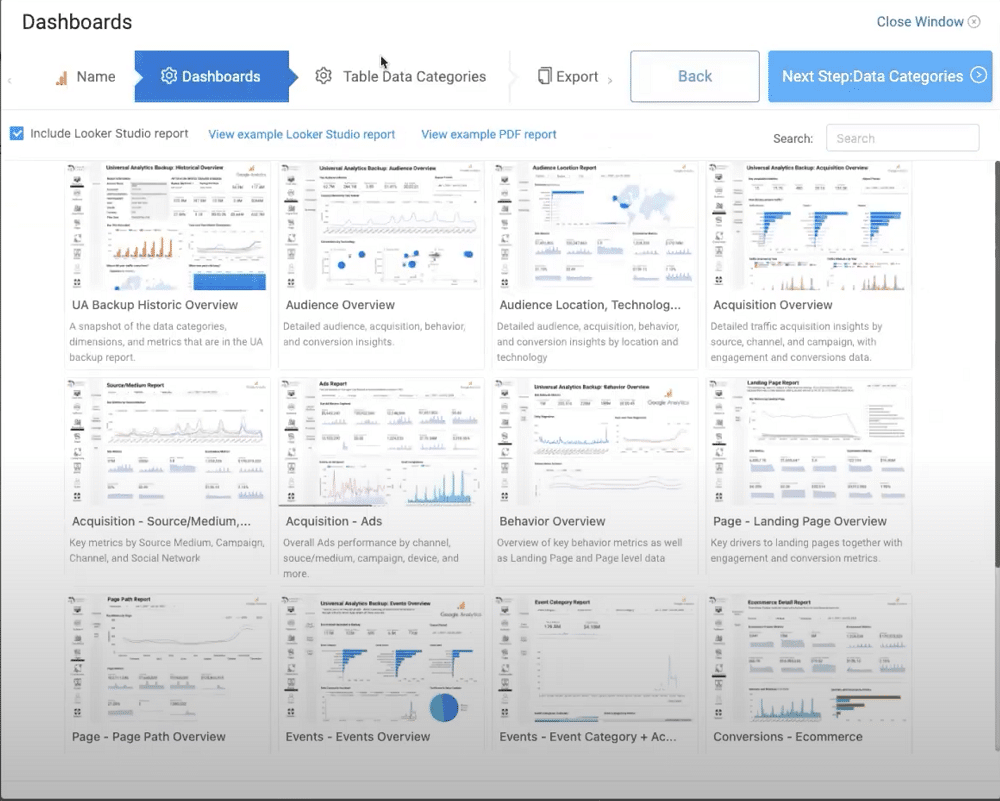
Step 2 – Name your back up and choose your dashboards
Upon choosing a destination for your data, you’ll be prompted to name your backup. You’ll also be asked whether you wish to keep your dashboards. To support your decision, Canvas allows you to preview these through a PDF or via BigQuery.
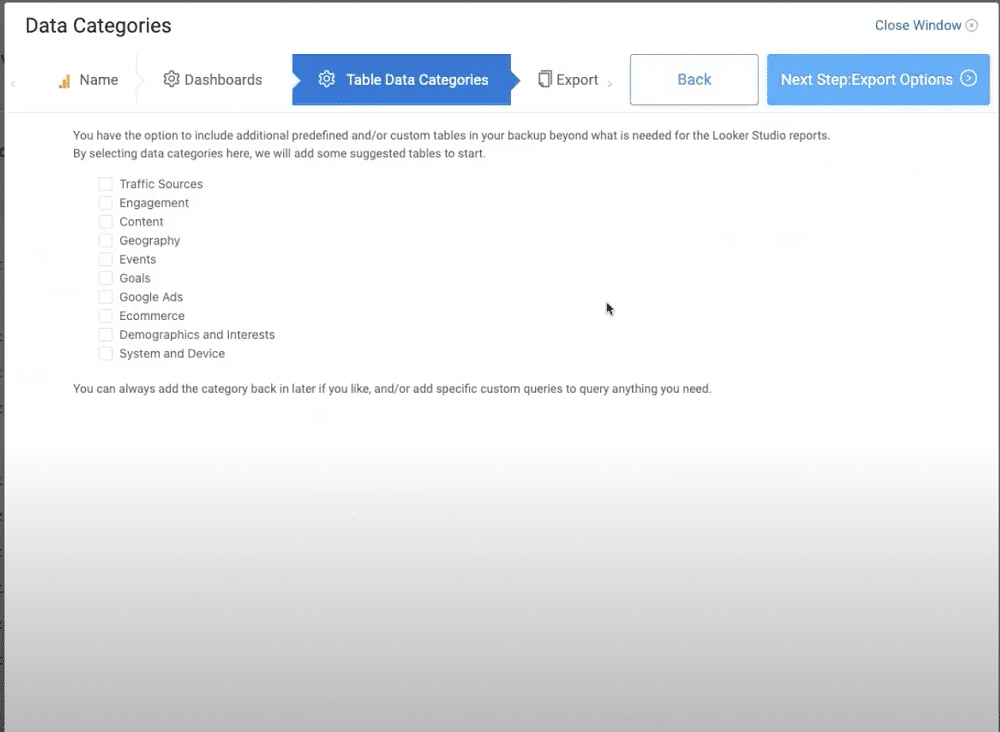
Step 3 – Pick a data category
Next, you must choose a data category modelled from the UA reporting API. You can select one or more categories. After selection, the tool will add default tables modelled from the UA web interface.

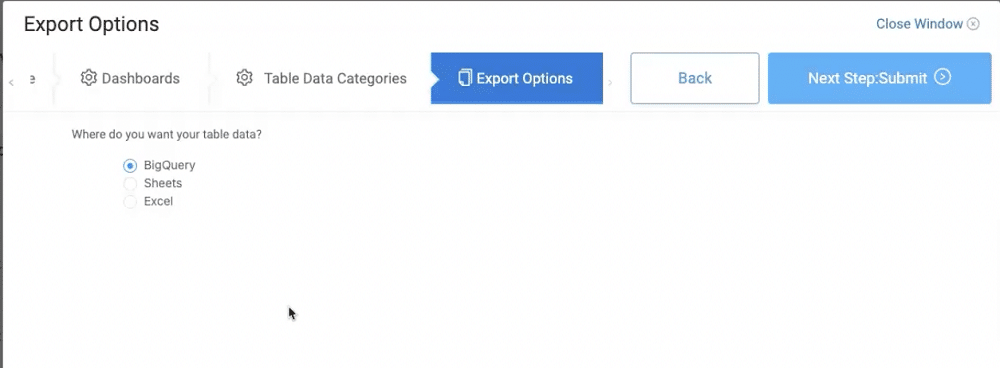
Step 4 – Send your backup to BigQuery, Google Sheets, or Excel
You can now choose either BigQuery or Google Sheets as a destination for your data. If you select BigQuery you will receive a much more detailed backup.
If you choose Sheets or Excel you will receive a lower level of detail. This is because there are hard limits within Sheets and Excel about how much data can be added to spreadsheets or tables.
Note: If you choose Excel you won’t have access to dashboards.
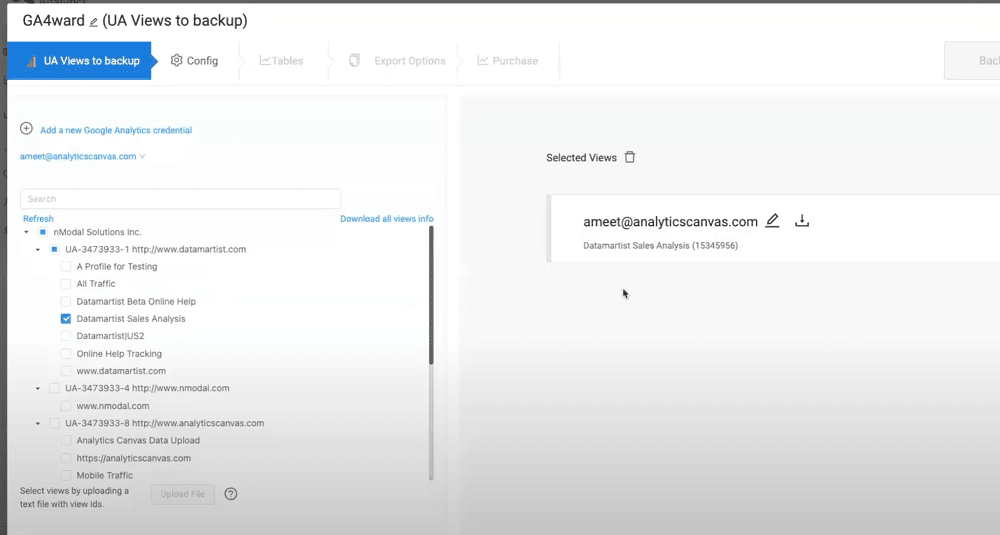
Step 5 – Select views
Next, you choose how many views you wish to back up (if you’ve chosen visualisations, you can only choose one view).
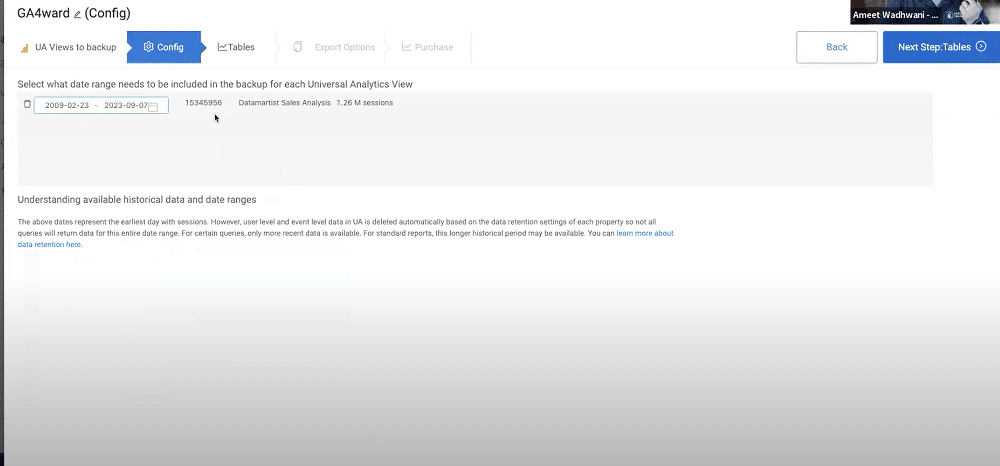
Step 6 – Define a time frame
The property is now scanned and you will be told how much data is available. The more lengthy the timeframe that you choose, the higher the cost, and the longer the duration of the backup.

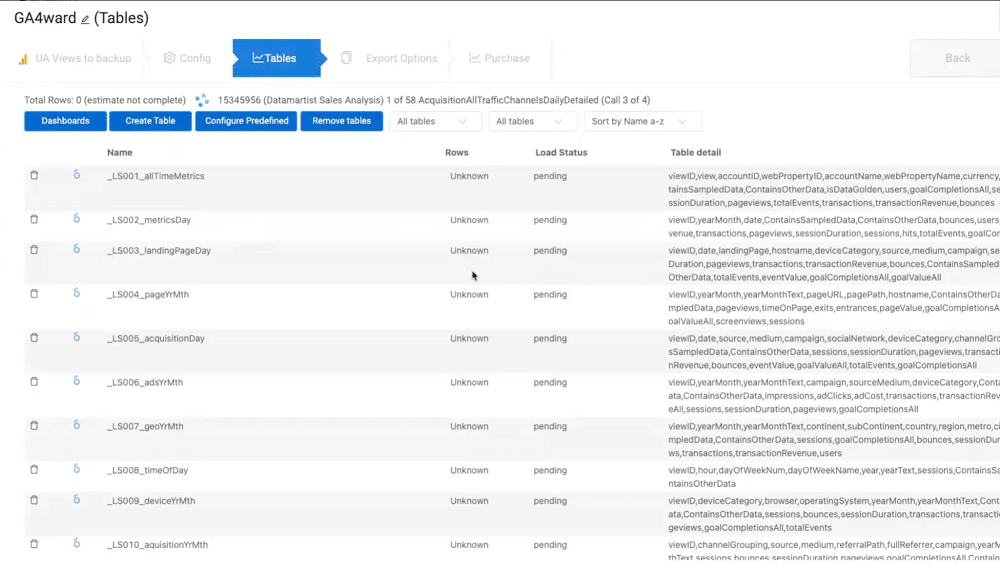
Step 7 – Receive an estimate
You will then be shown a library of all your tables. This is already fully configured so there’s no need for you to do anything. At this stage, you’ll also be given an estimated cost for the backup.
With Canvas, you’re guaranteed a lower range of the estimated cost on final delivery. If the final delivery is lower than the estimated cost, refunds will be sent beginning on July 1st.
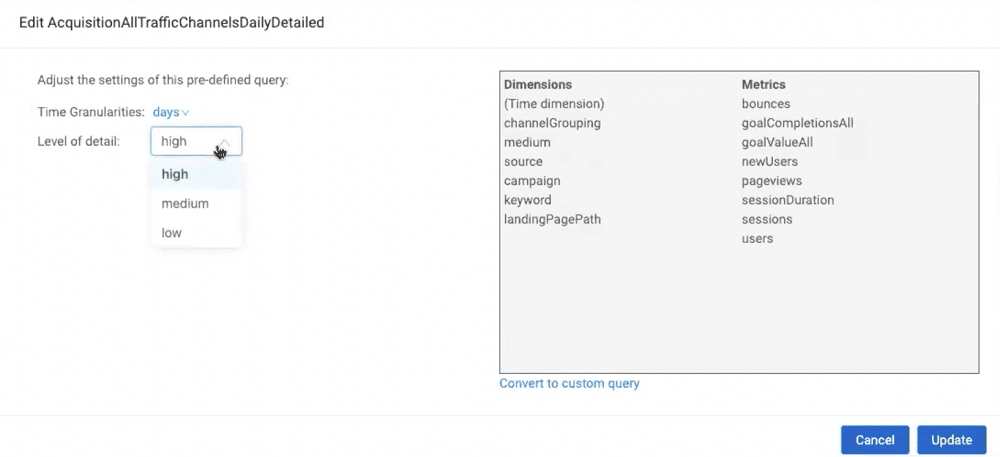
Step 8 – Choose a level of detail and granularity
From the list, you can find all the tables that line up with the UA web interface. By selecting these, you can modify the level of detail. Lower detailed tables will help to reduce the cost. You can also change the granularity of the data, ranging from days to years.

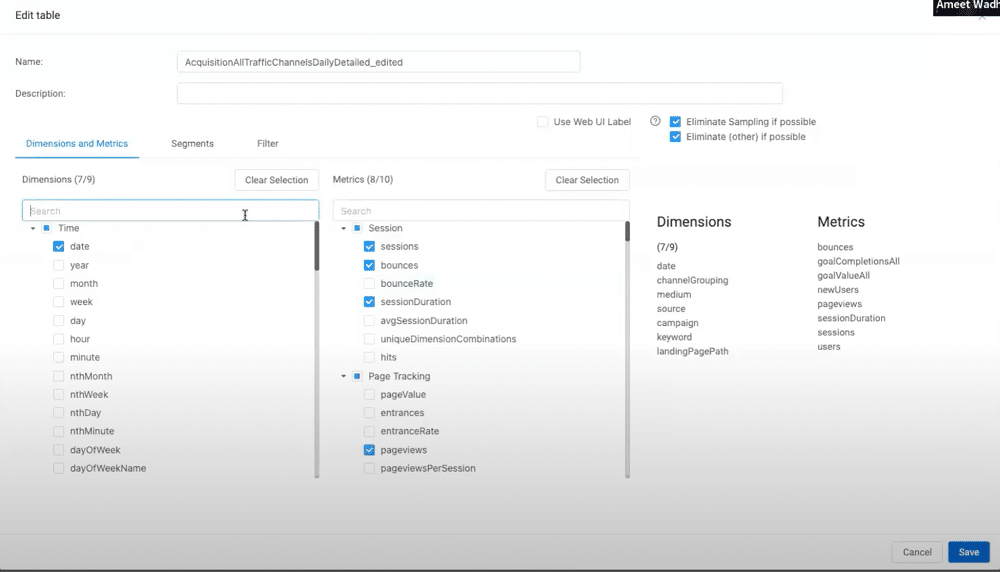
Step 9 – Add custom dimensions, variable, segments, or filters
You also have the option of converting a table to a custom query. This allows you to add custom dimensions or variables. Additionally, you can add segments or filters.
Step 10 – Select an export location
Once the configuration is complete, you can choose where you want your data to go. You can choose from either a Google Sheet, Excel (if you don’t have any dashboards or BigQuery.
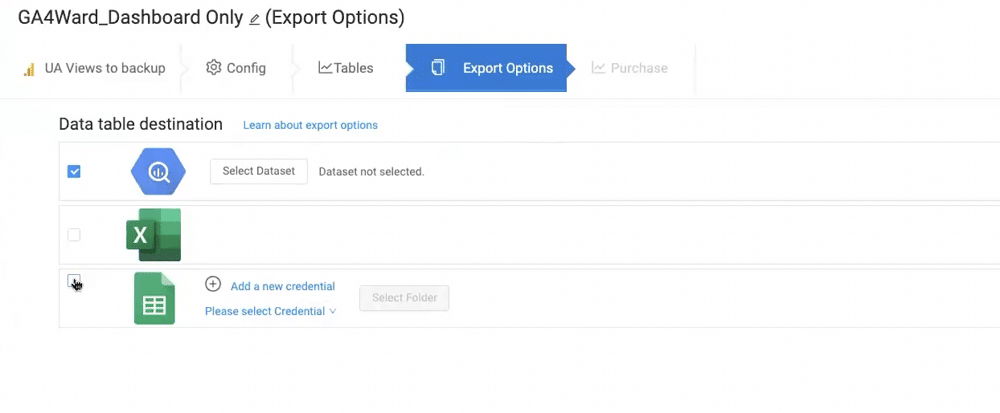
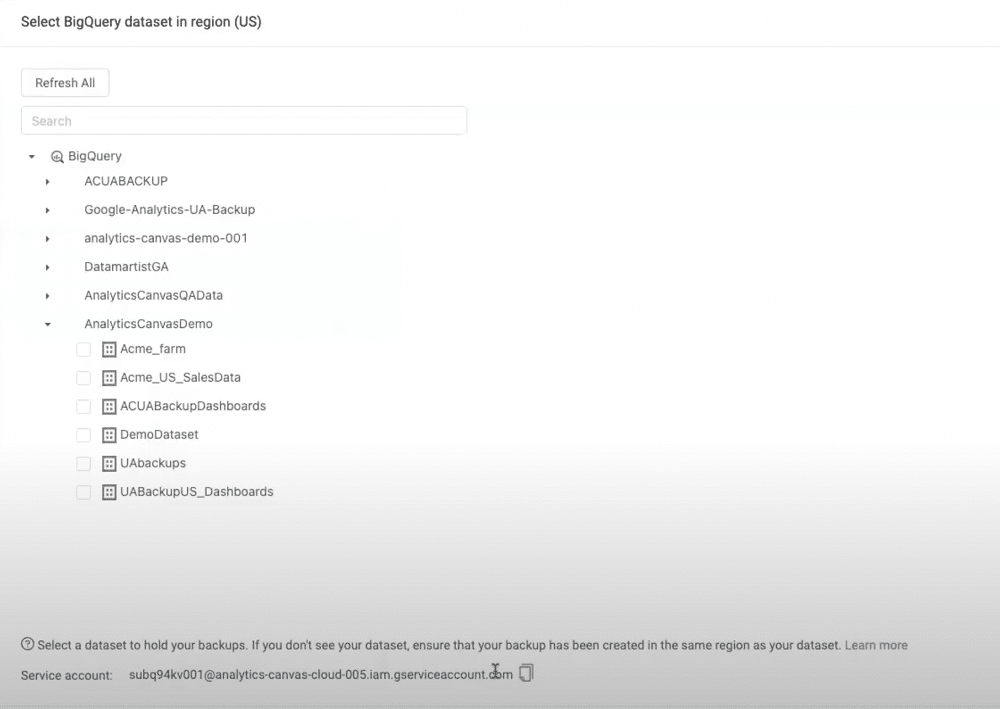
You’ll then choose where you want your data to go. For instance, you’ll choose a BigQuery dataset.
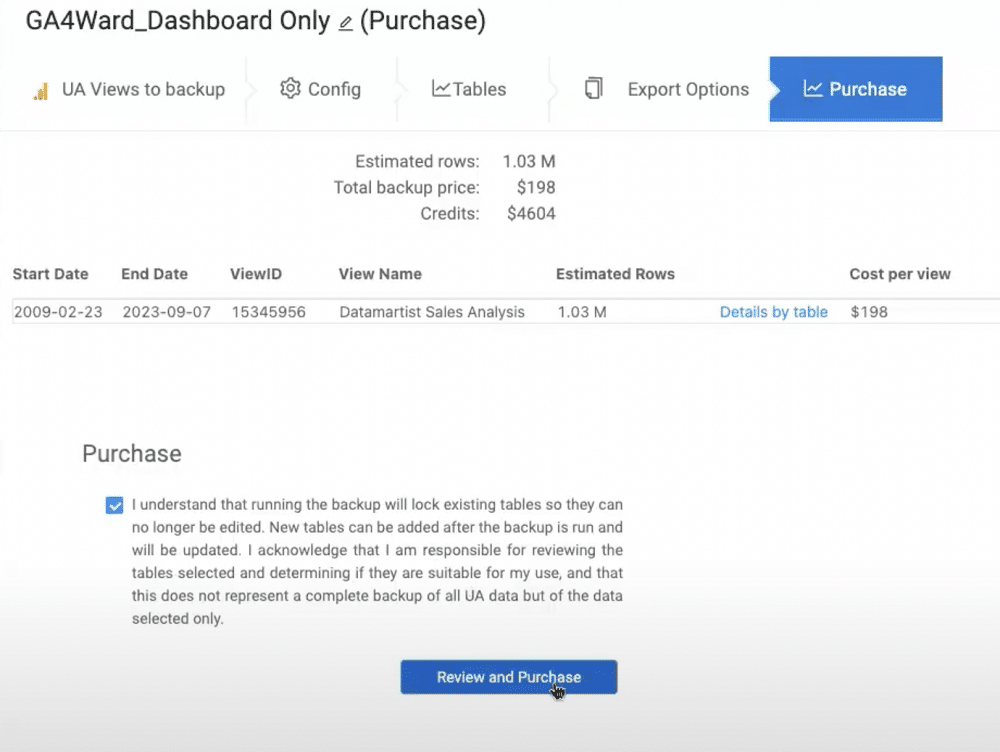
Step 11 – Review and purchase
Lastly, you’ll review the terms of purchase, and if happy, accept.
Step 12 – Review your backup
Now, let’s look at what your backup will look like once downloaded. This will be found in your Google Drive ‘UA Backup’ folder.
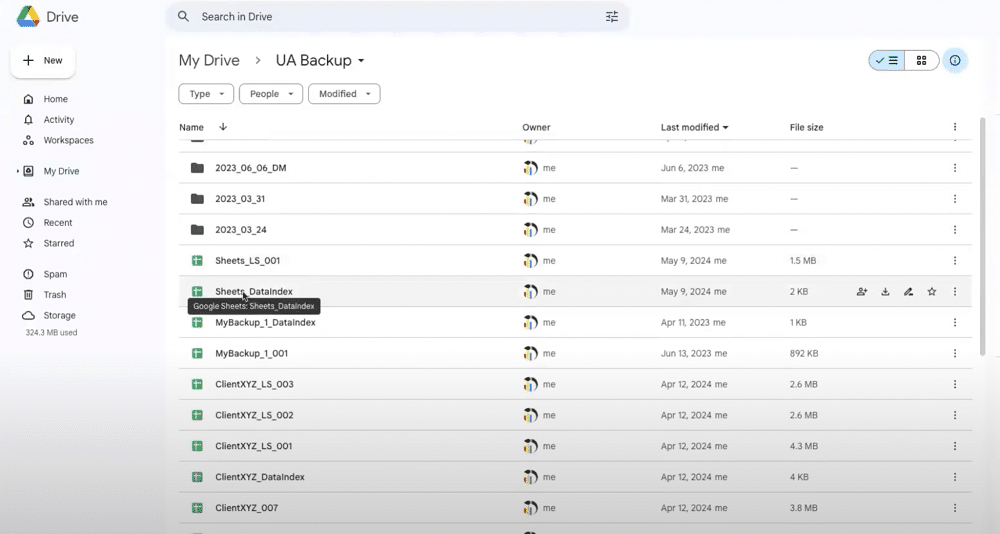
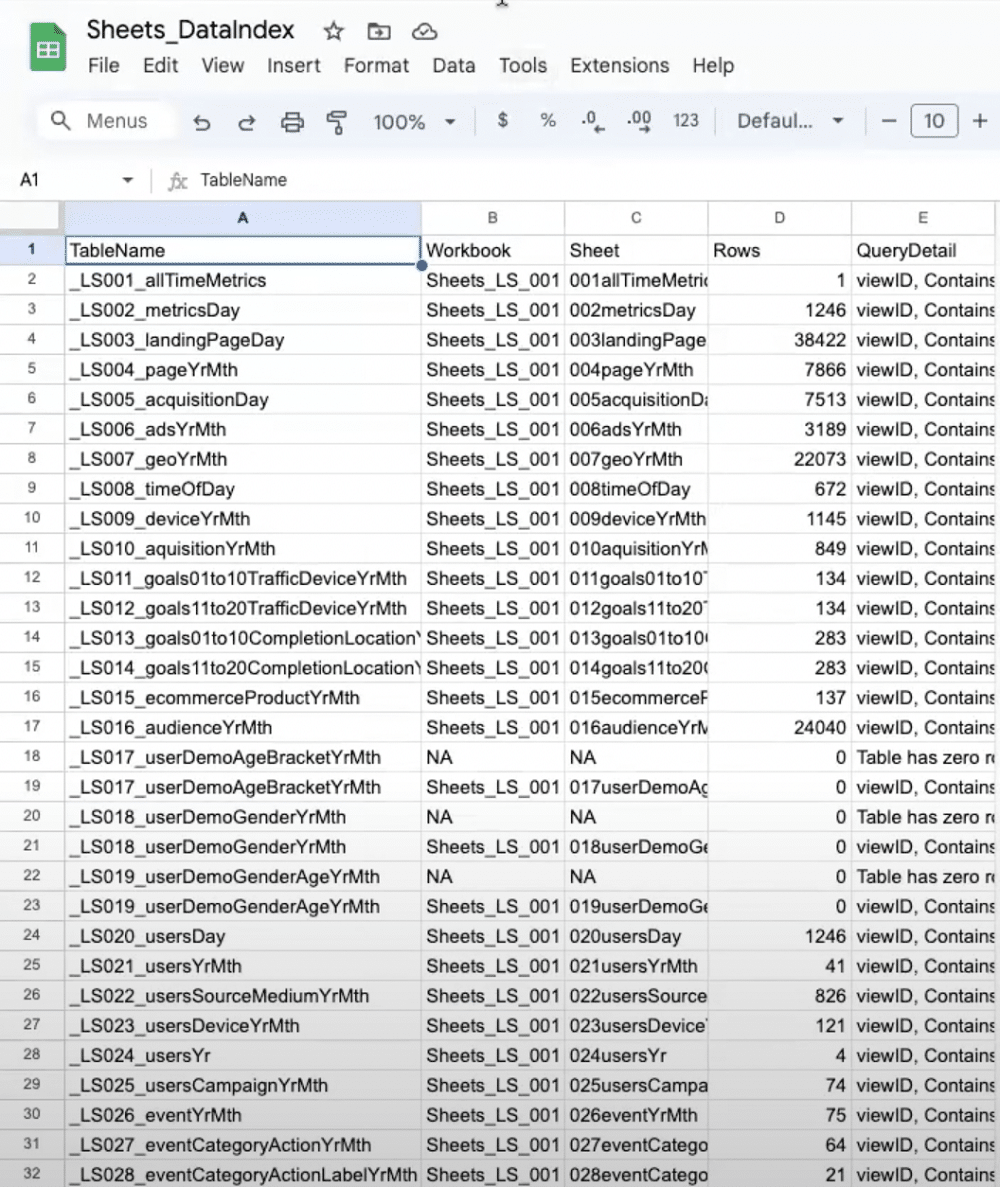
Within this folder, you’ll find your data index. This contains information about what is in each spreadsheet. This includes the number of tables and the number of rows.
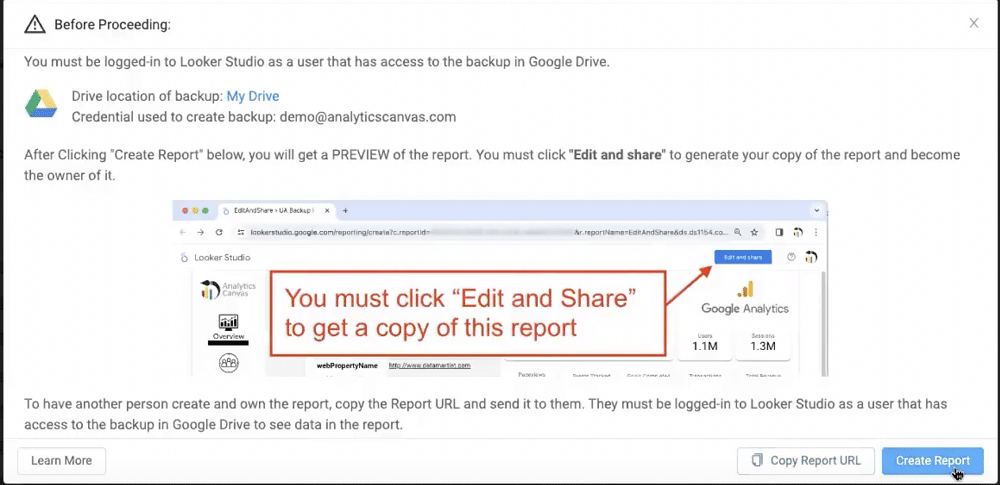
Step 13 – Generate a report based on the backup
Let’s generate a report based on our backup within Looker Studio. From the ‘Create Report screen’, you also have the option of sharing a link. Simply click ‘Copy Report URL’. This enables clients to own their data.
Step 14 – Save your report
To ensure that your reports are properly saved within Looker Studio, you’ll need to select ‘Edit and save’. Make sure you don’t make any edits to your reports at this stage, as this can prevent you from owning your report.
Once complete, you’ll own your reports and can make any edits that you’d like.
Comparing report data
You know how to back up universal analytics data using Canvas. But what should you do once historical data is in your account? The first step should be to create blended views to compare your UA and GA4 data.
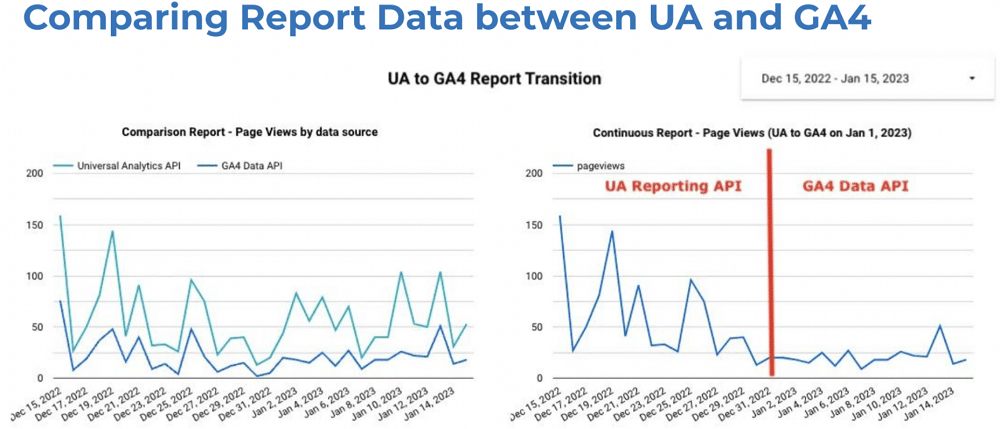
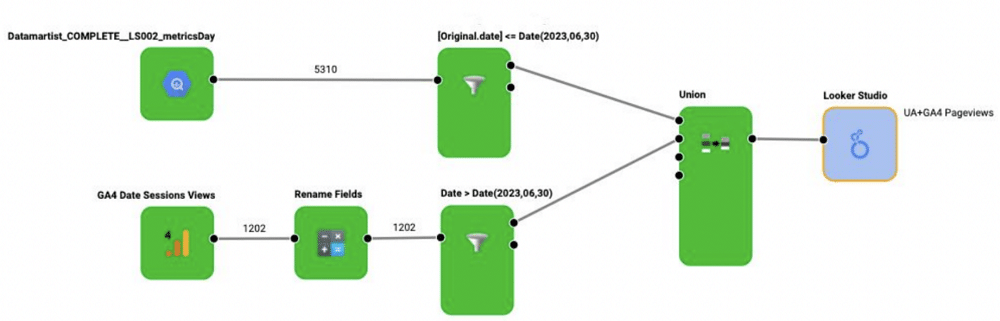
Let’s look at a classic data exercise. We’ll start with our UA data in a BigQuery table, then we’ll bring in a similar table from GA4. Alongside this, we’ll add a calculation block and rename the fields. In UA we have ‘pageviews’, in GA4, we have ‘screen pageviews’.
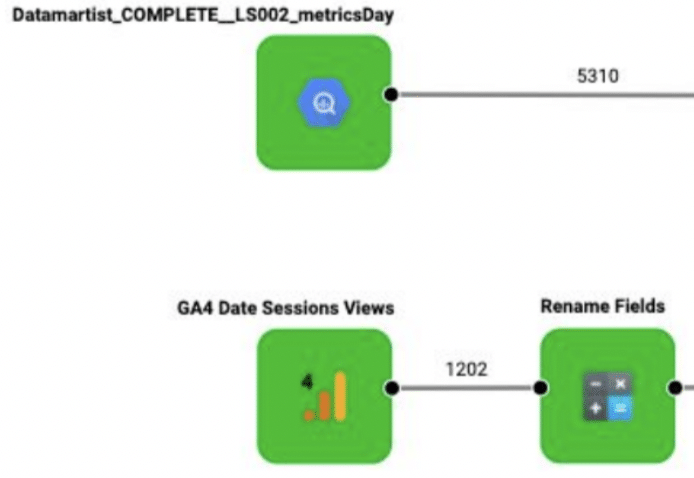
Next, we need to add some filters. We want the UA data to stop at the end of June 2023 and start GA4 reporting from July 1st. Once created, these need to be unioned together. This produces a single table of data structured with the columns that we need. Finally, we’ll add a Looker Studio table.
We can now start building comparison reports, spot trends, and identify differences. Directionally, GA4 and UA should be very similar. You may notice some spikes in UA traffic compared to GA4. This is likely because GA4 is much better at detecting bots.
Comparable metrics
There aren’t many comparable metrics between GA4 and UA. Google has published eight comparable categories:
- Users
- Pageviews
- Purchases
- Sessions
- Conversions
- Bounce rate
- Event Count
You can read more about these here.
GA4 reporting challenges
After completing your blend and starting to work with GA4 API, you might start running into some limits. GA4 reporting is no longer free. If you’re using the API, you must now pay a token-based system. This was a bigger issue in 2022-23 and is now only really a problem for larger sites.
If you’re using Google Analytics with BigQuery, you’ll now be paying with dollars after your free credit expires. When handled correctly, your queries can be quite low-cost. However, if you have a big site, there may be some heavy costs.
There are also several other challenges associated with GA4 reporting. These include:
- An entirely new data model – we must put aside our learnings from UA and learn a new data model.
- Queries are harder – Knowing which queries are compatible is much more difficult, you’ll get the wrong results if you add the wrong combination of dimensions.
- Queries cost $ or tokens – If you’re doing a heavy amount of development in a day, there’s a high chance you’ll hit the token limit.
GA4 reporting surfaces
Within GA4 there are four reporting surfaces. These are shown below:
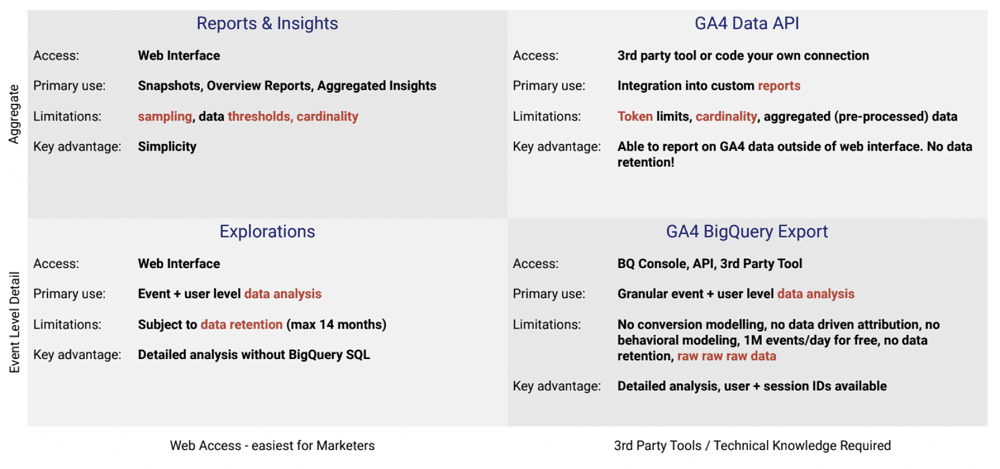
Each reporting surface is a distinct data source. Each offers various dimensions and metrics and captures different information.
Reports are the highest level and aggregate data. It doesn’t have data retention limits applied. Explorations, on the other hand, are limited to 14 months of data retention. The API feeds off reports so also has no limits, but also lacks the granular detail of BigQuery exports.
The BigQuery export has its collection mechanism and contains very rich data. The primary difference between this method and the API is that one uses ‘collected’ data and the other uses ‘connected’ data.
Connected data includes your search console data and Google Ads data. This form of data is brought into the GA4 reports via the API. This information, however, is not present in the BigQuery export. The export uses raw hits and event-level data collected by GA4 and imported to BigQuery.
Reporting using the API
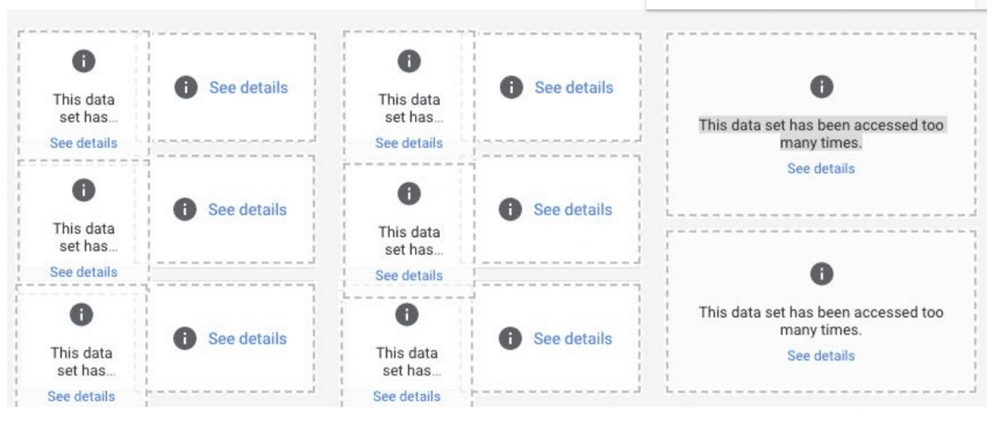
In November 2022 many users will have seen the below error in their reports. Google introduced token limits to relieve pressure on its API.
To stay within token limits, bear the following points in mind:
- Don’t ask for the same data twice.
- Stage your data and keep it out of the analytics servers (in BigQuery or elsewhere).
- Load history once, then incrementally load. Every day ask for the last three days’ worth of data. This enables you to stay up-to-date with the API.
Reporting using BigQuery
The BigQuery export seems like a complex model but there are a lot of resources to help, New videos and articles are constantly arriving to make the process easier. The BigQuery export also has some great advantages.
Firstly, it’s ‘free’ you don’t need to be a 360 customer to activate the export. For most users, the costs will be zero or very low. Larger websites, however, will incur costs.
BigQuery is also the dataset that analysts have been asking for for a long time. It contains user and session IDs enabling us to create funnels and segments. Thanks to this we can better understand how users are progressing through our sites.
The export also enables us to build our segments. This isn’t a feature available using the API or BigQuery.
Finally, BigQuery is highly easy to integrate with dashboards and reports. Almost any modern tool will connect with BigQuery.
The downsides
Unfortunately, it isn’t all positive. If you handle the export poorly, such as connecting lots of raw data to a such as Looker Studio, it can be a costly exercise.
Another downside is that the export requires some knowledge of SQL. You’ll also need a strong understanding of the data model to make queries. As tools such as Dataform come out, however, this is becoming much less of a barrier.
The data is also a lot more raw than many people realise. Users have to calculate their dimensions and metrics in many cases.
Backup now!
If you don’t back up now, you’ll soon lose access to your UA data. In this article, we’ve shown how to backup Universal Analytics data. Let’s quickly recap some of the key points:
- Store your UA data in BigQuery for ease of access
- Activate the GA4 BigQuery Event Export
- Report on GA4 using both the API + Event export
- Blend UA + GA4 data to help ease the transition
About Ameet Wadhwani
Ameet Wadhwani is the Product Manager for Analytics Canvas, and has been helping agencies, consultants, and GA certified individuals to report on GA data for over 12 years. Having worked extensively with GA4 data since inception, he writes extensively on GA4 reporting challenges and solutions on the Analytics Canvas blog. You’ll often find him in the #Measure and #analytics-canvas Slack channels, as well as on LinkedIn, Facebook, and Reddit, contributing GA expertise to those struggling with reporting.

How to Backup & Visualize GA3 Data for Free

First published June 27th, 2024
With Universal Analytics ending on July 1st, it’s vital to back up your data. In this guide, we’ll show how you can back up GA3 data in a few simple steps using free tools.
To follow these instructions, you must access Andre’s GA Nitro guide.
This is a webinar write-up of André Mafei’s talk at GA4ward V5. Watch the recording on YouTube below:
About the Google Sheet template
The link above provides a template for Google Sheets and Looker Studio. This splits up the process of using the Google Analytics extension for Google Sheets. It also comes with a ton of predefined settings.
Downloading your data
Let’s follow the step-by-step process for downloading your GA3 data.
Step 1 – Make a copy of the GA Nitro Sheet
To start, you need to make a copy of André’s UA backup template for Google Sheets. Once you’ve made a copy, the instructions are displayed within the sheet, but refer back to this article in case you need more information.
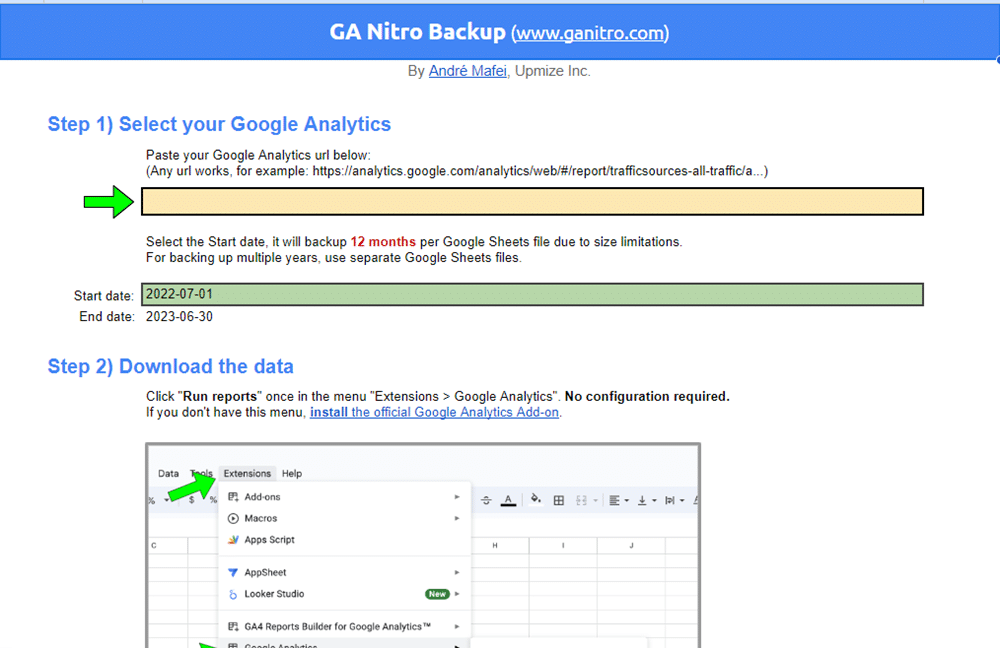
Step 2 – Add a start and end date (maximum of a year)
We can put only a limited amount of data into each Google Sheets file. That’s why we need to download data twelve months at a time.

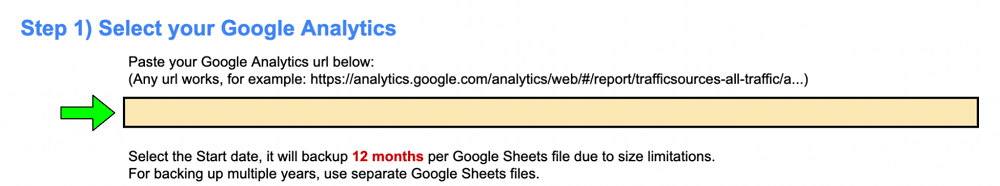
Step 3 – Add the URL of your GA property
Once you’ve inputted your chosen data into the template, you should add a link to your GA property. Simply head over to your GA account and copy the URL. Finally, paste the URL into the allocated spot on the guide.
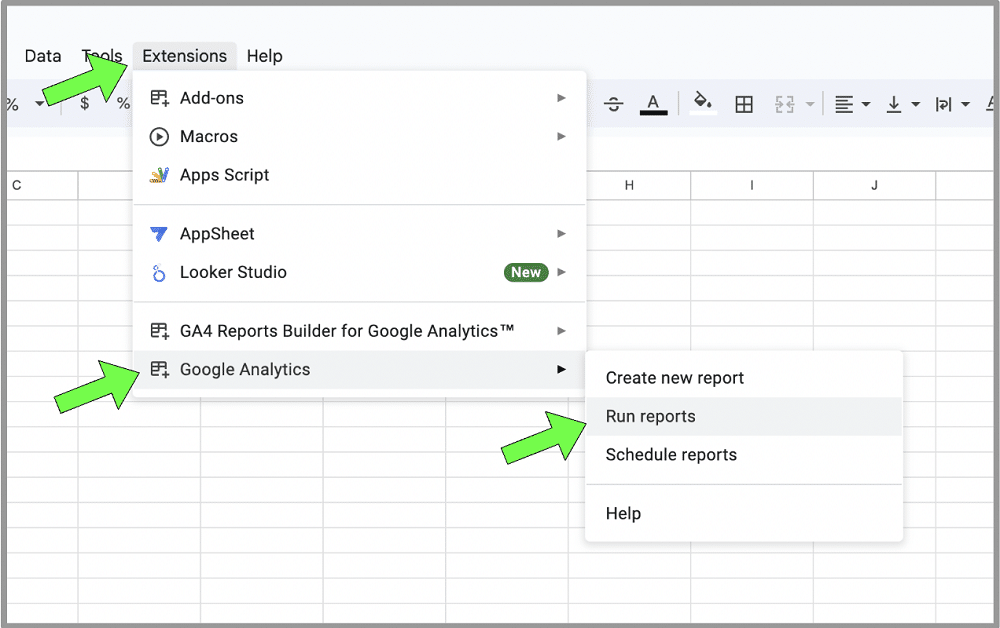
Step 4 – Run your GA report in Google Sheets
Now, head to extensions> Google Analytics > Run reports. Depending on the size of your site, the creation of this report could take anywhere from 10-30 minutes.
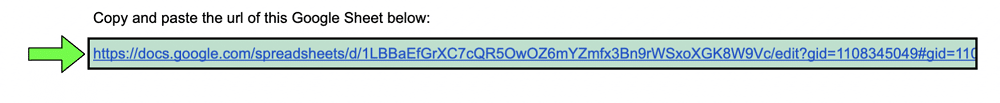
Step 5 – Copy the URL of the spreadsheet and organise
Once the GA3 data has been populated in the sheet, copy the link from the Google Sheet and place it in the allocated spot. You may also wish to change the name of the sheet to keep things more organised.
Building your own Looker Studio dashboard
Follow the link to visualise your GA3 data with Looker Studio. You can also open Universal Analytics to compare the data between digital analytics tools.
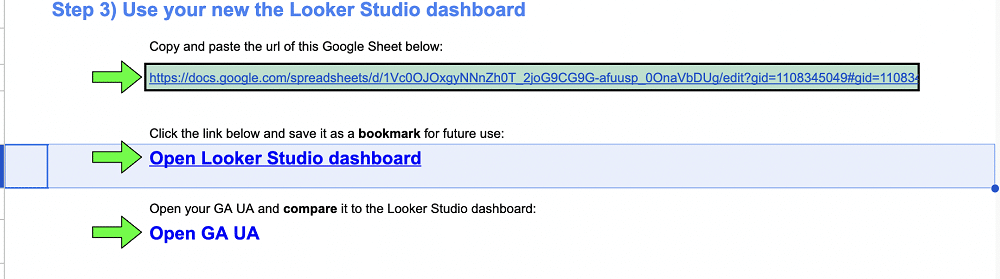
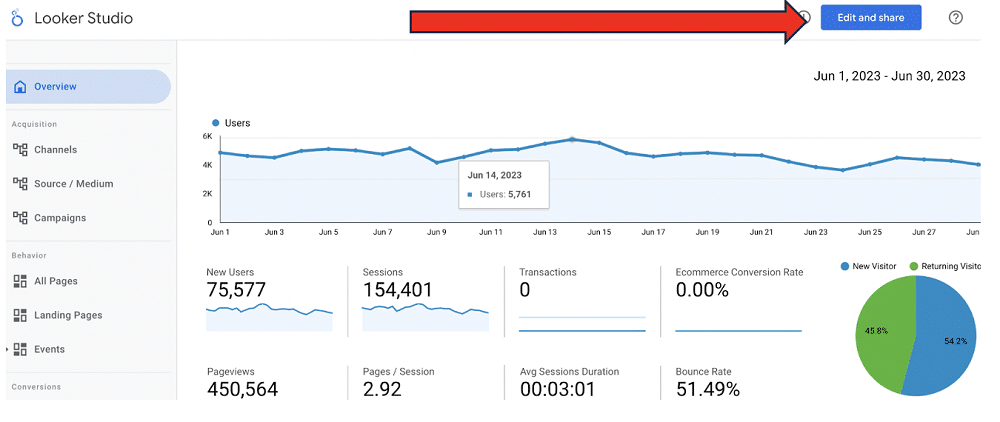
You’ll notice an’ Edit and Share’ button from the top of the Looker Studio page. This is how we create new dashboards in Looker Studio, using a template from your data.
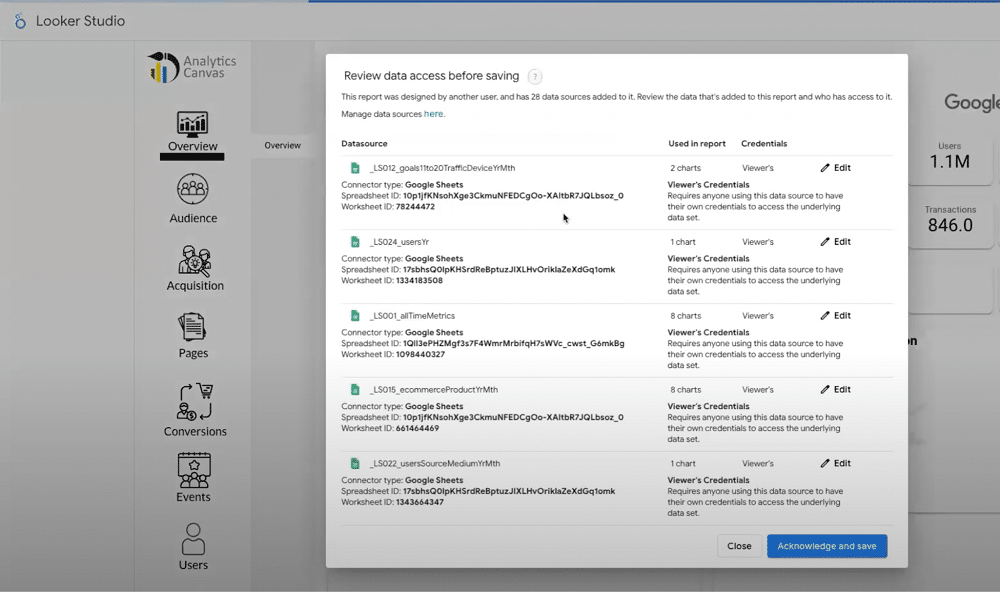
After clicking ‘Edit and share’ and selecting ‘Acknowledge and save’, you will have a copy of the dashboard. You can now play around with this in any way you wish.
Note: None of your data will leave Google. This template is simply a Google Sheets file and Looker Studio template.
Comparing your data
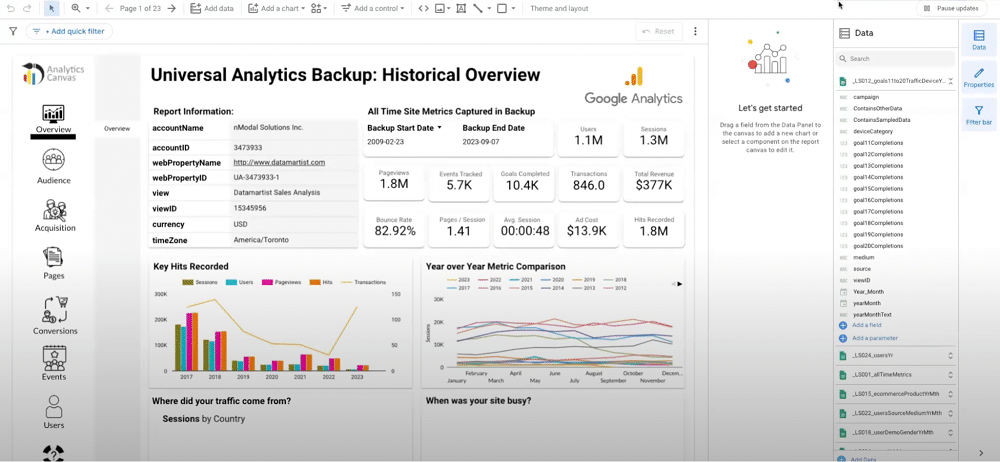
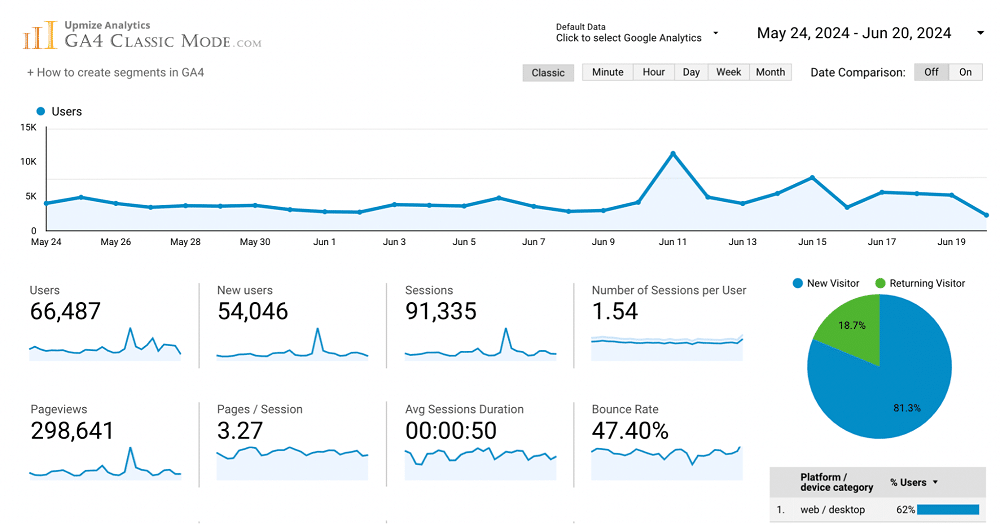
In Looker Studio, your data should look something like this.
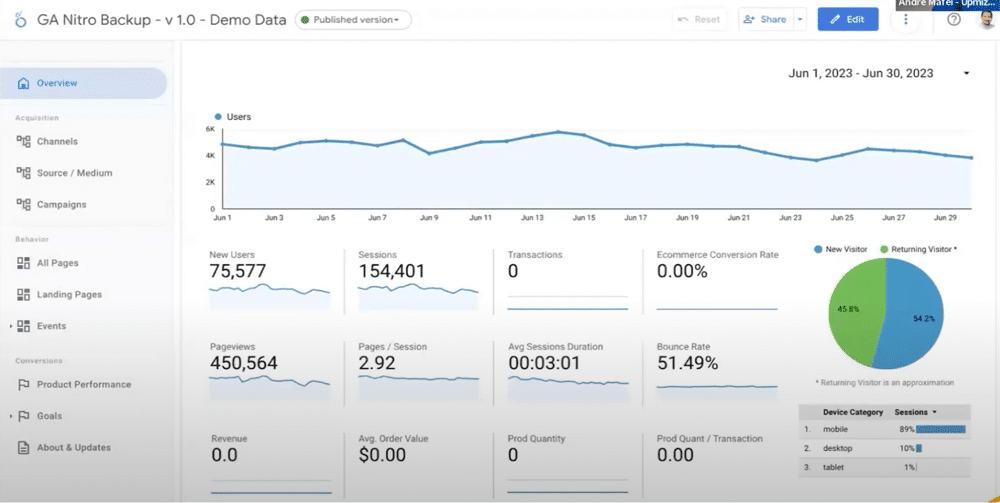
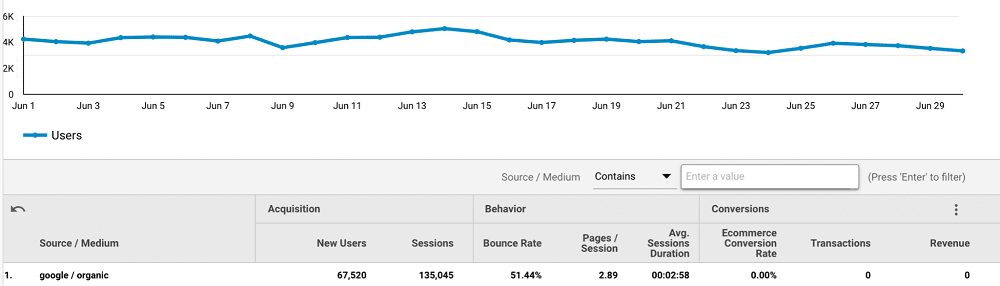
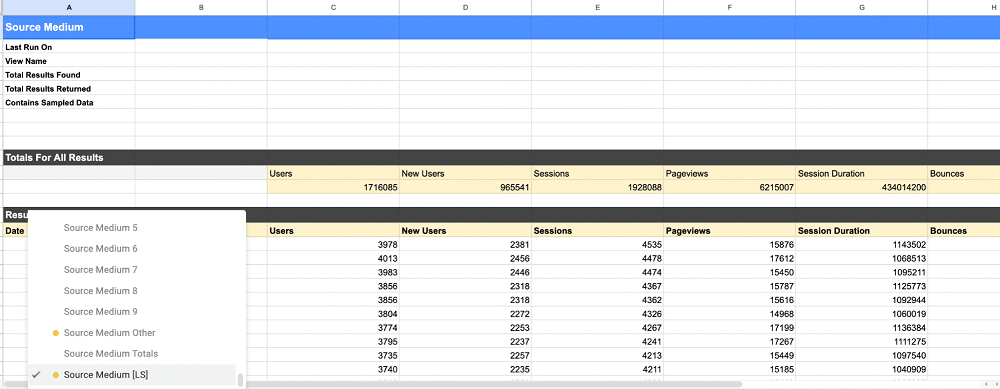
In GA3, data should resemble the below image.
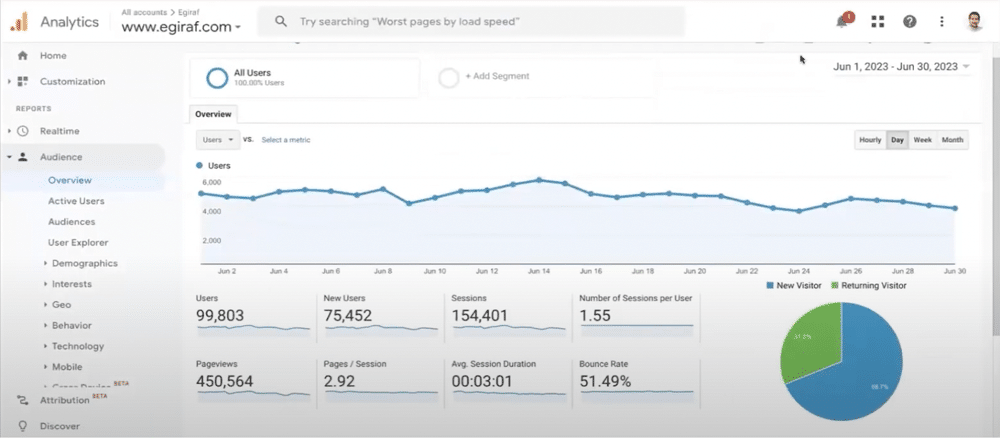
Look at any number in Looker Studio and see how it compares to the data reported in GA. For example, let’s compare the bounce rate.

We can see that the bounce rate in Looker Studio matches with GA3.

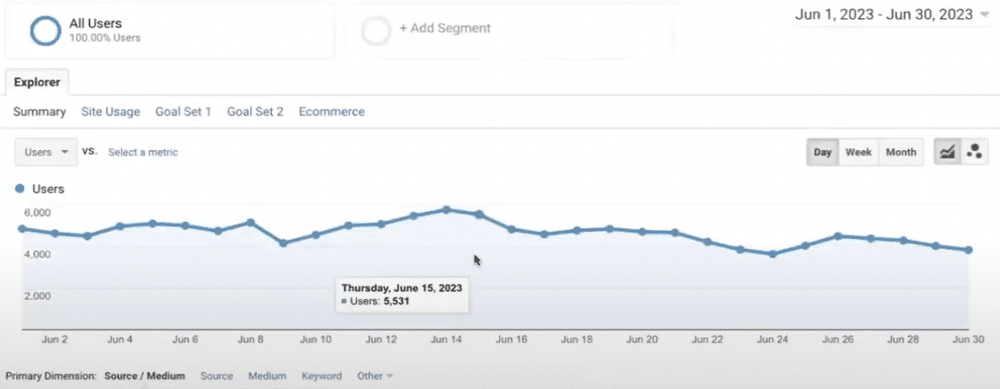
Now, let’s head over to ‘Source/Medium’. In GA3, the ‘Users’ column cannot be exported due to the limitations of the API. Make sure you stick to comparing data from the chart.
From Looker Studio, you can click any of the table entries to change the chart.
You can also change the metric displayed in the chart by choosing ‘optional metrics’.
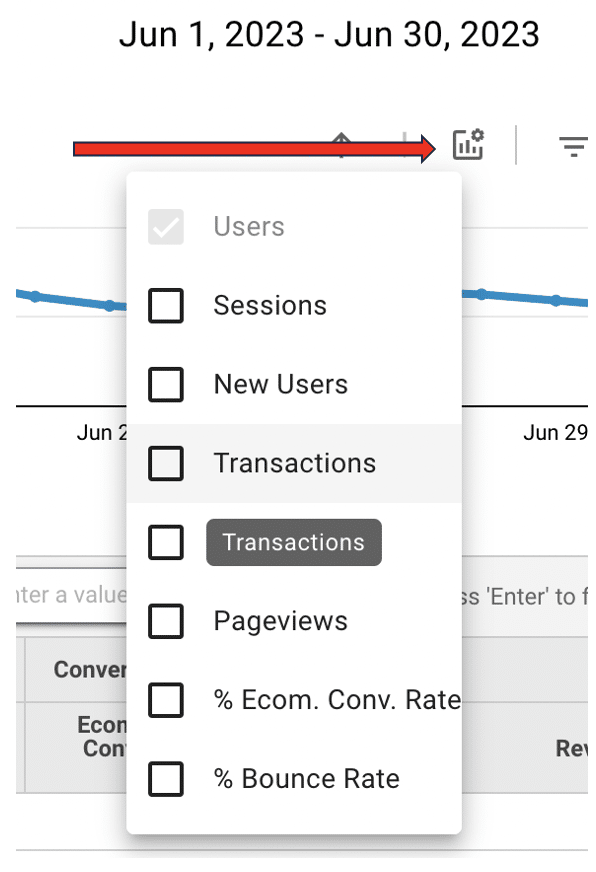
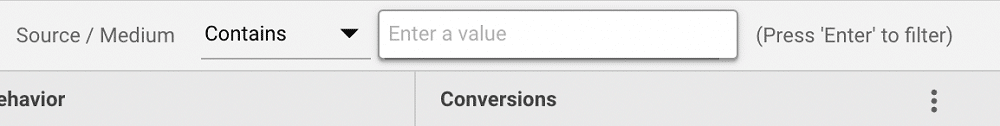
In addition to this, you can filter by entering a value.
Now, let’s look at ‘All Pages’. You can see here that Looker Studio is trying to be smart and presenting data as a URL.
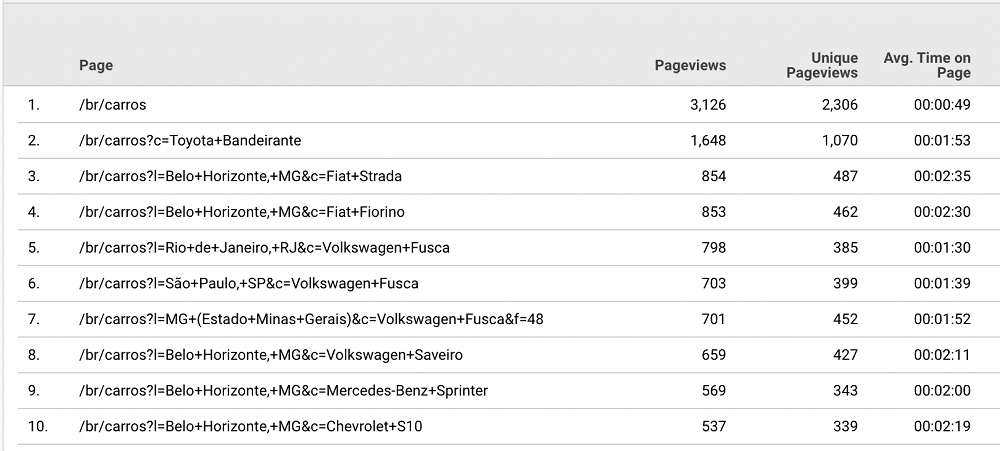
But what if we don’t want data presented in this way? To make this data clickable, we can head to the editor and choose ‘Properties’ > ‘Page’ > change the data type to ‘Text’. Lastly, let’s publish our changes.
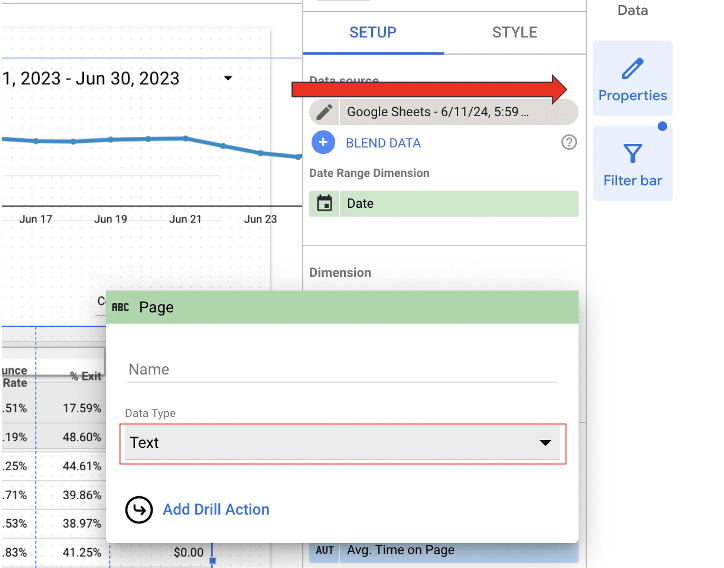
The data entries in the report should now be clickable.
Downloading goals
What if you want to download your goals? The API only provides us with IDs ‘Goal ID 1’, ‘Goal ID 2’, Goal ID 3’, etc.
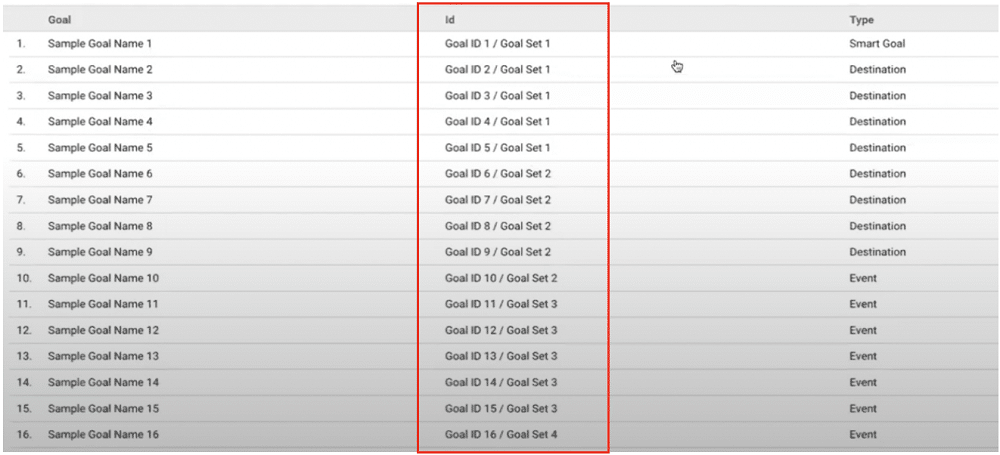
Luckily, there is a simple fix for this problem. Head to ‘Goals’ within your Google Analytics dashboard. Sort by ‘id’ and then copy the list.
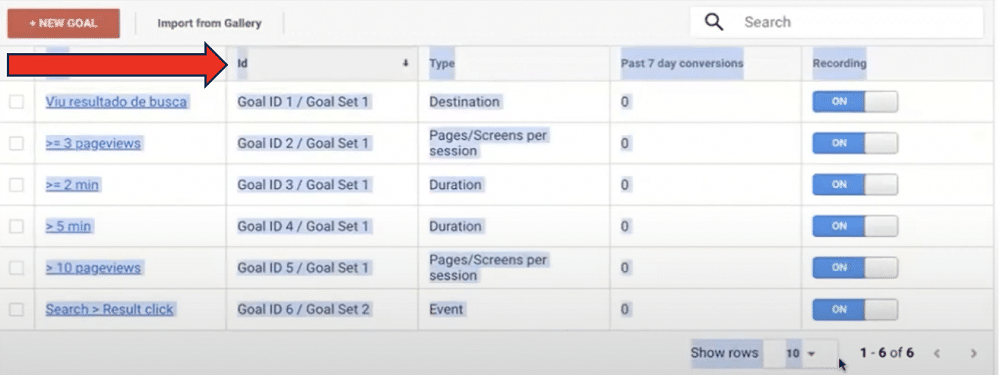
Now, open a new sheet in Google Sheets and paste in these values. Then, copy the first three rows from this table.
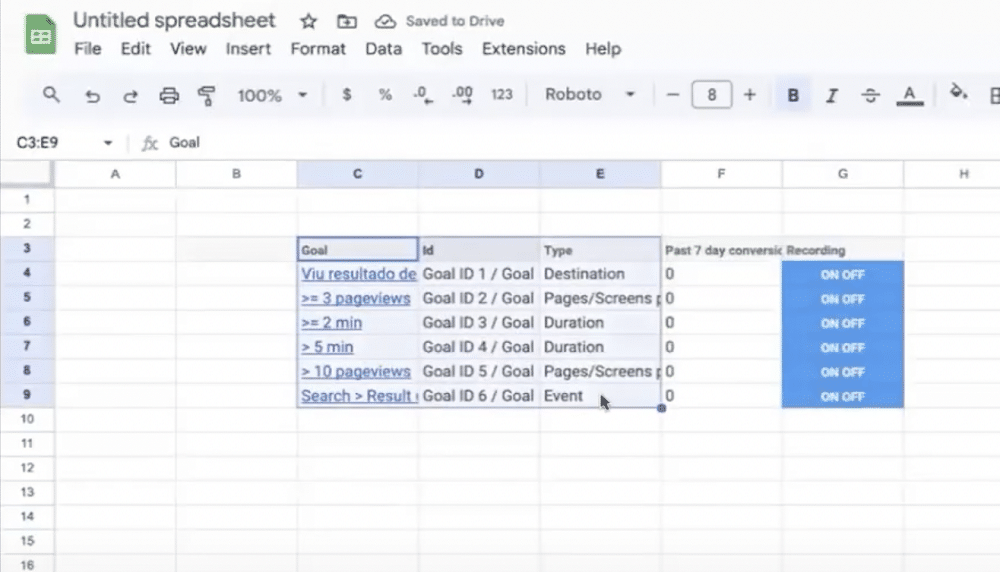
Go back to the template spreadsheet, choose Goal Names>Edit>Paste Special> Values Only.
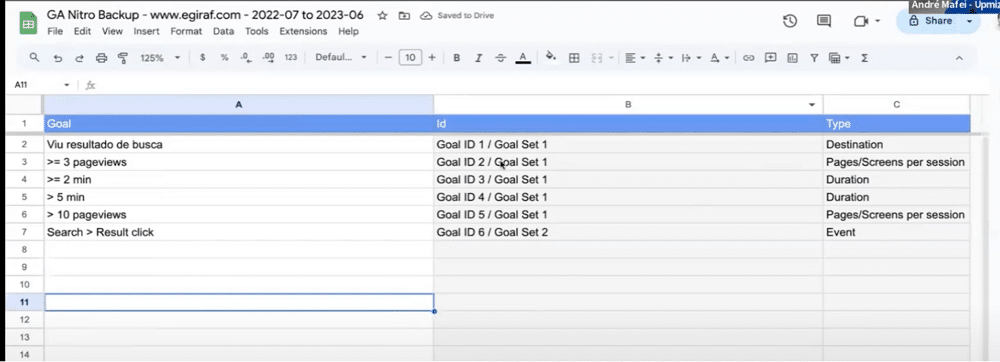
And there you have it. A list of the definitions of your goals. These will now show up in your Goals report.
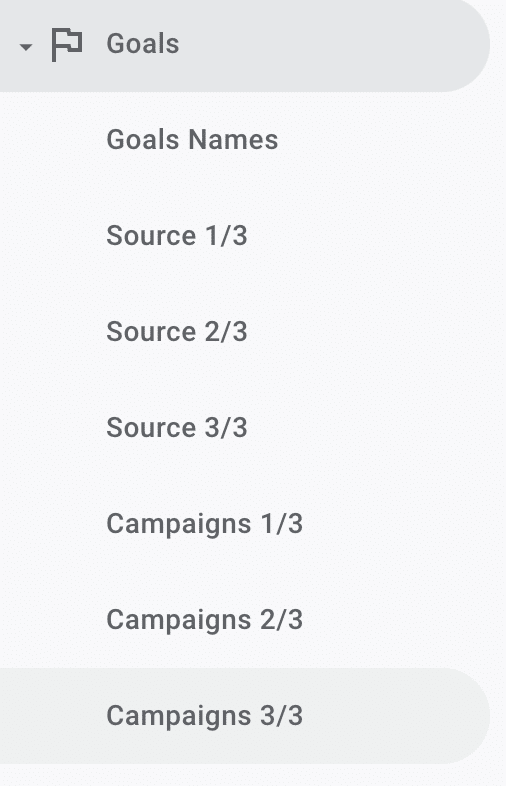
In GA3 we were allowed up to 20 goals. This report splits our goals into three parts for both sourced medium and for campaigns.
Our goals can be further customised to our liking. We just need to head back into the editor, select the goal table, and choose the metric we’d like to edit. In this instance, let’s change the name of our goal to ‘Search Result View’.
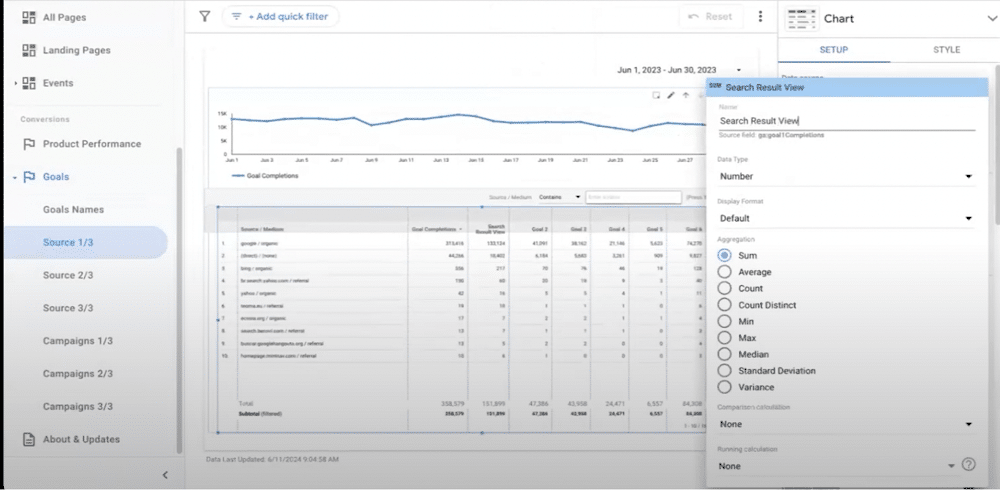
Now, instead of being named ‘Sample Goal Name 1’ our goal is more easily identifiable. 12
Using the Google Sheet
From the Google Sheet, you can quickly access all the data you need. From the toolbar at the bottom, we can view all result tables.
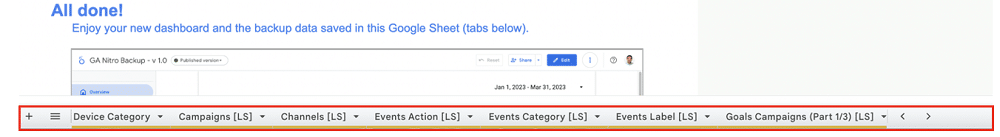
By choosing ‘All Sheets’, you can also navigate to ‘Source Medium’. This page contains all the data that is being used by Looker Studio.
Utilizing these features in GA4
Last year André launched ‘GA4 Classic Mode’. Thanks to this, we can now not only visualise GA3 data but also GA4 data. Andre plans to launch a new extension to the Google Sheet that will also combine both GA3 and GA4 data.
Back up now
There’s still time to back up GA3 data. Why not make the most of Andre’s free solution and try GA nitro for yourself?
- Enterprise SaaS SEO – Expert Strategies, Tools, & Playbooks - 31/03/2026
- How to Set Up and Implement Cookiebot by Usercentrics - 18/03/2026
- Top 5 OneTrust Alternatives for 2026 - 12/03/2026