Google Analytics vs Snowplow: Should you Switch?

Looking to move beyond GA4 and advance toward warehouse-based analytics? In this guide, we’ll be discussing Google Analytics vs Snowplow. We’ll look at how the latter can help you on the path to warehouse-native analytics.
This article is a webinar write-up for the GA4ward talk by Freddie Day, Solutions Engineer at Snowplow. You can find his slides here and a recording of his talk below.
5 main challenges with Google Analytics
Five main challenges are encountered when users mature on their GA journey.
1.Vendor lock-in to Google
Should you wish to analyse your data outside of Google Analytics, you are forced to export it via BigQuery. If you’d like to export this to further data warehouses (eg. Snowflake or Databricks) there will be significant associated costs.
2. Limitations in data collection and governance
There are many limitations associated with the kinds of data you can collect. Many Snowplow customers have complained about the amount of properties that can be sent with individual GA events. There are also significant issues associated with visibility and restrictions around governance.
3. Lack of complete real-time streaming & analytics
Customers who have migrated to Snowplow also took issue with the lack of real-time streaming in GA4. This meant that they were unable to unlock more real-time use cases. This included real-time personalization and recommendations.
4. No built-in data control/monitoring
An absence of data control and monitoring means significant data engineering is needed to cleanse low-quality data collected by an improper setup.
You will need to spend time unpicking GA logic once data has landed within the warehouse if tracking is not setup properly in the first instance.
5. Black box modelling
The Google attribution model is mostly black box (hidden or not well understood). This is a problem as you’ll be basing the performance of your channels and campaigns on the model. You won’t see the underlying logic producing that performance.
This can be very confusing for marketers. As they won’t understand which campaigns are producing the best results.
The customer journey is changing…
The average customer journey can be broken up into many different interactions. An example of this can be found below. In this instance, a user is looking to purchase an item from an e-commerce store. Understanding and optimizing these interactions is a key part of customer lifecycle marketing, which helps businesses retain customers and increase their lifetime value.
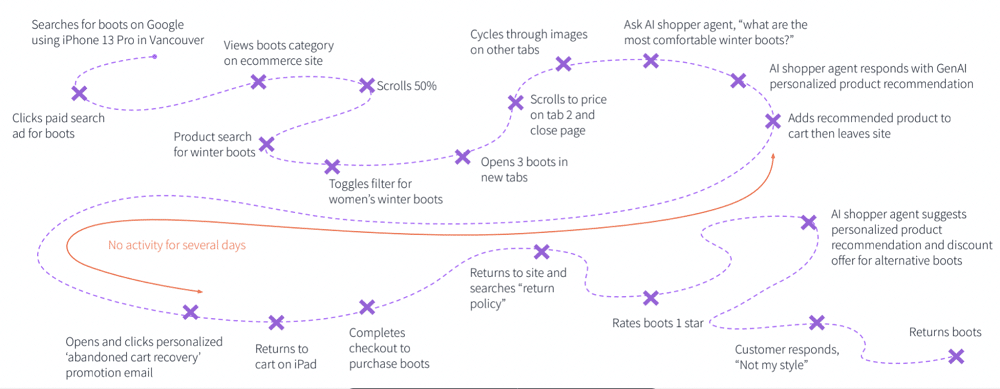
In the image, we can see two distinct user journeys. Ultimately, neither journey results in a conversion, they leave with an item in their basket. There’s then a period of inactivity for several days, but eventually, they return and purchase a product.
The time frame of this journey will impact Google Analytics’ interpretation. It will either be interpreted as containing two users or one user. If the period of inactivity is significantly longer ITP regulations will ensure that the cookie associated with Google Analytics is reset.
This means these two user sessions will look like two users performing one session. If you go on to perform use cases on top of this data, you’ll get incorrect results.
And costs are increasing
This is another challenge with using Google Analytics with BigQuery and egressing data to other platforms. As mentioned, this process can be highly expensive. This can add up quite significantly when dealing with a large volume of events.
HelloFresh recently released a blog on this topic. The company is processing significant amounts of data, resulting in significant costs. Below is a quote from the blog, underlining the problem:
“BigQuery gets very costly when it comes to compute and outbound data transfer (egress) if not done mindfully. The processing cost can vary from $5/TB to $7/TB and egress cost can vary from $0.12/GB to $0.19/GB.”
The benefits of Snowplow
This is where a tool such as Snowplow becomes extremely useful. Below are some of the benefits to bear in mind when comparing Google Analytics vs Snowplow.
- Warehouse-first data connects all touchpoints – It’s very easy to integrate behavioural data collected via GA or Snowplow with other sources. If you want to send that data to further destinations, you can do so using an ETL tool. The warehouse provides a singular source of truth that combines all data sources.
- Power real-time use cases – With BigQuery and Snowflake, the tool can deliver validated and enriched data in its raw format. It can do this in 3-5 seconds.
- GDPR-compliant solution – You can integrate with consent management platforms with ease. This ensures that tracking is only initiated when a user provides consent.
- First-party cookies live longer – First-party cookies are set by Snowplow on the server. This means the tool can circumvent ICP regulations, ensuring cookies can last up to 400 days. If a user takes two journeys to convert with a significant time between each journey, it will be interpreted as a single user.
An overview of Snowplow’s architecture
As you can see from the image below, this is divided into four different sections. These are sources, collect, store, and report.
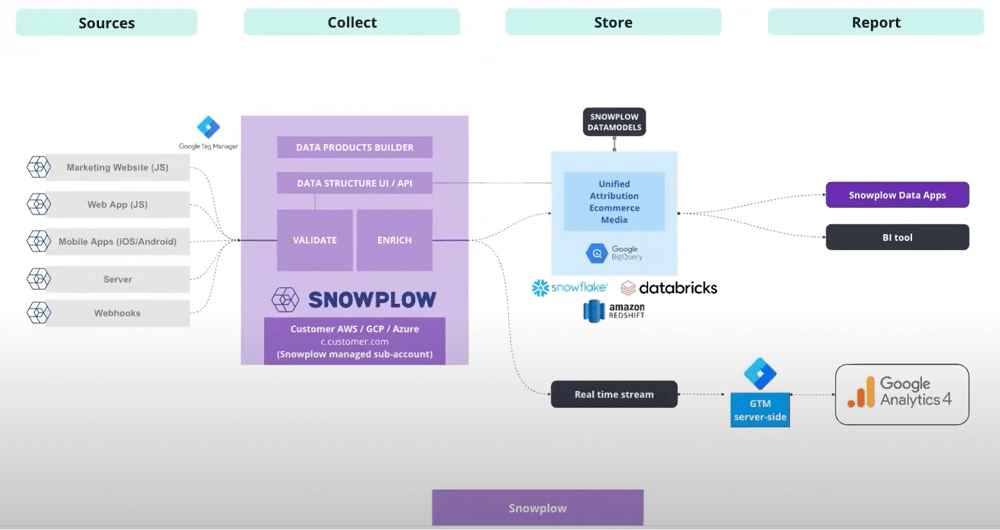
Sources
Snowplow offers 35 software development kits and webhooks. These allow you to integrate Snowplow tracking across your entire digital estate. This can be done natively via trackers in the code base or using a tag management solution.
Collect
Once data has been created, it’s collected and sent through the Snowplow pipeline. There are important distinctions to make around the deployment model of the pipeline.
Snowplow can be deployed within a private SaaS configuration. Regardless of whether you are on AWS, GCP, or Azure, you can host the entire pipeline infrastructure within your cloud sub-accounts. This provides you with true ownership over your data.
There is also a SaaS-based model where Snowplow hosts its architecture on your behalf. Data is then loaded in real-time to platforms such as Snowflake, Databricks, or Amazon Redshift. Within this pipeline, there are two main components: validation and enrichment. Let’s explore both.
Validation
Snowplow validates data that was created at the source against specific criteria. This means that if data is in the incorrect format it will fail validation. This doesn’t mean that the data is lost, but that it will land in a failed events bucket.
It can then be corrected and reprocessed. This ensures that all data that is created at the source will reach the end destination.
Enrichment
After validation, Snowplow provides some basic enrichment. This looks up geographical information based on a user’s IP address. The tool can also remove PII. If you don’t want to send raw data to the warehouse it can be hashed and obfuscated.
Snowplow also offers campaign attribution enrichments. This can be useful for a variety of scenarios, such as parsing out UTM parameters and bot detection.
Store
Once the data has been validated and enriched, it will be loaded into your end destination. This will usually happen in real-time but there may be a slight delay depending on your destination.
You can then look at modelling the data using Snowplow’s DBT models. Snowplow offers several models, here are a few examples:
- The unified model helps you develop more 360-type customer use cases. This model joins data based on user identifiers across your website and mobile applications. This enables you to model attribution for marketing-based use cases based on an attribution model.
- The e-commerce model – Provides a better understanding of users’ journeys, cart interactions, purchases, etc.
- Media model – Helps to understand user consumption of videos and advertisements across your digital estate.
Snowplow also offers a real-time stream that can be hooked up to a GTM serverside container. Your data can then be sent to GA4. This is a great option If you have people in your company who are still weighing up Google Analytics vs Snowplow.
Report
Once data has been modelled, you can create visualisations using a BI tool or using Snowplow data applications.
A demo of basic track on Snowplow
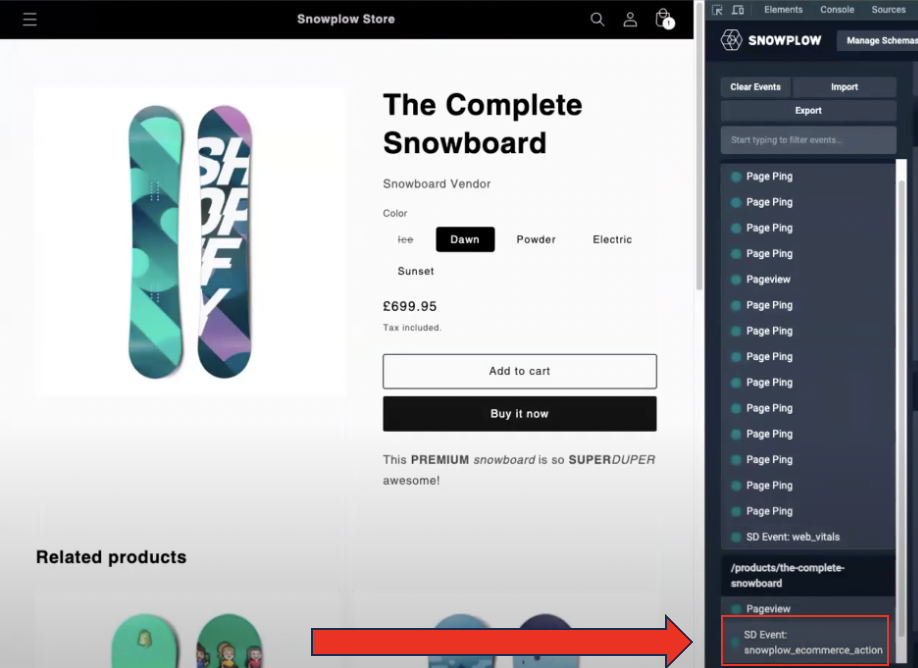
On the left-hand side of the image below, you’ll see a snowboarding e-commerce site. On the right of the image is the Snowplow inspector. This visualises events as they are created in real time.
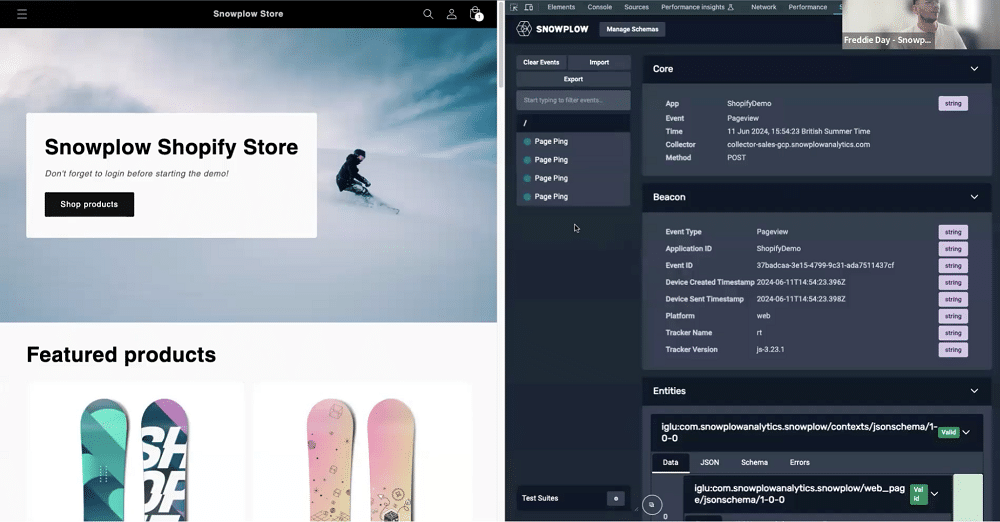
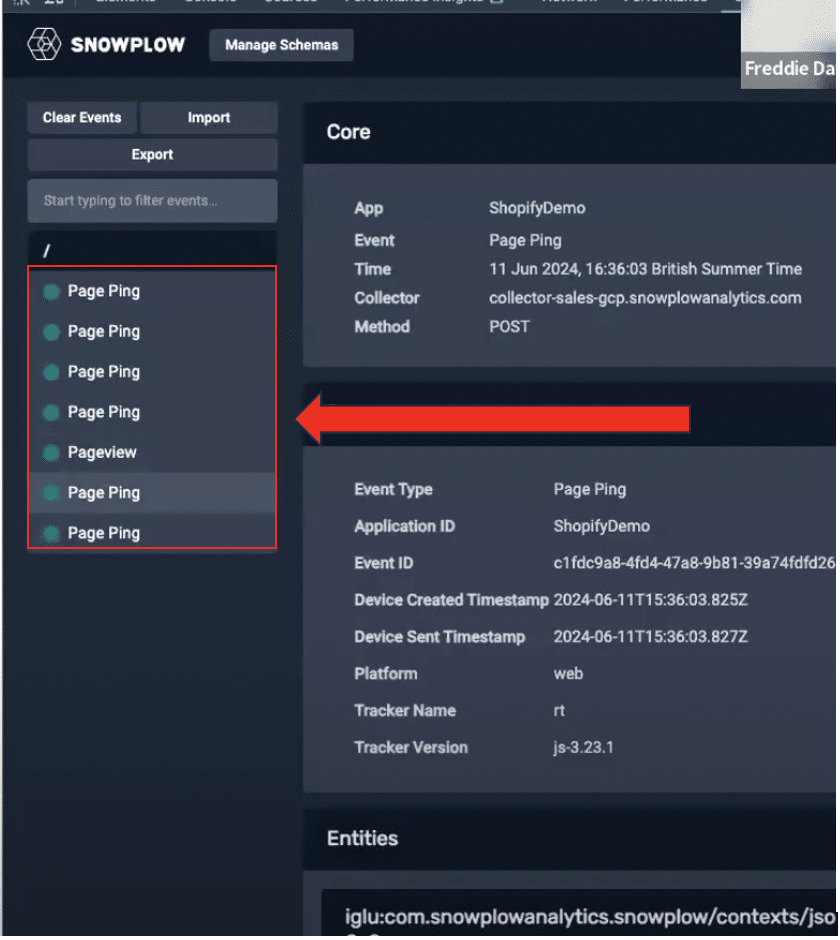
On the left of the screen on Snowplow, we can see a list of triggered events. As we scroll down the page, ‘page ping’ events are being registered. These can be aggregated within the warehouse to show how long a user has engaged with a particular page.
Now, let’s view a product page on the demo site. As you can see below, Snowplow has now registered a product view event.
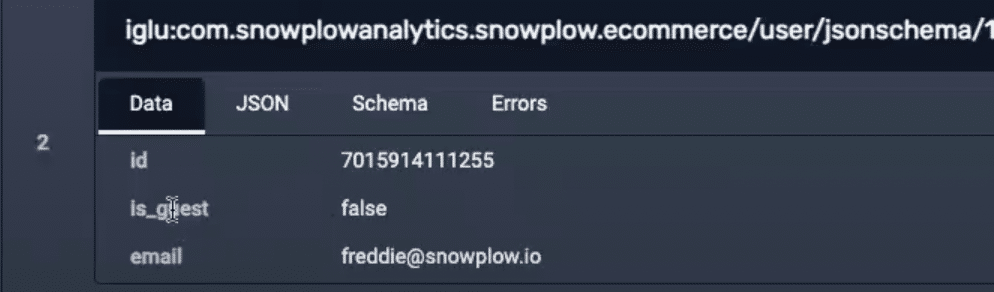
We can also view the core properties and the ‘entities’ of each event. An entity reveals the ‘what’ and the ‘how’ behind each interaction. In this instance, it tells us which product has been added to the basket.
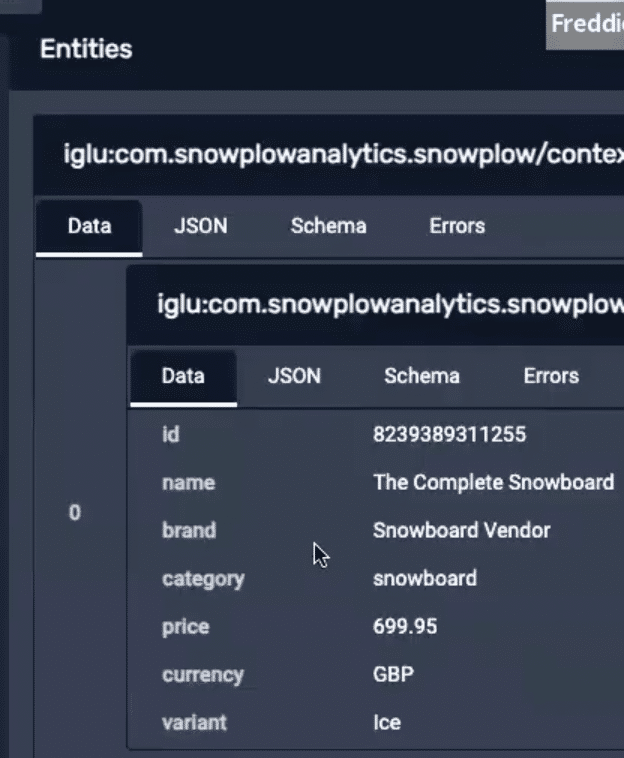
Each entity provides information about the user who completed the interaction.
Entities can be added in a modular fashion. If a user needs to add an extra property to several events they can do so from within an entity.
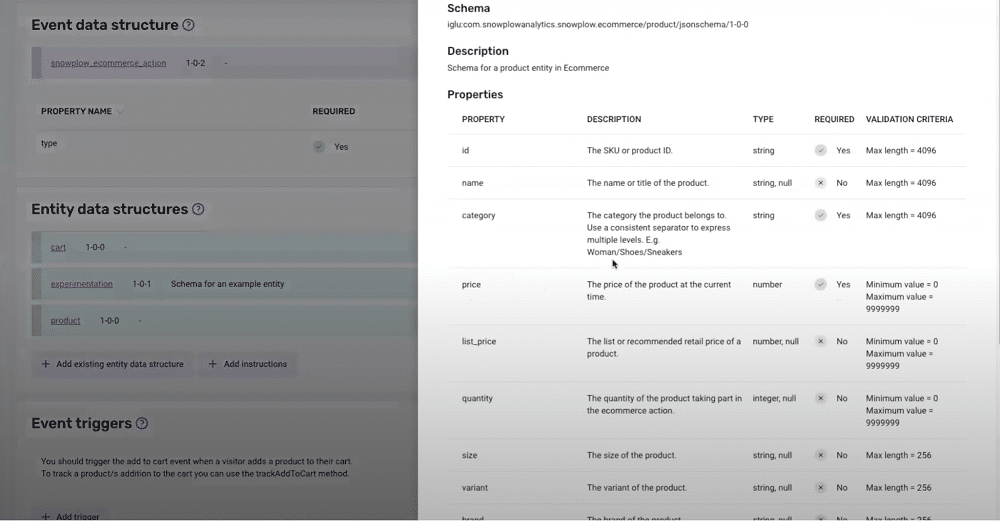
Tracking validation criteria
In the image below, you can see a basic data product set up within the Snowplow console.
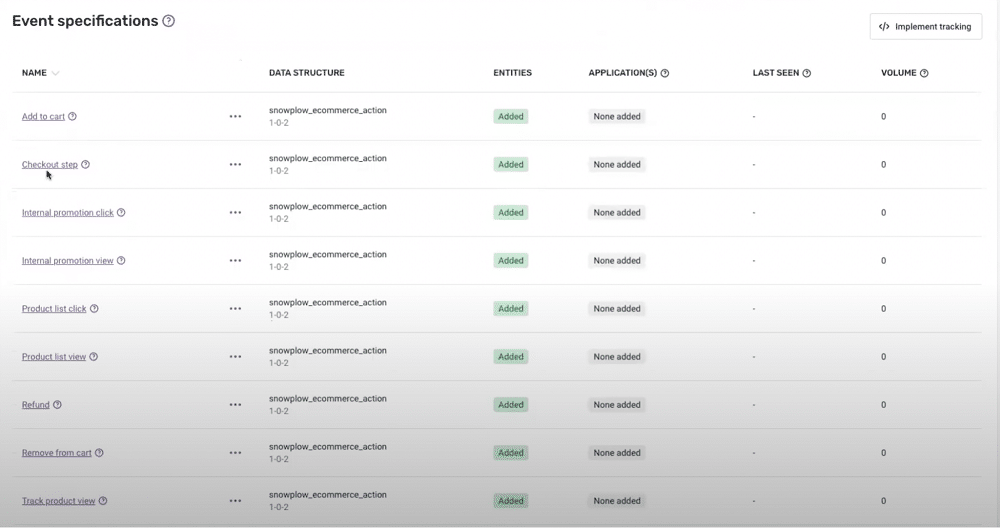
The image features several event specifications ‘Add to cart’, ‘Checkout step’, ‘Refund’, etc. By clicking ‘Add to cart’, we can view the event data structure, as well as the attached entities.
By choosing the product entity, we can view the criteria that the event has been validated against. For instance, if we sent through an event that wasn’t of type ‘string’ and didn’t meet the criteria, it would have failed. We could then repurpose or repair that ID at a later time.
Viewing data in BigQuery
Once data is validated, it will be enriched and loaded. It can then be viewed in BigQuery or landed natively in DataBricks, Snowflake, and Redshift.
In BigQuery, Data will arrive in a table known as ‘Atomic events’. Regardless of whether data was created via a mobile application or web source, it will land in the same table. This means there will be far fewer joins needed to bring sources together.
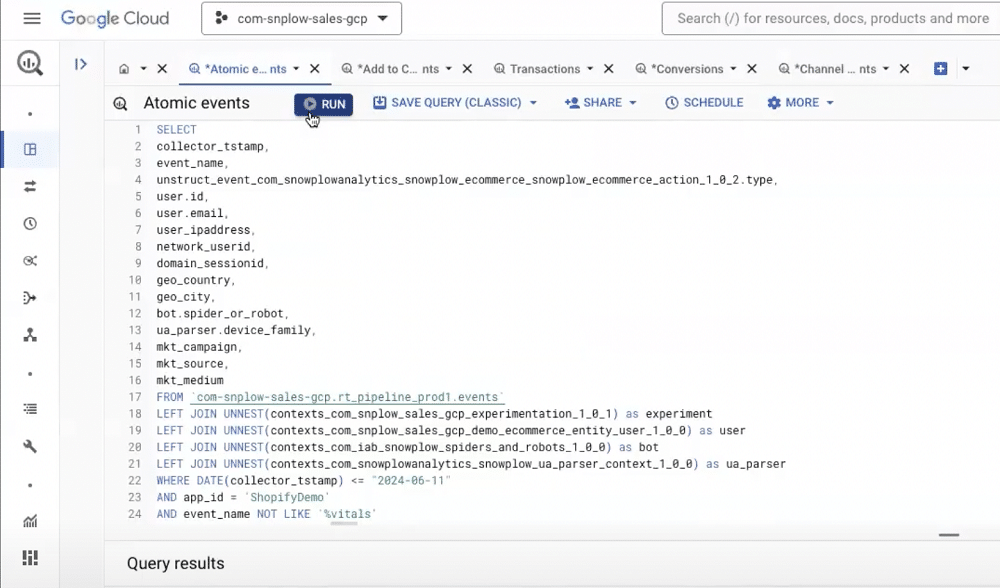
Snowplow offers 130 properties out of the box. You can add additional properties using entities or attach properties to individual events.
From within the atomic events table, you can view events arriving in real time. We can view the event names, event details, user IDs, and email addresses.
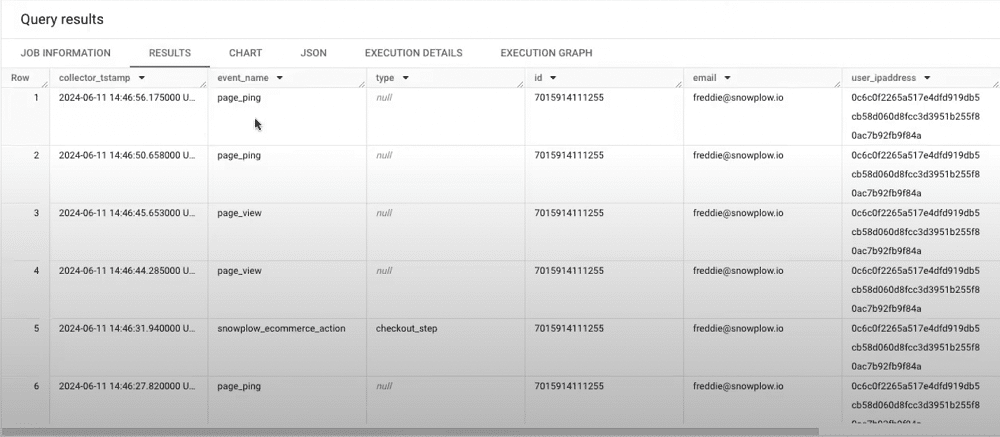
If we scroll further to the right, we can view additional information, such as the IP addresses of users. In this instance, the data is obfuscated using the PII pseudonymisation. We can also view the network user ID and session ID.
The session ID can be aggregated to show events that occurred at a given time. This is one advantage when comparing Google Analytics vs Snowplow. Unlike in GA4, you configure this to expire after a chosen period of inactivity. This also does not reset at midnight.
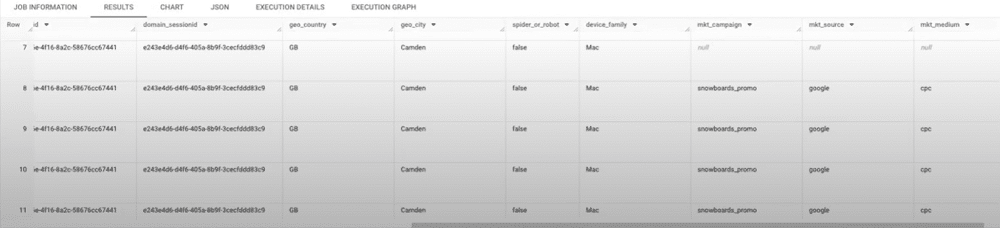
Scroll even further to the right, we also see that we’ve added an IP lookup enrichment. This shows the country and city of a user. We can also see that the event was not triggered by a spider or bot.
Lastly, we can carry out attribution modelling within BigQuery by parsing out the UTM parameters from the URL. As you see below, we’re provided with a campaign, source, and medium.
Snowplow models
From within BigQuery, we can utilise Snowplow’s models. Firstly, let’s look at the e-commerce model (seen below). This is fully transparent and available on DBT. From this model, we can understand when a user converted, and the number of sessions taken to reach the conversion.
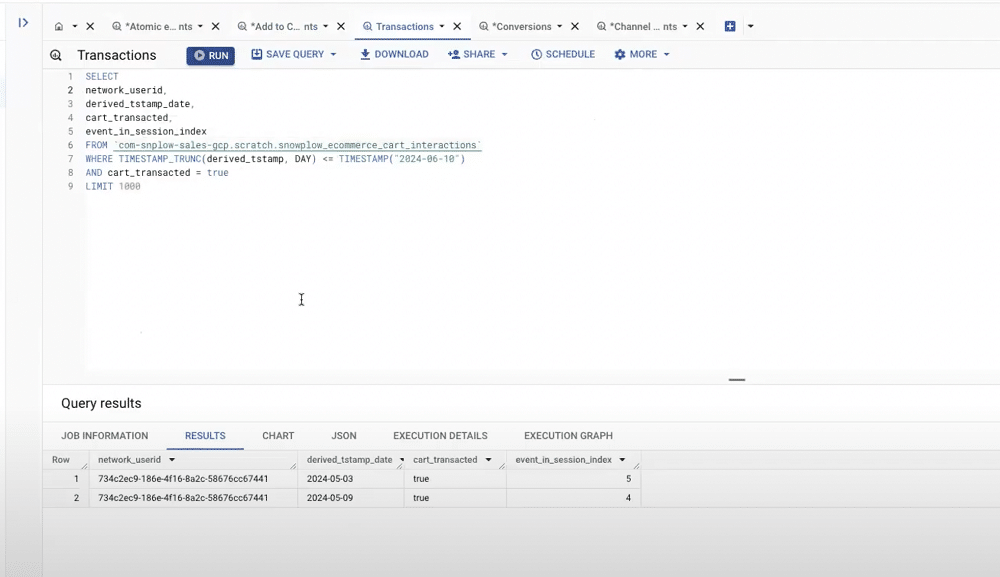
Another useful feature is the ability to view conversions based on attribution models. From here, we can attribute revenue associated with different user paths prior to conversions.
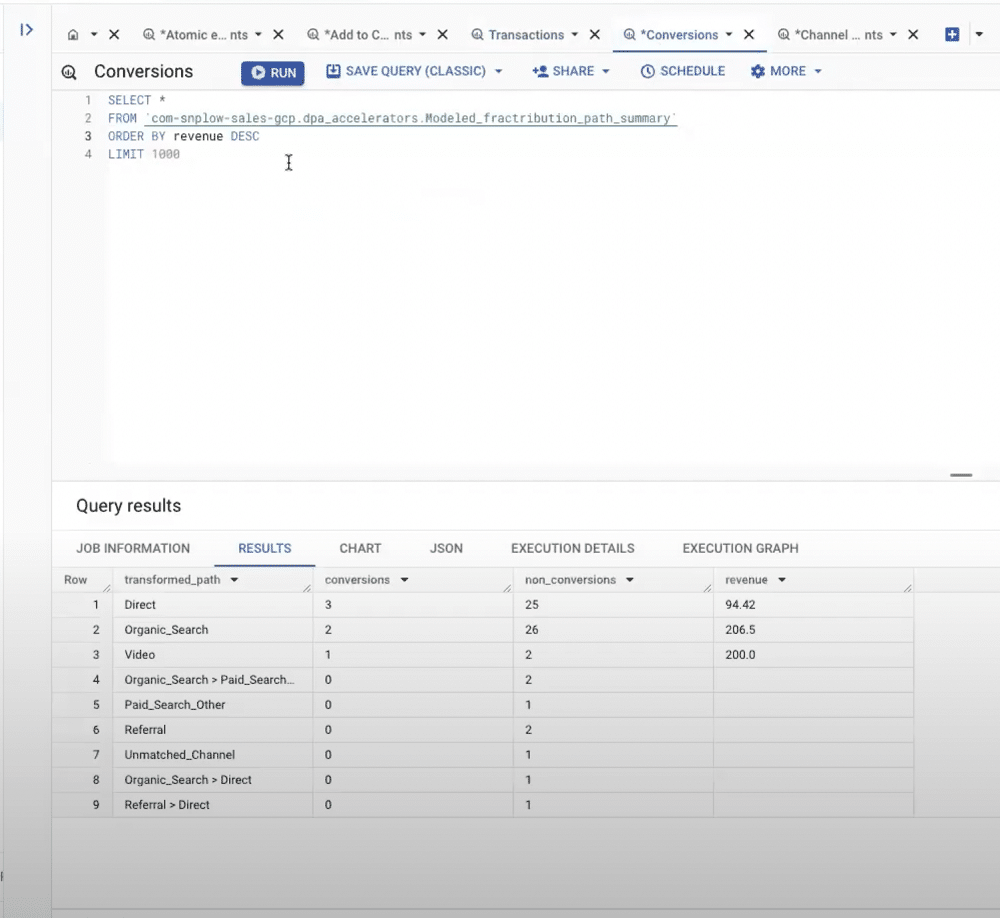
Using UTM parameters within the campaign attribution enrichment, we can also understand the number of sessions generated from different campaign channels.
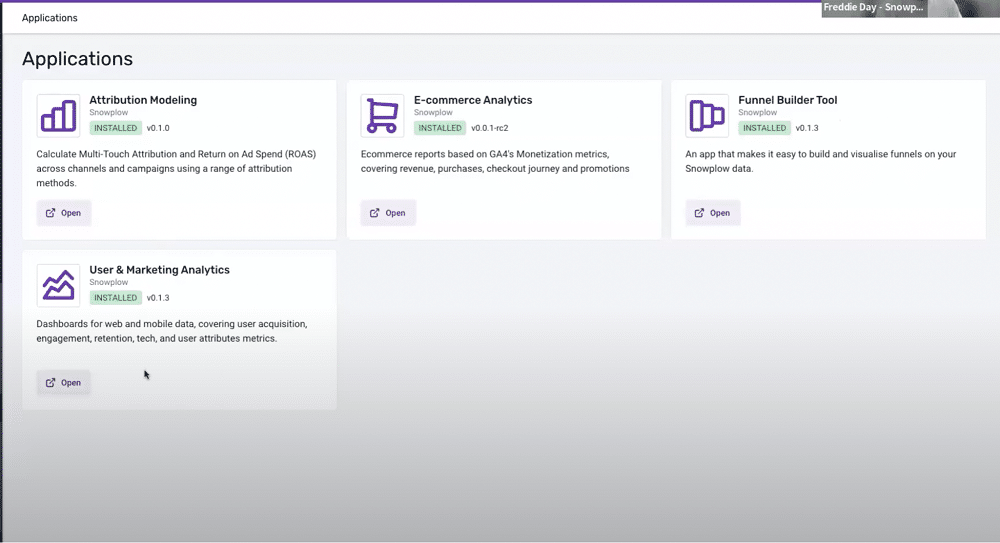
Snowplow applications
We can build on data that has been created, validated, enriched, loaded, and modelled. Snowplow currently offers four applications to help us do this. Let’s look at two examples.
Attribution modelling app
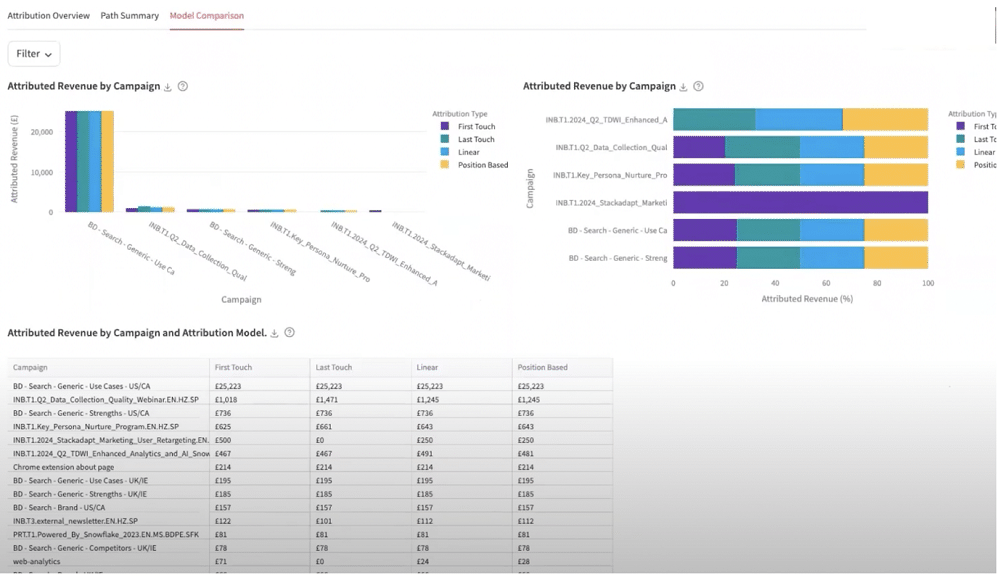
The attribution modelling dashboard reads data directly from our data warehouse. From here, we can track key metrics, such as conversion count and return on marketing spend. If we wanted to, we could also add spend source data from the warehouse. By following a simple schema, we then gain an understanding of all our different sources.
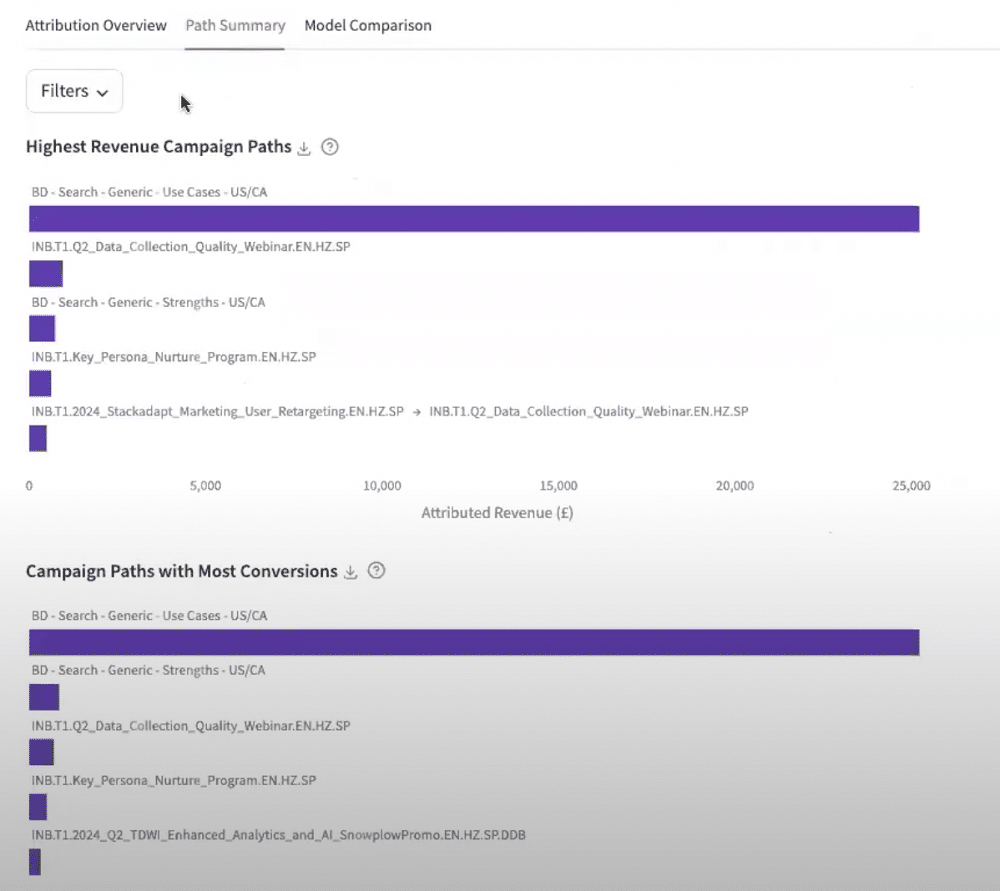
We can also look at ‘Path Summary’ to understand a user’s path to conversion. The summary can be filtered to remove paths that had only one touch point. This provides us with an overview of different user paths leading to conversions.
We can also look at ‘model comparisons’. This helps us to gauge the performance of the different models that we’ve created. Out of the box, you can look at first-touch, last-touch, linear, and position-based models, however, there is also the option of adding additional models.
Funnel builder app
The funnel builder application helps us visualise the average journey of a user through our funnel.
Let’s go back to our earlier example of a Snowboarding e-commerce store. Imagine that we are trying to find the number of users that started on the homepage, added a product to their cart, and checked out. Using the model we can track these journeys and spot any drop-offs that might occur.
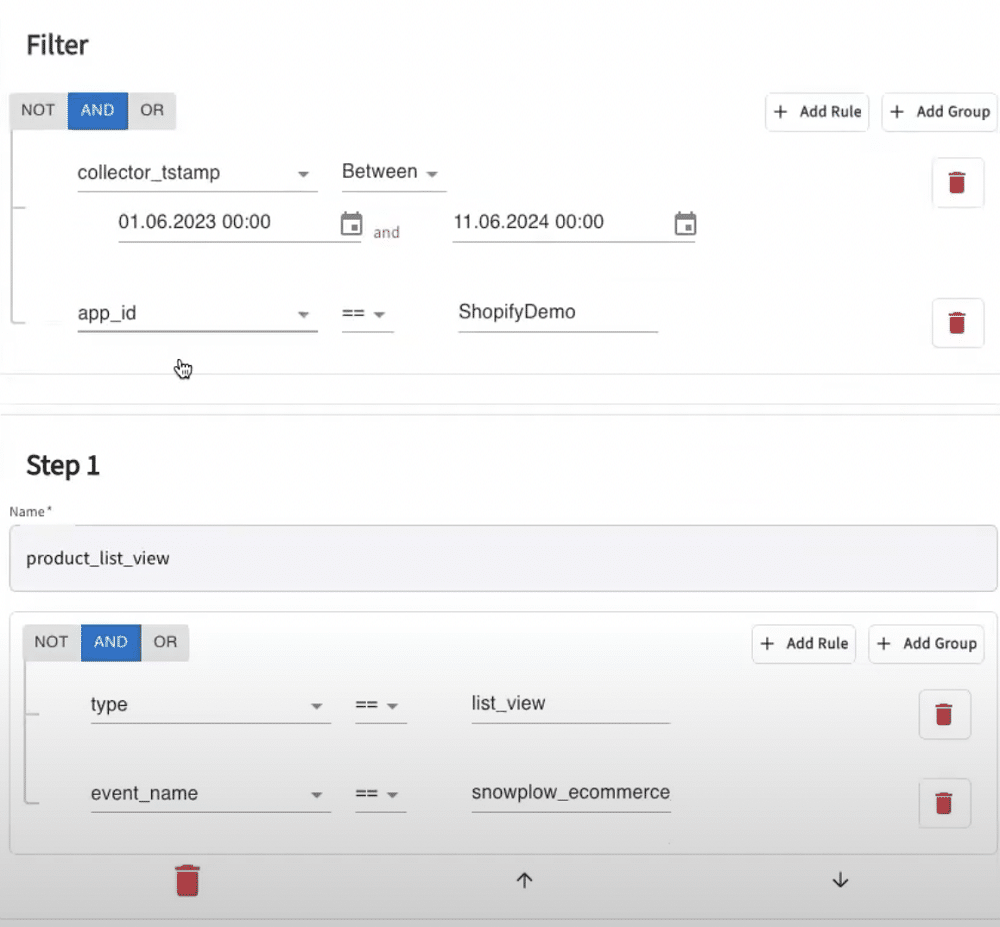
To do so, we’ll set up a criteria. We’ve added the timeframe that we would like to track, as well as a series of steps for the funnel. We’ve also specified a specific application ID, which enables us to track a specific store or mobile application.
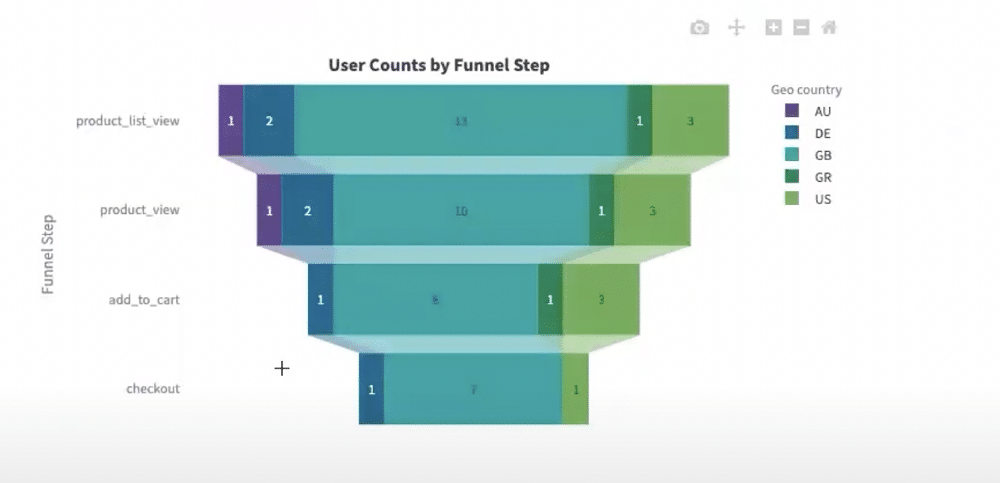
After defining our funnel, we can visualise the user journey. We can see the number of drop-offs occurring at each stage. We can also choose to filter by geographical location to view drop-offs by country.
From this application, we might also choose to perform A/B tests. This helps us to understand how one funnel is performing against another. Or, you could understand the Propensity for a user to purchase a product depending on the campaign or channel that their session started on.
Another important feature is that we can download the SQL associated with a funnel. This download can then be utilised elsewhere within a business. A user could do this natively within the warehouse, or build specific UIs using a BI tool.
Case study: Trinny London
Trinny London came to Snowplow with a simple use case. They wanted to improve their marketing attribution and become more GDPR compliant. Comparing Google Analytics vs Snowplow, they decided that the latter would help to achieve this goal.
The company had issues creating touchpoints across its digital estate. Thanks to Snowplow’s long-lasting server-set cookies, they could create a more accurate view of their multi-touch marketing attribution. The technology easily fitted into the company’s tech stack, as they were already looking to integrate GA4 with the Google Cloud Platform.
The company is deployed within the private SaaS model. This enabled them to have end-to-end ownership over their data and ensure GDPR compliance.
In Summary
Hopefully, this article has cleared up some of the questions you may have about Google Analytics vs Snowplow. As we’ve explored, there are many ways that the tool can help as you advance toward warehouse-native analytics. If you still need convincing, why not give Snowplow a try for yourself, and book a demo today?
About Freddie Day
Freddie is a Sales Engineer at Snowplow, where he has worked for two years. Previously, he served as a Solutions Architect, gaining hands-on experience in helping Snowplow customers derive immense value from the product. His diverse background includes technical support, customer success, professional services, and sales.

- Top 24 Google Analytics Chrome Extensions & Sheets Add-ons - 21/05/2026
- Best Consent Management Platforms (CMP) - 19/05/2026
- Google Signals and Consent Mode: What This GA4 Change Really Means - 23/04/2026