Ecommerce Data Analytics: 3 Ways to Drive Revenue in GA4

This article will focus on eCommerce data analytics. We’ll look at some of the best revenue-generating activities you can do in Google Analytics 4 (GA4). We’ll also explore some of the broad strategic ‘must haves’ to include in your workflows.
Hopefully, by the end of this article, you’ll have gained some of the following skills:
- Skill #1 – How to use GA4 insights in your measurement strategy
- Skill #2 – How to start your revenue-focused workflows for yourself or team
- Skill #3 – How to gain influence and decision-power using ecommer data analytics
This is a write-up of Alex Cruz’s talk that he gave at one of our monthly webinars. Here you can find his slides. And below, you can find a recording of his talk:
Skill #1 – Creating a measurement strategy
Pause for a moment and ask yourself if you have a measurement strategy. People often measure certain metrics and have two or three spreadsheets, but lack a coherent data measurement strategy.
So, how can you create something practical? Something that isn’t a document that can get lost, and can be referenced easily?
With that in mind, we’ll look at a five-step process for building a measurement strategy.
Five-step process for building a measurement strategy
1. Have an objective
Where are you going as a company? What’s your reason for existing? Once you have an objective, write it down.
2. Choose your KPIs
Pick your most important metrics (under five).
3. Make targets
Quantify your metrics, select a time range, and set a goal.
4. Segment your data
Take your targets and segment them down. If your goal is to get $1 million by the end of the year, how much will come from repeat customers, new customers, etc?
5. Look at your baselines
Where have the segments been for the last significant period of time? For example, what does the trend look like over the past six months? You should also look at the seasonal component if it is relevant to your use case
Case study: Sweat Symphony
Sweat Symphony is a fitness apparel and equipment company. We’re going to assume that this company is selling eCommerce products.
Setting objectives
Their objective is to become a market leader in cross-fit apparel. To meet this goal, they’ve selected the following KPIs.
Setting KPIs
Note: These KPIs are ranked in order of importance. Make sure you rank your KPIs and that your executives are in line with what you think.
- Net revenue – 99% of the time a revenue-related metric is given top priority.
- Coster acquisition cost (CAC)
- Return ad spend (ROAS)
- Conversion rate
Setting targets
Next, we’ll set targets. Each KPI will get an end-of-year target. For total numbers like net revenue, you will have the absolute value. But for CAC and ROAS, it’s better to pick an average.
Selecting segments
We will then select segments. This is where a lot of the opportunity is found because you are anchored to something.
For example, you might focus on net revenue, you may also prioritize new customers. This way, when you allocate activities, we know which activities generate new customers. You can start getting much granularity in your insights.
Setting baselines
Finally, you’d set baselines for each of your KPIs.
When this all comes together, it looks similar to the image below.
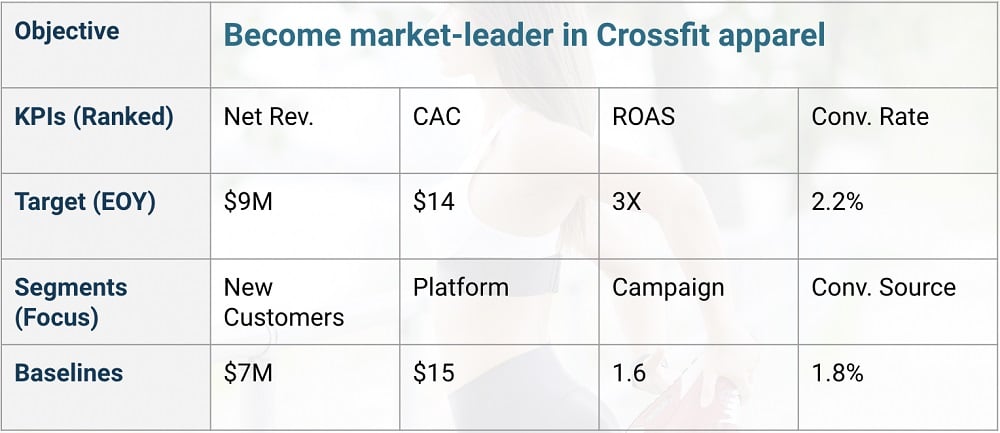
As you can imagine, a measurement strategy can become much more complicated than this. But following a similar approach tour our example can be a great starting point.
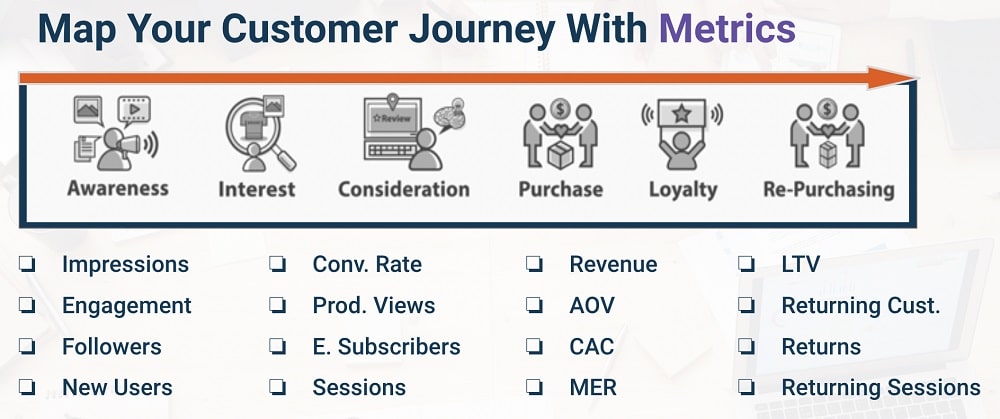
Mapping your customer journey with GA4
A key part of eCommerce data analytics is mapping and optimizing customer journeys. To help with this, we’ll look at a handy activity sheet (shown below). For each section, we’ll add different metrics that cover various stages of the customer journey.
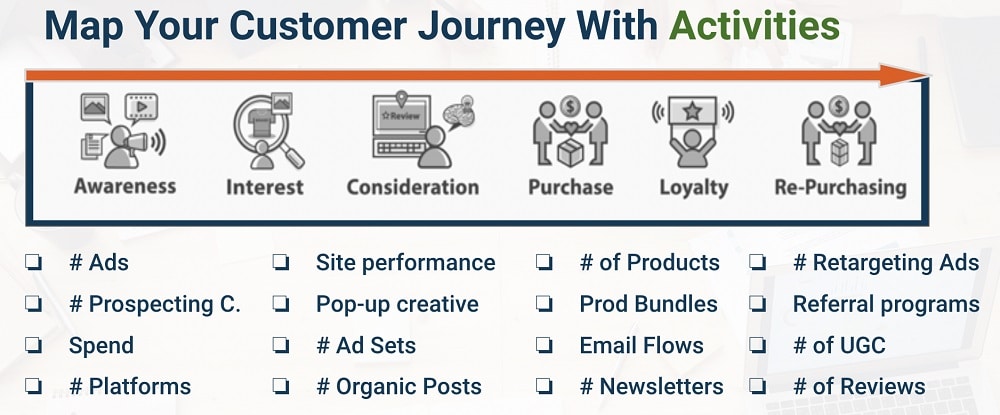
How can GA4 help us?
GA4 is very good at segmenting. Looking at segments, we can map our customer journey based on activities. GA4 allows us to look at these activities in detail, see what’s happening, and how we can improve.
Again, included all this information in our customer activity sheet.
Common measurement strategy mistakes
Common measurement strategies are important, but it’s also very easy to make simple mistakes. Below, we’ve put together some of the top measurement strategy mistakes.
- Not creating a measurement strategy
- Not associating activities with growth
- Lack of A/B testing
- Not using a supportive UTM naming structure
- Not following business-level metrics
Skill #2: Creating revenue-generating workflows:
We’ll look at a workflow for Sweat Symphony. Their problem is that the company is losing market share. They need to focus on customer acquisition to sustain growth.
To deal with this problem, we need to create a hypothesis: If Sweat Symphony focuses its budget on promoting its best-selling products to interested users, then it will hit its KPI Targets.
Their workflow uses the following steps:
- Create an audience segment in GA4 for those likely to buy:
a. People who visited our top-selling product pages (Backpacks)
b. (and) Did not purchase - Send this Audience to Google Ads for retargeting
a. Create a Campaign with Backpack creative to target visitors who are likely to purchase and increase new customers
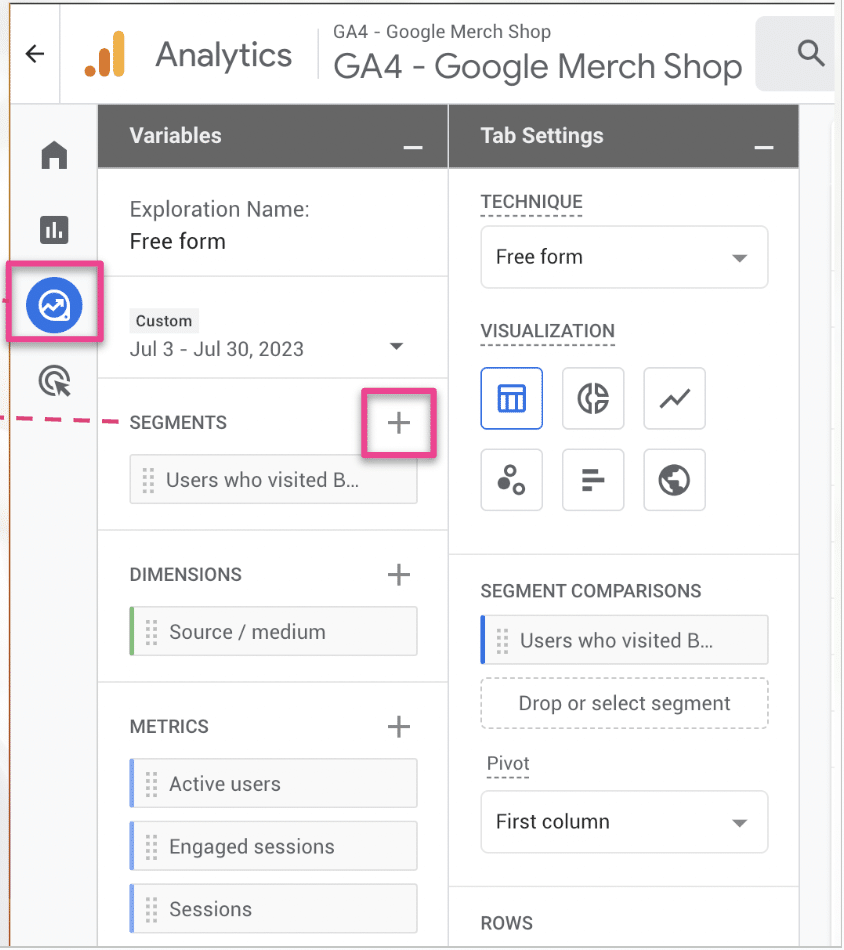
Let’s jump into GA4 and see how this is done. On the left-hand tab (seen below) we have a few different options.
How to create an audience segment in GA4 for those likely to buy
‘Home’, is where are basic metrics are stored. ‘Reports’ is where some of the already existing dashboards and charts live.
Go to Explore in Google Analytics
‘Explore’ lets us create our own charts. ‘Advertising’, as the name suggests, gives us advertising information. Let’s select ‘Explore’.
Create a new segment
We won’t actually be building any charts. Instead, we’ll be creating segments. To do so, select the plus symbol found next to ‘Segments’.
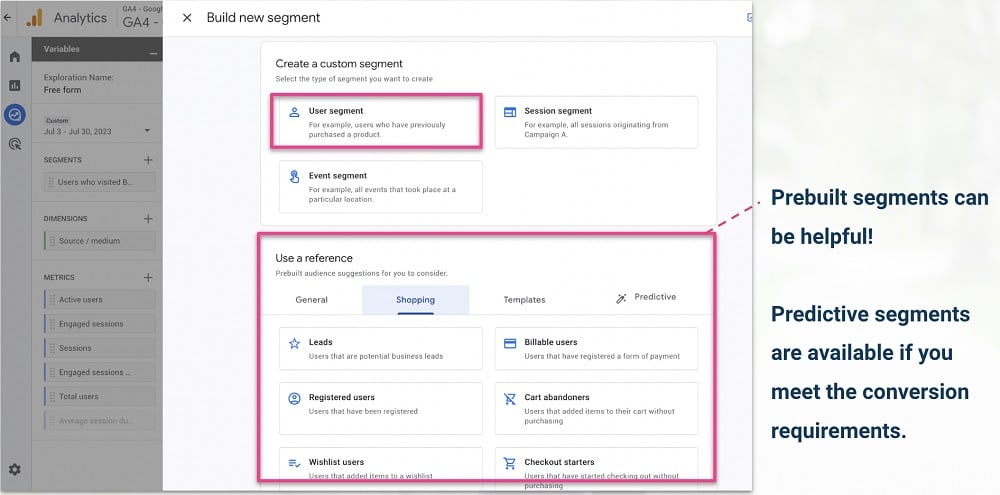
Next, we’ll select ‘User segment’.
Note: There are some great prebuilt segments for eCommerce companies. Predictive segments are also available if you have over 1,000 conversions per month.
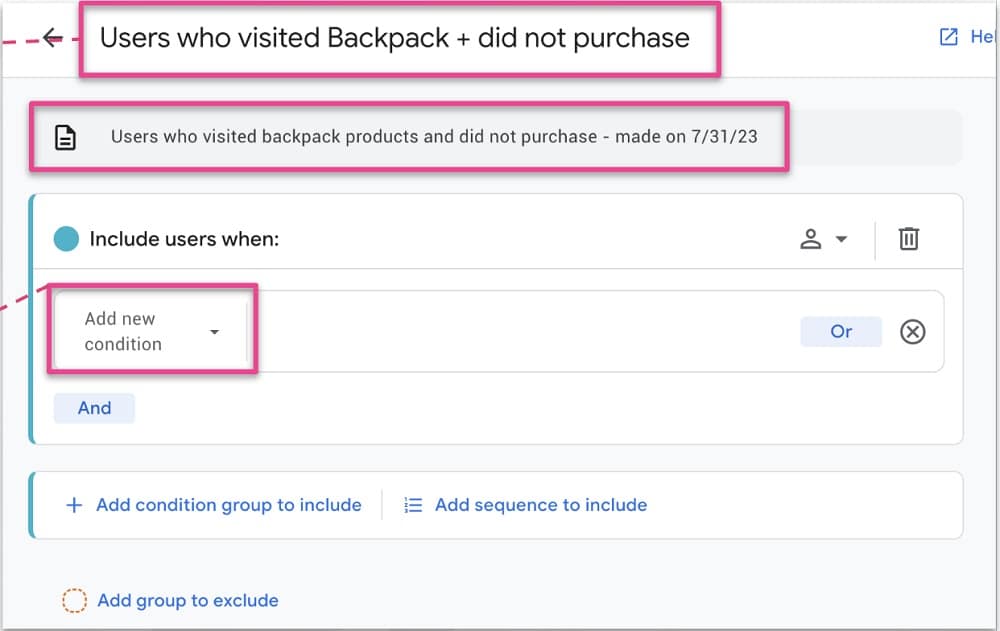
We want to be organized, so we should title our segment with a relevant name. It’s also useful to add a description for when coming back to the segment later. You may also want to add a date stamp.
Add conditions
Now, we need to select ‘Add new condition’.
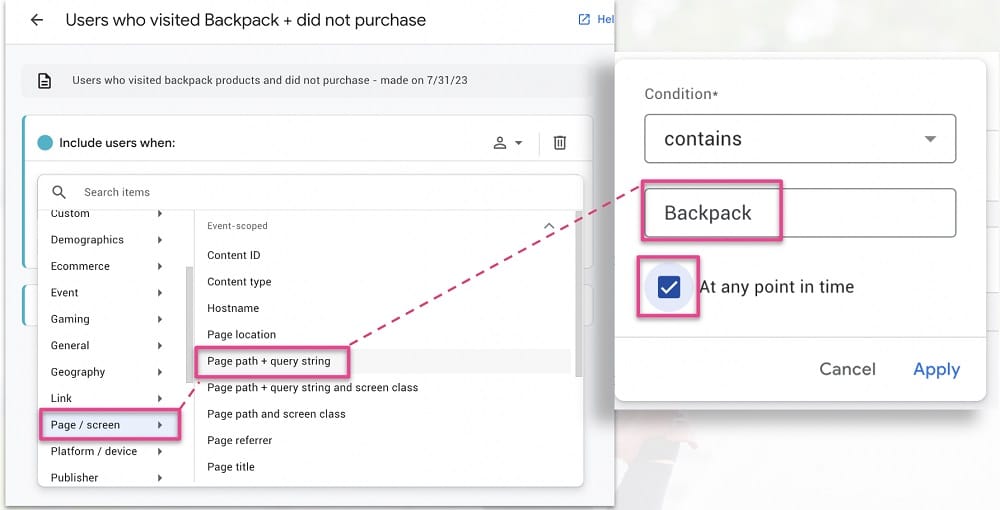
From here, you need to have a lot of familiarity with the metrics within GA4. This is one of the complicated parts of doing eCommerce data analytics yourself.
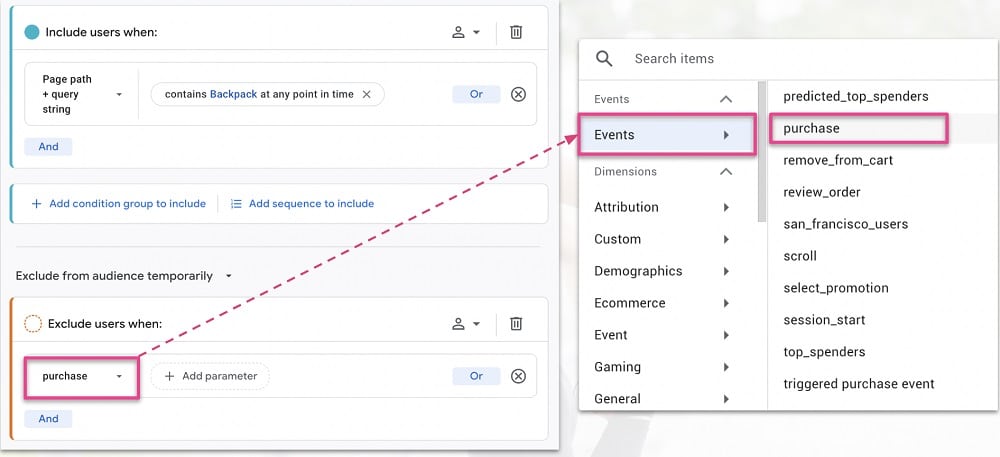
In this example, we’re going to segment based on users who’ve seen the best-selling products. To do that, we need to detect all the people that have visited the backpack pages.
We’ll go to ‘Page / Screen’ and then ‘Page path + query string’. We’ll say that all URLs that contain the word backpack are those products. For ‘Condition’ we’ll choose ‘Contains’ and ‘Backpack’. We’ll also tick the box next to ‘At any point in time’.
From the following page, we can see from the top left that our condition is ready to go.
Exclude purchase events
We can see a button titled ‘Exclude’. When we click this option, we get a drop-down menu with various exclusion options.
We’ll choose ‘Events’ (one of the features of GA4 is that everything is recorded as an event) and ‘Purchase’. We’re choosing this option because we only want to view data about users who viewed backpacks.
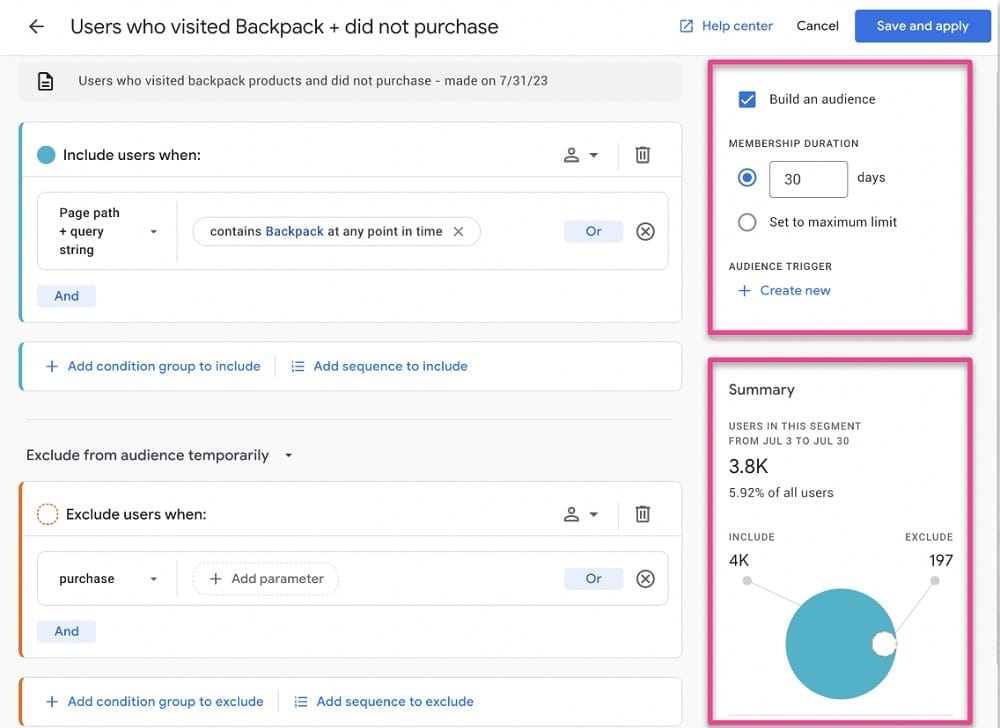
Going back to our segment builder, we can see a useful summary of what we’re looking at. From here, we can better determine whether our segment is worth targeting. Because we have nearly 4 thousand people, we can say our segment is usable.
Review and submit audience
We can now click ‘Build an audience’ in the top right. This will send data to Google Ads, which will then be able to target these users specifically. With that done, choose ‘Save and apply’.
Note: Once your segment is saved, it cannot be edited. Make sure you’re happy with your selections before saving.
Google have announced that you’ll soon be able to do this workflow within Google Ads itself. If you connect Google Ads to Google Analytics, you’ll be able to complete the process there.
Create Segments based on behavior using GA4
How can you create attributes and segments that will help your company grow and increase revenue? Below are some attributes that you should consider.
- Audience behavior
- Conversion events
- Demographics
- Acquisition source
- Etc.
Check your KPIs in your analytics Platform
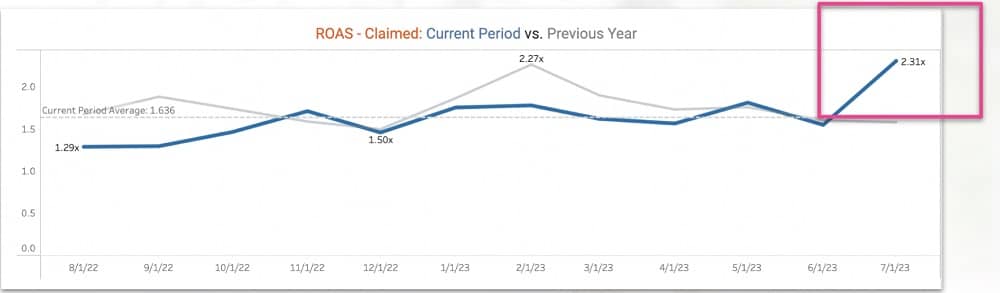
With an analytics platform, you can track your baseline and see if numbers are increasing over time. Keep an eye on your metrics and segment them down if you need to. The image below is taken from PenPath and shows the total yearly ROAS.
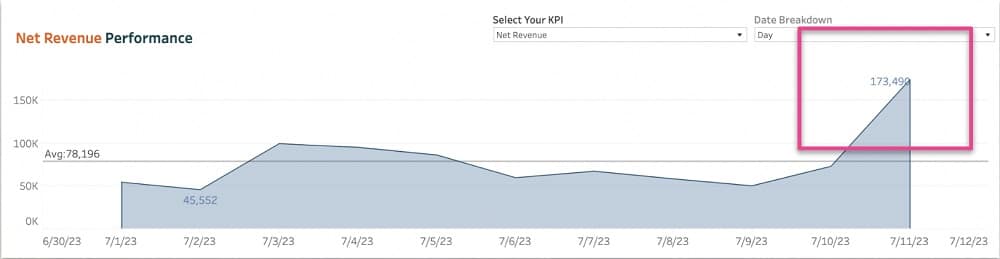
You may also want to keep an eye on your net revenue metric if this is your main KPI. How are you increasing this metric, and how is it supporting your efforts?
As you do this over time, you’ll start to generate momentum – you’ll keep evolving getting better and better at this process.
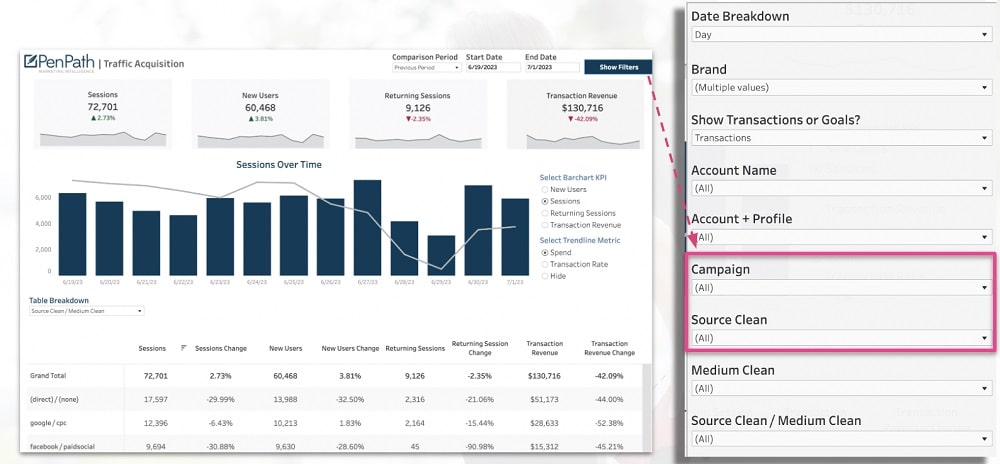
PenPath GA4 acquisition dashboard example
One of the best aspects of the PenPath dashboard is that you can quickly filter data. When you’re working with a lot of data, you’ll want to cut through the noise and understand the impact.
From the dashboard, you can immediately filter based on the campaign you want. From there, you can handle multiple brands and accounts.
Results
Looking back at our workflow for Sweat Symphony, we’ve gained the following results.
- Focusing on the product that brings in the most new customers (Backpacks) was successful. The ROAS and CAC were above the expected baselines.
- By doubling the spending, Sweat Symphony can monitor to see if results also scale.
Skill #3: Gain influence and decision-power using ecommerce data analytics
Whenever you’re going to a client or coworker with an analysis, make sure you grade yourself. You can use these five criteria for success.
- Novel – Your analysis isn’t obvious. For example, you might have learned that you grew by 20% in Q4. But this isn’t anything new because of the holiday season.
- Relevance – Make sure that your analysis focuses on something that will land with whoever you’re trying to influence.
- High-impact – For example, Based on baselines and historical performance, you want to allocate 5% of the budget to TikTok. If you can sustain your ROAS, you should be able to generate another $40,000.
- Practical – If you had $5 million more, and your typical spend is $5,000, this isn’t practical.
- Actionable – The activities within your funnel will help you to know what and what not to do. Make sure that you have some actionable takeaways.
Key takeaways
Let’s review what we’ve learned in this article. We’ve covered how to:
- Create a measurement strategy (all 5 steps)
- Map your metrics to your customer journey
- Map your activities to your customer journey
- Measure how activity impacts success
- Use the right insights to move initiatives forward
If you need help with your ecommerce data analytics, we’ve provided Google Analytics services to some of the largest enterprises in the world. Our team can definitely help you with any problems you’re having.
About Alex:
Alex is the CEO and founder of PenPath, a leading business intelligence platform for enterprise and DTC brands. His leadership experience spans both high-growth startups and Fortune 100 companies.

- Top 24 Google Analytics Chrome Extensions & Sheets Add-ons - 21/05/2026
- Best Consent Management Platforms (CMP) - 19/05/2026
- Google Signals and Consent Mode: What This GA4 Change Really Means - 23/04/2026