Top 22 Google Tag Manager (GTM) Tools Used by Experts
If you’re using Google Tag Manager (GTM), then you probably understand how useful GTM tools can be for a number of reasons
- Troubleshooting
- Validation
- Making quick changes
- Installing templates
- The list goes on…
So it’s important, as a digital marketer that you use the right GTM tools.
That being said, with so many choices out there, choosing the right GTM tools can sometimes be challenging. Some have similar features but a few different tweaks that can change your GTM experience. Others make huge impacts on how you use GTM on a regular basis.
To help you on deciding on which tools to use, we ask GTM experts their opinions.
GA & GTM Tool Resources Before we Start
Just before we jump in though, we did a webinar on this which is available on our YouTube channel and down below:
There are also some Slides available for your use as well.
We also made a great article on the top 39 Google Analytics tools recommended be GA experts as well if you want to check that out.
Now let’s take a look at the Top 22 GTM Tools Recommended by Experts.
1. GTM Cleaner
Keeping your GTM containers navigable and accessible to use is key to efficiency. When a container is cluttered with unused tags, triggers, and variables, it can take time to find the things you’re looking for. Also, having no naming structure can drive the same kind of issues.
Cleaning your containers in the first place can also be time-consuming. It is especially true for agencies or large enterprises with multiple containers.
But that’s where the GTM Cleaner comes in handy. Within a few clicks, you can have this tool clean your entire container in minutes.
It follows 5 simple steps.
- Optionally deletes unused tags, triggers, and variables
- Creates a Google Analytics Settings variable and references this from all GA tags
- Enables built-in variables and 5 recommended variables
- Implements standard naming conventions to make it easier to navigate your setup
- Changes all tags to once-per-page to prevent double conversions
If you don’t like the output, you can always revert. It is because this GTM tool creates a new workspace within your container. Side note… You’ll need to have no more than two workspaces for this tool to work as there is a limit of 3 workspaces per container.
It is our first thing for our clients and has saved countless hours of manual labour. Winning!
We made a great article about how to use the GTM Cleaner to clean your GTM accounts.
Check out this video to find out more.
2. GTM Lookup Table Import/Export Chrome Extension
Use the GTM Lookup Table Import/Export Chrome Extension
This is one of the more simple GTM tools. But still super handy. It’s a Chrome extension that allows you to import and export lookup table variables. Why is this handy? Well, there are many applications for the tool, so that’s up to you how you want to use it.
One application we use it for is when dealing with lookup tables with vast amounts of data. This could be the case when you have long lists of country codes or domains.
In this case, you may want to apply changes to the lookup table, but doing this manually can take a long time. Instead, you can use this GTM tool to export the lookup table, upload it into a spreadsheet and utilize formulas to perform bulk updates.
It can save you hours of manual updates, making you a more efficient GTM user.
We have a great article on importing and exporting GTM lookup tables into spreadsheets and making bulk changes. You should check it out.

3. WASP.inspector
Are you more of a visual person? I know I am. It hurts my head checking individual Google Analytics post messages in developer tools. It takes time to figure out what’s what and decipher all that text.
That’s why my favourite GTM tool has to be the WASP.inspector.
It’s an oldie but a goldie. It provides a visual hierarchy of all the beacons on your site and what events have been fired from them. It saves me a ton of time every day and hasn’t failed me yet.
You can see all the parameters you’re sending for GA events, Facebook, Pinterest, and any other tag you can think of. Give it a try!
Bio: Scott helps to grow eComm businesses using Analytics & CRO. Founder of Bedrock, an optimisation agency.

4. Adswerve DataLayer Inspector +
Use the Adswerve DataLayer Inspector +
Even though I mostly rely on the browser’s built-in developer tools, my most-used Chrome extension would be Adswerve’s Data Layer Inspector. It’s like a Swiss army knife for GTM.
You can inject your container, block, and/or another container while quickly debugging requests such as GA4, server-side GTM, etc.
In some situations, it also provides valuable tips and suggestions directly in the console (that might give you additional clues for debugging).
Bio: Julius Fedorovicius is the founder of analyticsmania.com, where he uses blog posts, videos, and online courses to teach digital marketers and analysts how to get the most out of Google Tag Manager and Google Analytics. He is also a founder of GTM/GA4 communities on Facebook.

5. GTM/GA Debugger by David Vallejo
The GTM/GA Debugger is probably the most comprehensive GA debugger available. It serves many technical use cases, but it’s my go-tool GTM/GA-related tool mostly because it’s so easy to use.
This particular GTM tool logs UA and GA4 events, and the DataLayer pushes in a convenient format. It allows developers, analysts, and implementation specialists alike to verify events are firing at the correct time and that they contain the right information.

This GTM tool organizes events and hits by page. So when you navigate to a new page while debugging, you can easily toggle to a previous page to see which events fired as a result of your click. With many other tools, you have to dig through the interface to find what you’re looking for.
Bio: Jason Dobkin is a GTM expert specializing in Google Analytics configuration.

6. Chrome Developer Tools
I really enjoy using Google’s Chrome Devtools, I think it’s really underrated. Being able to inspect page elements and create Javascript paths with the click of a button helps me when it comes to creating certain events or dataLayers.
As much as I love using Chrome extensions like DataLayer Inspector + for quick debugging. I like firing up the console, checking the page’s data layers, and getting an overview of the objects and arrays. With this, the Network tab also highlights all the files that load on a page, which helps me understand what’s being pushed in and out of the website.
Bio: Carl Ashfield is a Technical SEO who has moved into Analytics and Tag Management. If I’m not learning JavaScript, I’m hiking mountains in Wales.

7. Tag Chef
Tag Chef is a web analytics tools suite for Google Tag Manager. It allows web marketers and digital analysts to detect the competitors’ tracking, analytics strategies, and implementations.
Moreover, Tag Chef offers a “buffet” with more than 180 predefined GTM tracking configurations (recipes). These can be installed on multiple sites simultaneously in a few clicks.
All the recipes have been tested and verified by the Tag Chef team.
Also, Tag Chef can be used as a Chrome extension that allows users to visualize and analyze the activities that a GTM container performs in the local version of a website.
Tag Chef unleashes the opportunity for businesses to have a tremendous impact on their industry and revenue by
- We are conducting precise tracking and digital analytics competitor analysis thanks to a simple report interface.
- We save time and money with time-consuming, repetitive, and critical digital and data analysis activities.
Bio: Official Google Tag Manager Beta Tester and founder of the consulting and training company hyper-specialized in tag management and digital analytics Tag Manager Italia. Matteo Zambon is internationally recognized as a reference expert on Google Tag Manager, Google Analytics 4, and digital analytics.

8. Elevar
I would strongly recommend Elevar for all the businesses out there on the Shopify platform.
Elevar has automated the entire tagging process on the eCommerce stores. They have also created an automated way to use the GTM server-side tracking feature along with a 95% accuracy in data tracking.
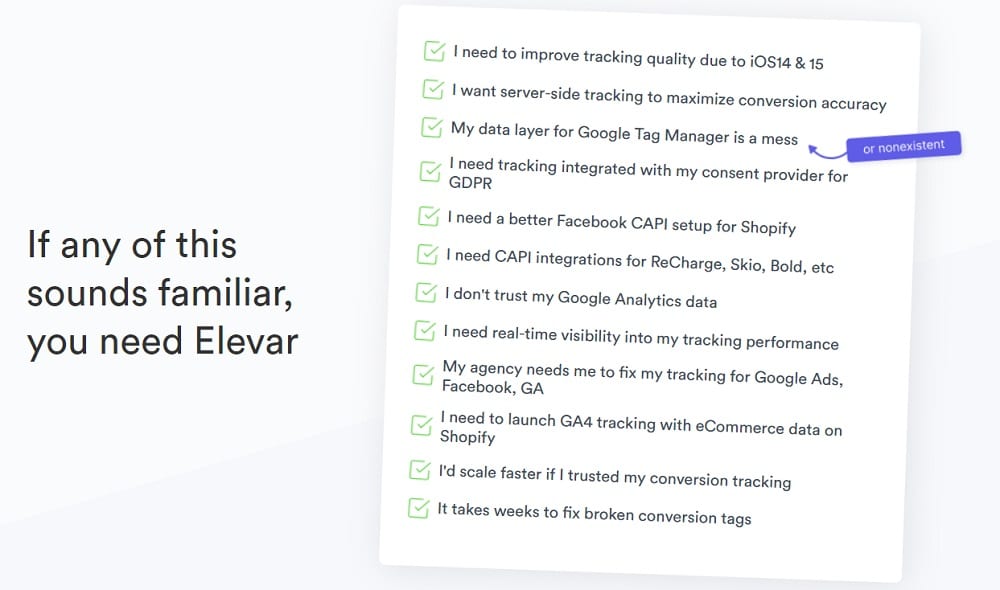
Elevar also has a Chrome extension to tag and start tracking custom events on the site within a few minutes.
Bio: Vishal Gor is a marketing analyst working in the industry for more than 5 years helping a range of businesses in the E-commerce, lead-gen, and publisher category with Google Analytics and Conversion Rate Optimization.

9. Omnibug
My favourite debugging tool. Omnibug turns raw network requests to Marketing & Analytics vendors into a user-friendly event list with vendor logos that make it easy to identify and debug.

My favourite feature: It recognizes GA4 server-side pings and shows them in the UI too!
Bio: Nitesh is an independent Analytics Consultant focused on data collection and engineering. He aids organizations with setting up behavioural analytics tools (such as Google Analytics) and streamlining raw data into a central location using tools like DBT.

10. GTMSPY
It is an excellent GTM tool for understanding what’s under the hood of any website’s Google Tag Manager setup.
I use it when wanting to do a quick audit when I don’t yet have login access or waiting for the client to grant me so. This tool allows you to export any website’s whole Google Tag Manager container without login access, including all tags, variables, and triggers as a JSON. I can get ahead to understand the scope of the project I may be committing to and provide an estimate proposal/timelines. It does not export all the tags, variables, and triggers naming conventions, so getting proper access to the Google Tag Manager will give you a clearer picture of what’s what (if the client used good naming conventions, that is).
Bio: With 10+ years of experience, Shannon mastered Digital Analytics in-house and as a consultant. Her strategic ideas and execution from ground zero to highly scalable national programs brought value to teams.

11. Charles Proxy
If you’re serious about analytics and using data, you have to be serious about data collection.
Part of that is understanding what data is being sent from your website, when it is being sent and also, where it is being sent. There are lots of great tools to help with this, but our go-to is Charles Proxy – think super-advanced Chrome Developer tools network tab.
Admittedly it’s on the advanced end of the spectrum and there are a few hoops to get it set up, but for us it’s invaluable especially when coupled with Google Tag Manager’s own preview mode.
GTM’s preview mode is great to tell you what has fired, but not if the data has been received. GTM preview mode also requires you have access to GTM, Charles lets you debug any website.

In a nutshell, Charles sits in between your browser and the internet so you can record, review or even change data being sent from a website you’re browsing.
This means you can step through a website and get a complete picture of the data being sent and you can save that session so you have a record of how this may change over time.
You can filter to just focus on a single tool, i.e. Google Analytics, from a single website – or open it up to view everything.
As well as all of this, you can debug external devices, validate hits before sending to GA, re-route data to another GA account for testing purposes or even swap out a Google Tag Manager account completely to quickly test / develop a new container.
Steep learning curve but well worth it.
Bio: John Barnes, founder of Talk Data To Me, an analytics and digital revenue agency providing digital marketing data services and CRO, with a strong specialisation on data quality & data collection.

12. DataLayer Checker
DataLayer Checker is clean, tidy and easy to use for developers and marketing purposes. You can quickly see if the dataLayer push has been implemented correctly, with all variables available.
Often it can be a valuable link between marketing, product, analytics and development teams to show values being populated through a user journey. It is simple but I like it.
bio: Dan runs Duga Digital – a consultancy based around digital data and analytics. The single aim is to ensure our clients are making better decisions and revenue as a result. As an independent there is no hidden motive or attachment – except the promise of making the best recommendations to clients.

13. ObservePoint
ObservePoint Tag Debugger validates virtually any marketing and analytics tags on your site to ensure accurate data collection across all digital analytics solutions, channels, and devices.
It’s simple, yet elegant.
The tag database is robust and makes it way simpler for spot-checking on websites. There are many times when I am proven wrong by the debugger and I catch things that I wouldn’t have otherwise.
With this GTM tool you can verify that your Google Tag Manager Container code is present on individual pages, as well as check Google Analytics tags (both page-load and event-triggered tags) are firing as expected.
Other tags, like Google Ads and Adobe Analytics, are also supported. Furthermore, icons for Analytics requests make it easy to see if a page has multiple tags. ObservePoint can help keep comprehensive and efficient governance of your analytics and marketing tags
Finally, the export option allows you to download or save your tags data locally and share to any stakeholder.
bio: Nandan Aurangabadkar is a digital analytics enthusiast with experience in setting up data platforms to enable customer intelligence, digital audience measurement and competitive intelligence across industry verticals. He likes to turn numbers into powerful insights. Nandan helps clients to put data at the heart of their business to establish a customer-first, data-driven culture.

ObservePoint Suite
ObservePoint doesn’t just have a tag debugger. They have a whole suite of tools that you may find useful. Here’s what one of our earlier experts, Nitesh had to say about it:
I have worked with a client in the past who had 60+ sites. I came across Observepoint, and it turned out to be a lifesaver.
Observepoint helps us automate site audits for all pixels and analytics tracking. You just need to configure the audit set up once and it will automatically check for all the parameters and pixels on the site at a scheduled time every day to ensure the tracking is intact.
They have a Chrome extension that allows us to audit any page. Then we can see what requests that page is sending to all the third-party platforms out there.

14. DaVinci Tools
DaVinci Tools is a viral and useful free GTM tool. A massive list of features can be utilized here, so definitely use the link above to view the Chome Extension description.
One key feature is the ability to inject tags onto an existing web page without affecting the actual site. This means that you can play around with GTM on your site without using a developer and without the risk of messing things up.
This is particularly useful for training.

It also provides many handy enhancements to the GTM, GA, and DataStudio (DS) interface. One nice touch is that it gives the ability to refresh DS reports every hour rather than every 12 hours.
But one that we find particularly useful is the sort by CustomDimension feature. It helps standardize accounts and sort attributes, especially with many custom dimensions.
15. Web Developer Toolbar
The Web Developer Toolbar is a must-have for any digital marker. Not only is it a godsend for SEO, but it’s handy for GTM and… duh… web development too!
It’s particularly handy for resetting session cookies or domain cookies.
On top of that, it also gives you the opportunity to view form information to check forms provided by CRM integrations. You may be injecting a hidden form field like GA ClientID or UserID etc. Well with the view form information feature you can just double check those injections have worked.
16. Tag Assistant
Well we couldn’t really have a GTM tools list without Tag Assistant could we?
Don’t let the big ‘legacy’ in the title of the Chrome Extension scare you, Tag Assistant is still a great little GTM tool for showing you a quick traffic light diagnostic of the tags on a page.
This is really helpful for quickly troubleshooting your Google Analytics implementation and great for getting some quick validation.
The problem is, it doesn’t always work as it should.

If you have a complex set up on a site and have two GTM tags on a site, you get a false positive and a blue warning. Also, you sometimes have to uninstall it and reinstall it to work… Oops!
Note, when you reinstall it, remember to set it to ‘always validate’ rather than ‘manually validate’.
That being said, it does still have value and is a helpful little ‘quick check’ GTM tool.
17. Tag Assistant Companion
As Google has moved away from Tag Assistant, they’ve moved more towards Tag Assistant companion.
This is to allow the GTM preview mode to work cross-domain and to work better with iframes.
When you try to use the GTM preview mode it will recommend that you install Tag Assistant Companion too.So again, it’s another tool that you should really use if you want to work accurately and get validation.

18. DataSlayer
DataSlayer is an old school GTM tool and a bit of a favourite among some of those who have been doing GTM for a long time.
It essentially gives you a history of GTM changes. The problem with Tag Assistant and just viewing the DataLayer in general is that you can’t see what has happened. It’s easier to digest DataLayers with a history of DataLayer.push changes.
DataSlayer obviously came out before the GTM preview tool V2 launched, but we still just prefer the interface that DataSlayer provides. It’s nice to quickly traverse through all the changes.
Another bonus is that it works well with Google Analytics 4 (GA4), Tealium and Adobe Launch.
That being said, David Vallejo’s GA/GTM debugger is pretty much an enhanced version of this tool. He also spent a lot of time making it, so please go a show him some support.
19. Tagmate
Tagmate automates GTM implementations. It sits on top of GTM and sets up tags, triggers, and variables in a matter of clicks.
I am not a coding expert and used to have a messy GTM. Hence, many marketers and website owners recommended I try Tagmate as it’s a low-code platform.
I can automate the tracking of any type of tag. Be it GA4 implementation, UA to GA4 migration, Google Ads conversion tracking, or even a FB Ads marketing pixels set up. And it saves a great deal of time!
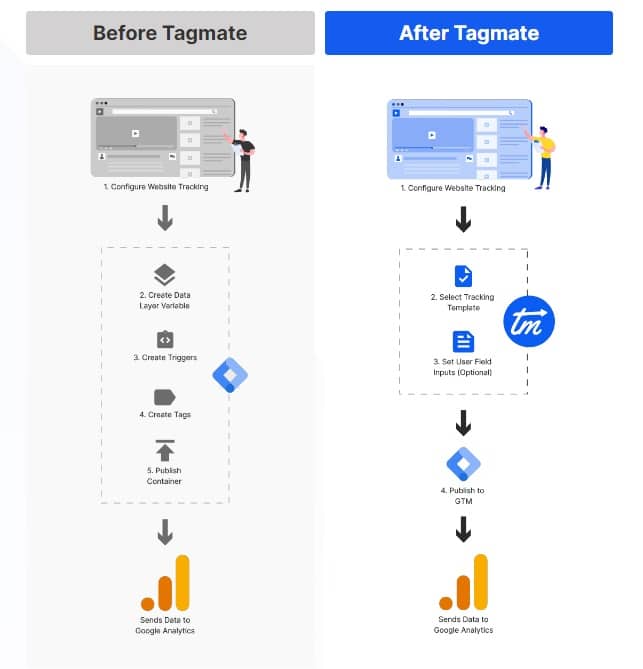
The best part about it is the Tagmate Tracker chrome extension!
With it, I can easily set up custom GA4 events without having to dig deep into the source code of the website.
So for a non-coder like me, Tagmate ensures speedy tag implementation via GTM with 100% accuracy!
Bio: Preetpal Singh is a Product Marketing Manager at Tatvic Analytics, a leading Web and Google Consulting agency that provides consultation to global clients on CRO, Web Analytics, Google Analytics 360 Suite and Standard. Post graduated from ISME Bangalore in Marketing and Operations, he works in Tatvic’s solutions team and provides growth to Tatvic’s software products.

20. GTM Tools by Simo Ahava
Simo created a really handy tool that allows you to visualise your tags and spot unused variables.
Now, this is particularly useful because unlike tags where you can sort them by the number of times they are referenced, you can’t perform the same sorting with variables. So it can sometimes be difficult to determine if a variable is being used or not and therefore whether it should be removed or not.

Simo’s tools help solve this problem by allowing you to highlight unused variables and delete them.
Just a note here… Deleting unused variables doesn’t really make much of an impact, but it is good to keep a clean GTM account.
21. ScreamingFrog in DataLayer Crawl Mode
Now you all probably know what ScreamingFrog is. And I know what you’re thinking…Yes, this isn’t strictly a GTM tool but it can be adapted into a GTM tool. Screaming Frog is super powerful and is actually one of my favourite digital marketing tools.
One feature is particularly awesome… The custom extraction feature. We use that to bulk verify DataLayers and find missing GA, gtag, or analytics.js tags across a site or series of sites.
We’d normally run it on a home page check first, then run it on a deep crawl of the whole site, then a crawl on a wide list of sites (when necessary). We tweak the custom extraction settings to look for certain things, be it DataLayer values or tag values.
So it’s great for finding inline code that needs to be moved into GTM or just validating that the developers have added stuff correctly.
Another reason why I love ScreamingFrog so much is that it’s super cheap too. Not to mention you can import a custom configuration and you can schedule it to run every week or every month and make the output come into Google Sheets or Excel.
22. GA4 Native Debugger
Yes, if you didn’t already know, GA4 now has its own native debugger. So you can actually debug your GA implementation within the Google Analytics interface. This is one of the many benefits of Google Analytics 4.
You can see every event logged along with the parameter and user properties. Having all the values in front of you like this makes everything really visible and nice to work with. So it’s great for troubleshooting and validating changes or your existing setup.
If you haven’t migrated over to GA4 yet, you should use our GA4 migration checklist to get you started. You can also use our free GA4 migration calculator to see how long it would take you to migrate.
Furthermore, our GTM cleaner tool also acts as a GA4 migration tool. So definitely check it out!
Conclusion
We’ve gathered input from industry leaders, agencies, and seasoned professionals so you can learn about their favourite tools and why they use them. We hope this curation will help you find the GTM tool of your dreams.
We would like to thank all the experts who contributed to this article.
But if you think we missed anything, then please let us know! We might be able to get you featured!
- GTM Tag Diagnostics: Check the Quality of Your GTM Container - 03/07/2024
- Adobe Launch vs Google Tag Manager: GTM vs DTM - 01/07/2024
- The Future of GA4: Where do we go From Here? - 25/06/2024