Using GA4 for E-commerce Growth

This article will share three tips for scaling GA4 eCommerce data.
- Tip #1: The measurement method that our top-performing customers use
- Tip #2:How our top customers are using GA4 in their overall data strategy
- Tip #3:How we never waste time on bad/useless analysis
This is a write-up of Alex Cruz’s talk that he gave at GA4ward MKII. Here you can find his slides. And below, you can find a recording of his talk:
So, without any delay, let’s jump in!
Meet me at the intersection

We’re at an intersection where the questions ‘what does this mean?’ and ‘How can I make more money?’ meet. When you get into the weeds of data, it’s easy to get lost and overwhelmed.
What we typically see, is executives or leaders in different companies starting the year with a retreat. They come back and say something that is aggressive in terms of their goal. ‘We must reach $100 million in EOY by the end of the year.’

The reaction of the growth team is usually similar to the image above. But quietly in the corner, you might have somebody who knows how to reach that goal.
Those that have invested time to learn tools like GA4, are part of a very small group. If you’re one of those people, executives will look to you for answers. You can reverse engineer and figure out what you have to do to reach your targets and objectives.
But looking at data isn’t anything new. Since the time businesses started, data has been a useful comodity.

Think for a moment about Alonzo Decker, a businessman who lived during The Great Depression. When the war broke out, his company, Black and Decker, was used to build tanks and other equipment. During this time, the company hired a largely female workforce.
Decker started looking at the data, He found that a lot of orders were double or triple what they were expecting. After analyzing this information, he found that a lot of his workforce was taking drill bits home. With a better understanding of his customer, he started releasing products for at-home use.
So, nothing is new in terms of data. What’s changed is the scale of the opportunity.
We now have a much bigger opportunity…

We now have a lot more platforms to work with and each tells a story. Each is a piece of the puzzle that we have to bring together. If want to look at data today we need to use Google Analytics 4 for eCommerce to show us the bigger picture.

Sadly, those that are data-savvy can often look down on everyone else. If you’re one of those people, others may find what you say to be vague and confusing. But how can you avoid this from happening?
The best way is by helping customers to ask the right questions. Ask yourself
- Do they know what questions to ask?
- Do they know what to do with their insights?
The best thing about these questions is it doesn’t matter if you’re a Fortune 500 company or a start-up. They always give a good starting point when learning what to do with your data.
Tip #1: The Data Growth Method We Use
The only two ways to grow a business are to
- Get more customers
- Get customers to pay you more money
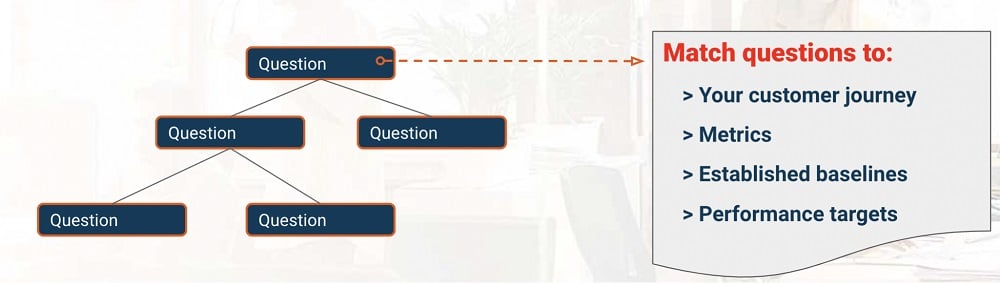
The framework that we use is based on asking a series of questions. We start with ‘where do we get more customers?’. This leads to ‘what do our new customers buy?’. And finally ‘what can we do to get our customers to convert better?’. If you can map out those questions, you’ll gain a clear roadmap based on your business.
Firstly, map the questions to your customer journey. Then, take metrics and map those. Next, you can establish baselines for your metrics. Lastly, you’ll set up performance targets for your metrics.
Simply by using this framework, you’ll be ahead of a lot of the competition.
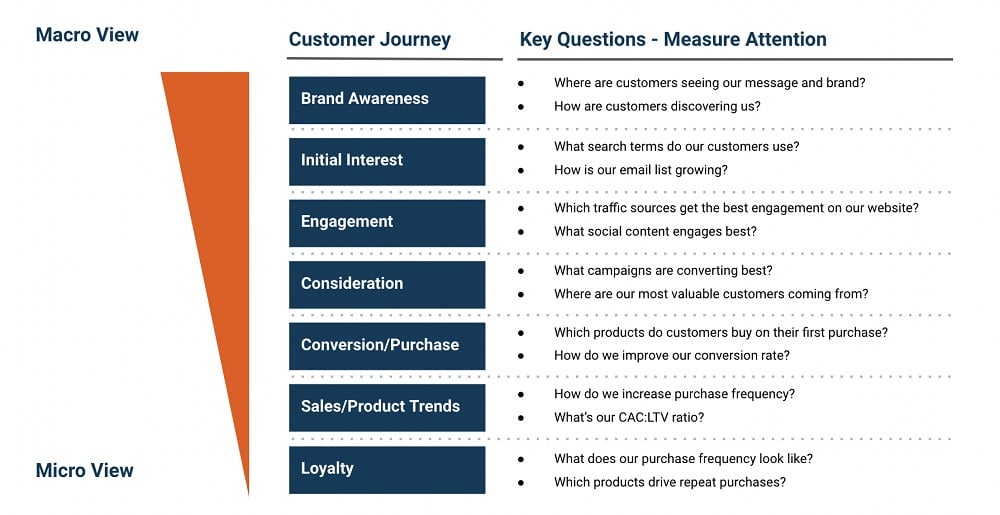
If you’re creating a customer journey for your business, it’s a good idea to use the model seen above. With this model, you can start mapping key questions to different stages of the customer journey.
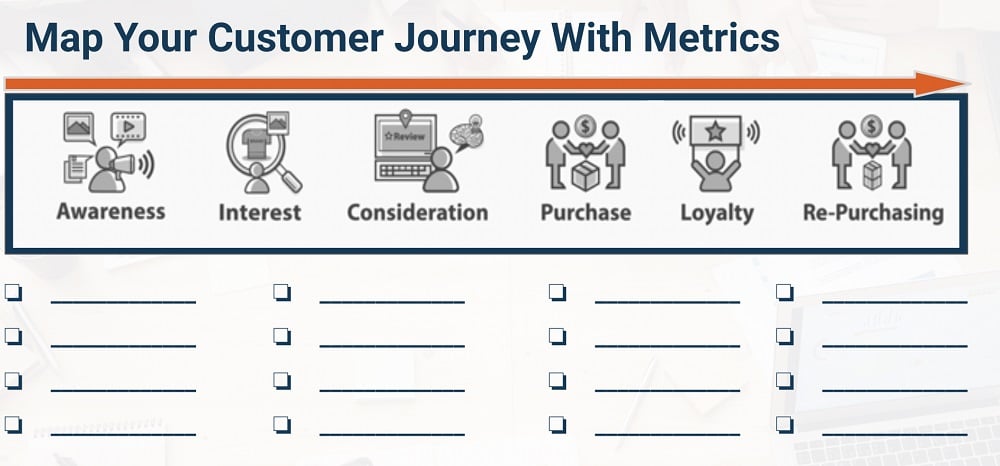
To map out your customer journey, you might use a worksheet similar to the image above. In each section, enter the metrics that make sense for you. Think in a broader sense. Not just about what GA4 has, but consider all the pieces of the puzzle.
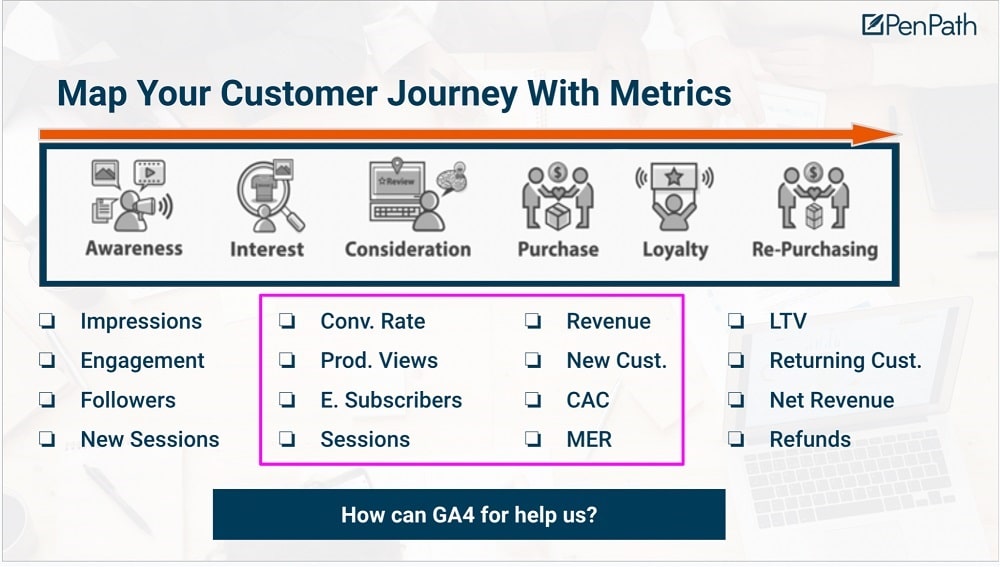
Above is an example of how you might fill out the worksheet. Because we’re focusing on GA4, we need to look at the middle section. From here, we can consider key metrics from our website.
When getting to know Google Analytics, you’ll learn that there are metrics and dimensions. In this worksheet, we map all the metrics. GA4 will help us to slice and dice this against dimensions (eg. how many sessions came from Facebook).
Tip #2: How & why top customers use GA4?
Most companies aren’t adopting GA4 as quickly as they should be. Time is of the essence, so make sure you adopt now.
Let’s cover the foundations of how to properly utilize GA4 eCommerce.
- To measure key parts of our customer acquisition funnel
- To attribute results/revenue to marketing efforts
- To create retargeting audiences
- To understand customer website/content preferences
- To understand customer product preferences
Now let’s look at some of the useful capabilities found within GA4 to help you meet your goals
- Ecommerce Metrics
- Comparisons
- Backwards Pathing Exploration
- Google Signals for Remarketing
We’ll look at each of these capabilities in more detail.
eCommerce metrics
Talk to your web developer or agency and make sure your eCommerce metrics are set up as soon as possible. Pull all of the standard events that are related to eCommerce. Go through your website and decide on events that are important for you.
Think about the customer journey. What are people doing on your website? Perhaps there’s a feature on your website that isn’t one of GA4’s standard events. If so, you can create custom events alongside implementing standard events.
eCommerce integration
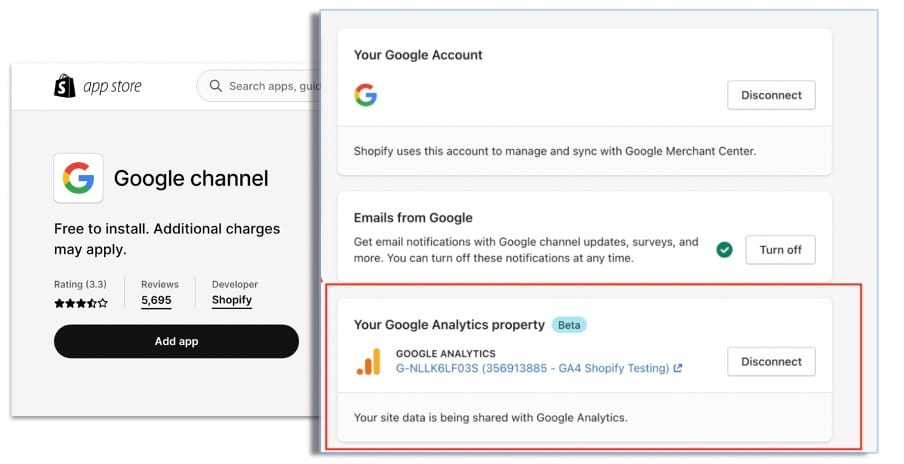
Sadly, until recently integrating with Shopify wasn’t as easy as it once was. With Universal Analytics, there was an easy integration. Until a few days ago, GA4 lacked a similar integration setup. Google has just released the Google Channel, a beta integration with GA4. But reviews have been mixed. Proceed with caution when using this integration.
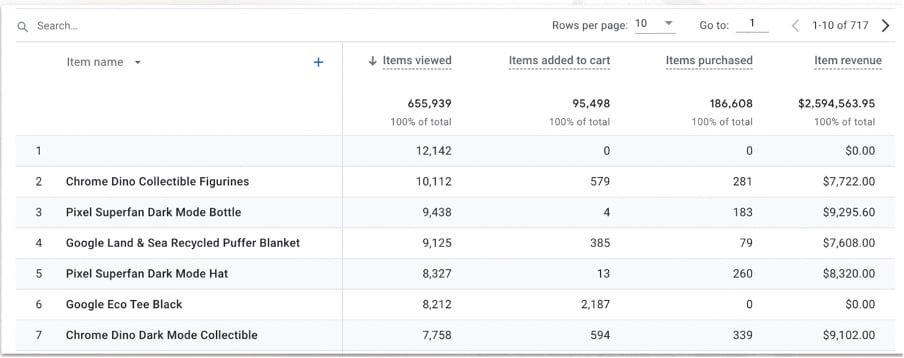
Once data builds up, you’ll get a great set of tables and data in GA4. You can utilize this in a few different ways. In the image above, you can see some of the standard eCommerce metrics that GA4 provides.
Some of these metrics can already be found in your eCommerce platform. For example, you might see that product X has X amount of revenue. But you can’t slice and dice this data like you can in GA4.
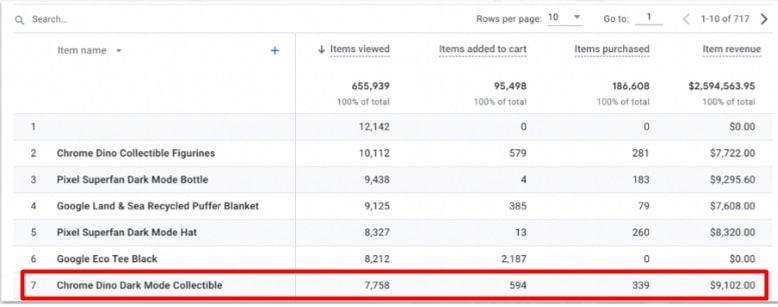
For instance, you might want to look at how many collectable Chrome Dino collectable figurines came from your retargeting efforts. The ability to segment and filter that data can only be found in GA4, not on your eCommerce platform.
GA4 Comparisons
Comparisons allow you to evaluate subsets of your data side by side. For example, you can compare customer acquisition campaigns to retargeting targeting campaigns.
A bonus tip: When setting up your UTMs, make sure that you have tracking set up on your retargeting vs your prospecting. Ad a ‘Pr’ for your prospecting and ‘Rt’ for retargeting. You can then create filters within your analytics that can be used for comparisons.
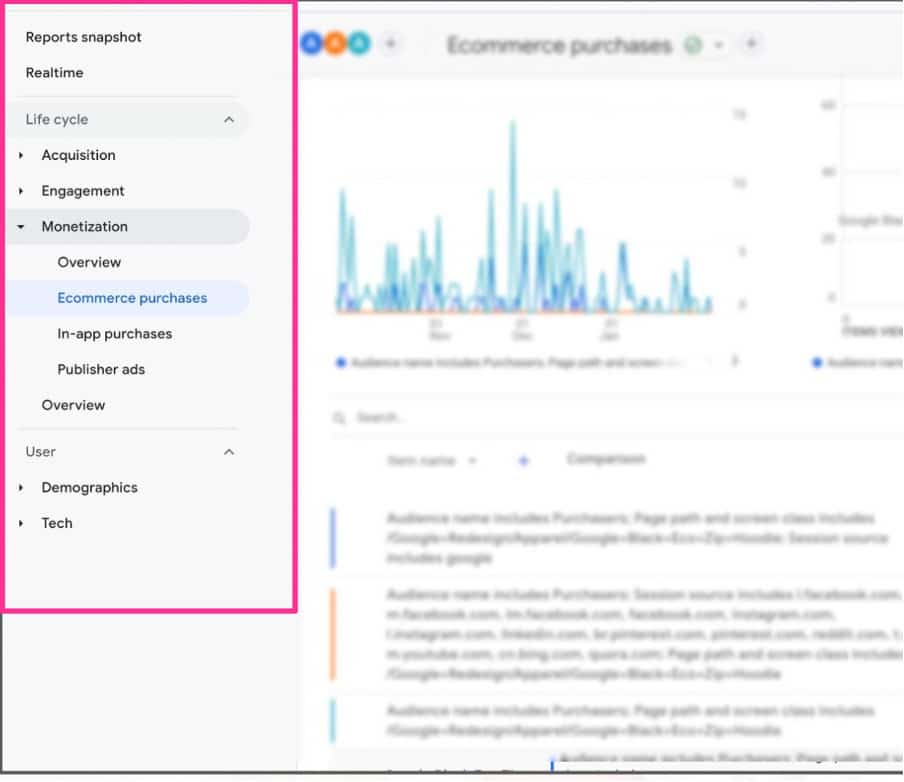
Comparisons work with all reports within Google Analytics 4. But let’s have a look at making a comparison within the ‘eCommerce purchases’ report. To get to this report, follow the menus shown in the image above.
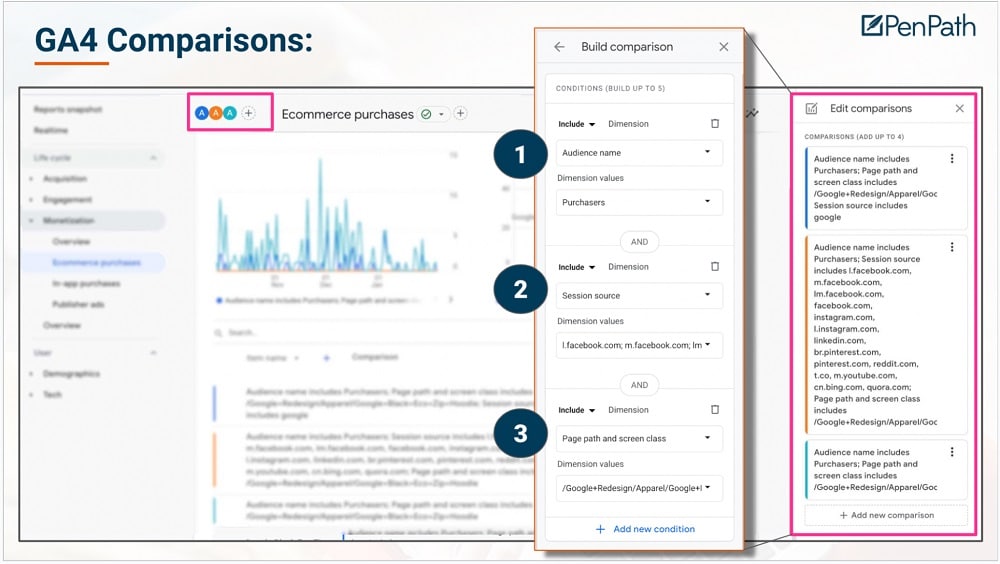
For the report, click the plus symbol in the top left (again shown in the image above). Then, in the top right, choose the pencil icon. This will bring you to the comparisons screen.
Note: Before you can create any comparisons, you’ll first need to build an audience. For more information on this, check out Google’s handy guide.
As an example, we’ll look at a report that we created. In this comparison, we’re looking at purchasers. As seen in the area labeled ‘2’ we’re trying to get a sense of what purchasers from different traffic sources look like. Finally, as seen in ‘3’ we wanted to see how different sessions were getting to a key product that is driving new customers.
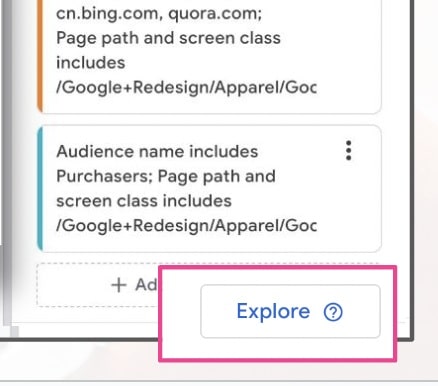
Once your comparisons are defined, you can click the ‘explore’ button at the bottom right. This will create a segment, and you’ll be taken to the Explore section.
Let’s look at the explore section in more detail.
There’s a lot you can do with explore reports. Exploration gives you much more breadth over the GA4 ecommerce data. It can be utilized to understand how customers get to strategic pages for events on your website.
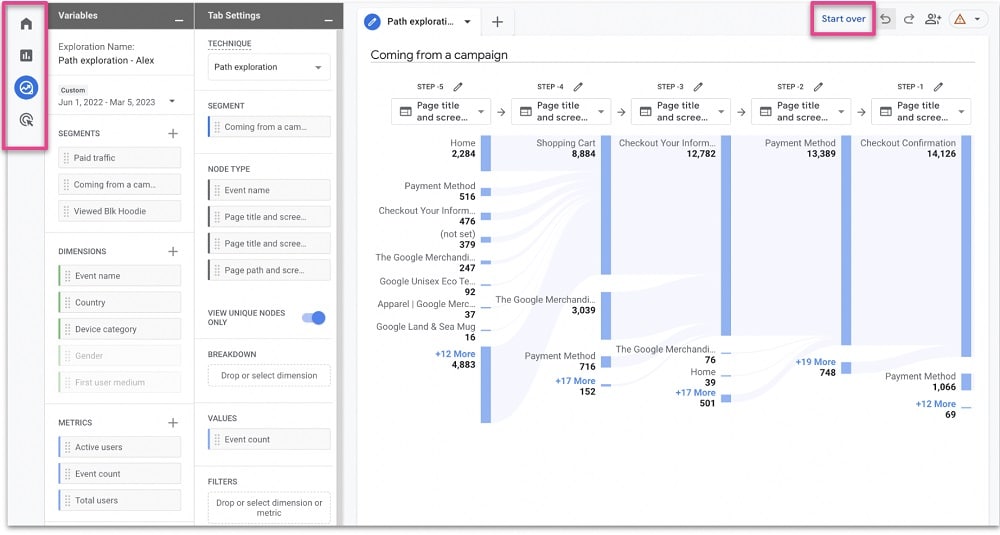
This is what an exploration looks like. It can be accessed by selecting the third option on the far left. You can create filters, add segments, metrics, and much more. Why not play around with exploration reports and get a better feel for them?
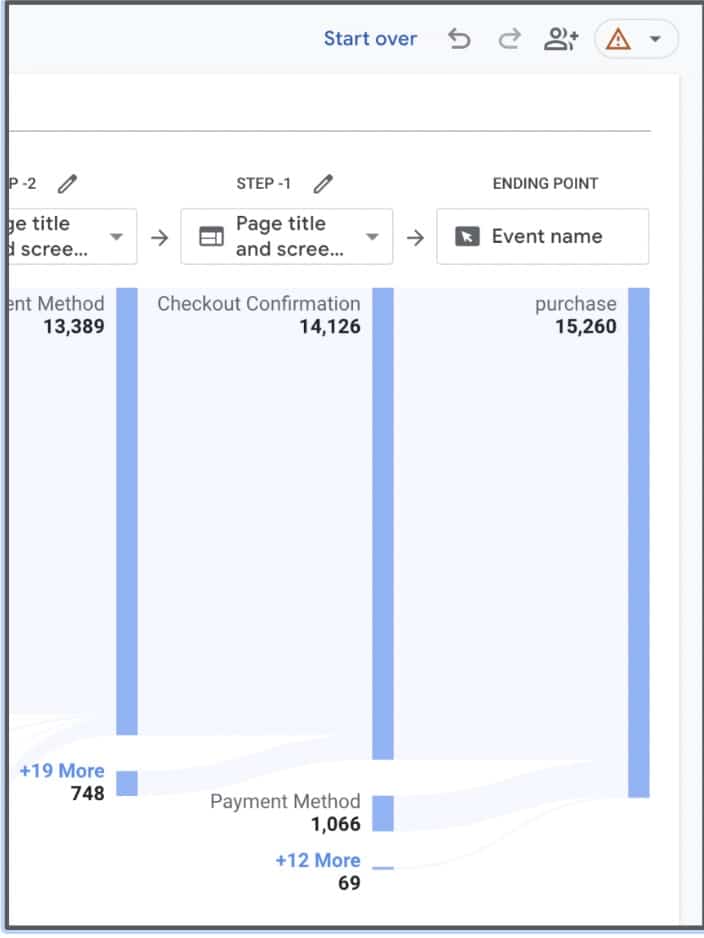
One exploration report that we find particularly useful, is the reverse path exploration. With this option, we start at the end. How many people purchased a product? By using this method, we can reverse engineer how we get more people to purchase.

Once we’ve detailed the different steps in the report, we can choose ‘Start over’.
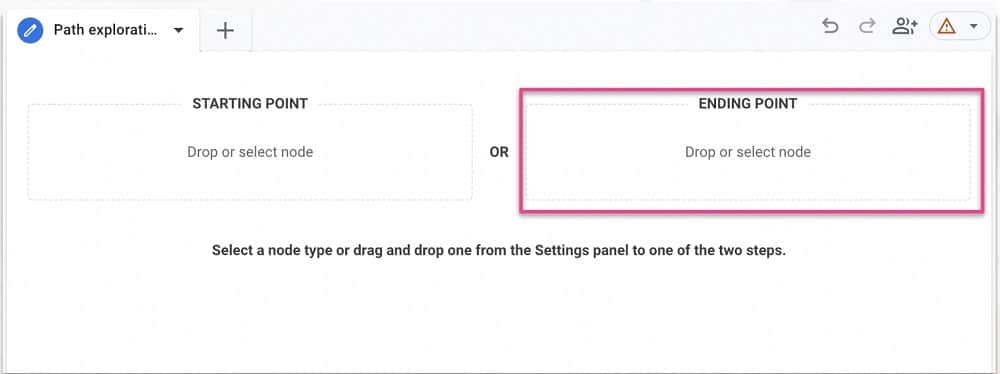
This will give two different options seen above. Because we’re running a reverse exploration, we choose ‘Ending Point’.
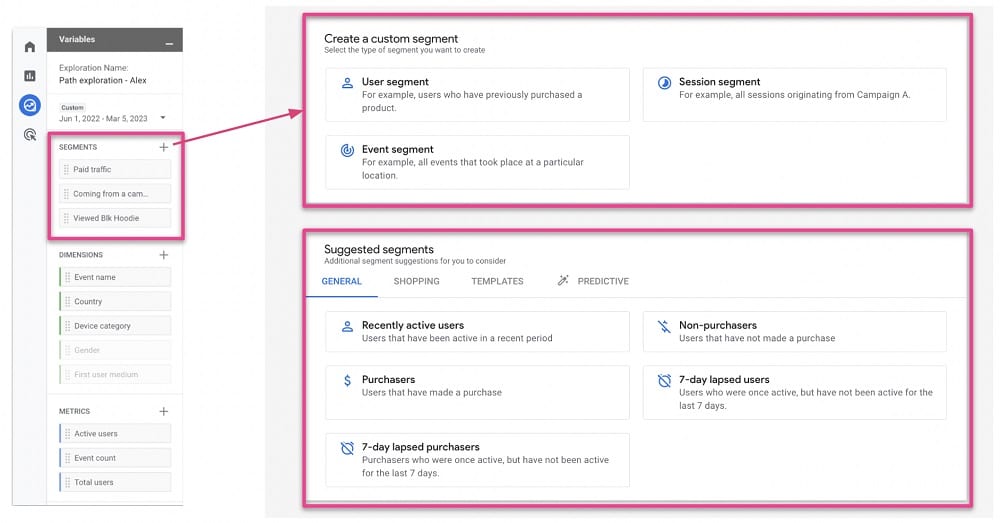
There are a lot of interesting capabilities in GA4 that weren’t included in GA3. This includes event segmentation. Event segmentation is a useful addition to the user activity and session activity segmentation options.
Another useful feature is suggested segments. If you have enough traffic (1,000 purchasers, and 1,000 none purchasers) you can choose the ‘Predictive’ tab. These provide even better suggested segments. It’s a must-use option if you have the scale.
GA4 turn on Google Signals
A lot of businesses are yet to turn on Google Signals. This is a big misstep. Google Signals ensure you get the best customer insights that can be used for remarketing and segmentations.
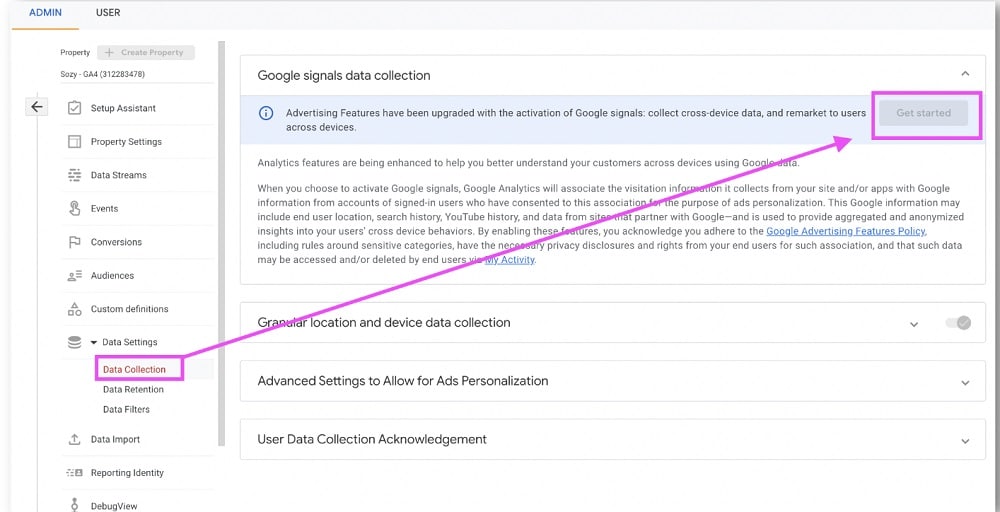
To turn on Google Signals simply go to the Admin section>Data Settings> Data Collection. From here, choose ‘Get started’.
Signals is a fantastic way of testing your remarketing. Remarketing spend can perform 7-9X better than prospecting. You’ll want to make sure that it is as good as can be. Remember, by building audiences in GA4 you can make your remarketing even more detailed.
Tip #3: Never waste time on a bad analysis

As you work with data, people may feel overwhelmed around you (similar to the above image!). In this tip, we wanted to give you a framework for always delivering relevant information. With any luck, it will help to avoid ‘data vomiting’ and confused executives.
By following the steps below, you can better grade your analysis going forward:
- Information should be novel – You don’t want to be telling people information that they already know. Always provide unique insights.
- Relavant – Any time you do an analysis and are presenting to others, ensure that the information is related to what’s top of mind.
- High-impact – If someone comes to you and says ‘I know a way to make you $1,000 this month.’, you’d probably dismiss them. However, if they said ‘I know how to save us $50,000 this month’, they’re driving some serious information.
- Practical – You should always work within the range of what’s feasible for your company.
- Actionable – Let’s go back to the earlier example of Black and Decker, the company realized that there was an opportunity to ship out a new type of product. The company was able to profit by using action data.
Let’s recap
There’s a lot to take in here, so let’s recap:
- You should now be able to Map your business questions and metrics to your customer journey.
- GA4 is part of your overall measurement stack, make sure you set it up to get the data you need. This way, when you need to segment, you’re ready to go.
- Never waste time doing analysis again – use our 5 part framework.
Bear these points in mind, and you can boost your eCommerce growth.
Further Reading
Want more? Check out our blog for tips on Google Analytics, GTM, and a whole host of other Google packages.
About Alex:
Alex is the CEO and founder of PenPath, a leading business intelligence platform for enterprise and DTC brands. His leadership experience spans both high-growth startups and Fortune 100 companies.

- Top 24 Google Analytics Chrome Extensions & Sheets Add-ons - 21/05/2026
- Best Consent Management Platforms (CMP) - 19/05/2026
- Google Signals and Consent Mode: What This GA4 Change Really Means - 23/04/2026