Google Analytics Enhanced Ecommerce: The Definitive Guide

This guide will help you understand everything you need to know about enhanced ecommerce. What is it? How to set it up? What reports are available to you? And why it’s a must-have for any ecommerce business.
Today, pretty much every business recognizes the importance of user data. It’s the key to creating successful, targeted marketing campaigns. With the help of Google Analytics, data allows us to learn more about a customer than ever. From their demographic and nationality, to the device they used to access your site. If your business’s marketing isn’t informed by user data, well, it should be.
But until recently, the detailed buying behaviours of a user were something of a mystery. For years, this meant businesses had to jump through hoops to bridge data gaps. After all, knowing exactly what your customers are up to when buying products is important information. Which products did they view? What promotions caught their eye? All this data can help inform how a business presents its products.
Luckily, a few years ago, Google came to the rescue with a solution. They called it Enhanced Ecommerce and, like other analytics-related releases from Google, it was something of a game-changer. For the first time businesses could easily learn detailed information about the buying behaviours of customers.
We at MeasuredMinds, believe that Enhanced Ecommerce is an essential part of obtaining analytics data. Here we’ll talk you through setting up and getting to grips with Enhanced Ecommerce.
What is Google Analytics?
Before we talk about Enhanced Ecommerce, we first need to make sure you have an understanding of Google Analytics. GA is quickly becoming a must-have for all businesses that are interested in digital marketing.
GA is a tool that was created to allow us to better understand our audiences, their behaviours, likes & dislikes, and more. As we explained earlier, the depth of data provided by GA completely transformed how businesses operate online. It meant that marketing could be tailored in extremely specific ways towards different kinds of customers.
GA meant that for the first time, customer data was presented in an intuitive and easy to access way. Every area of data collected is broken into easy-to-read graphs and tables. GA tells you pretty much everything you can imagine. This includes:
- Bar charts to let you know where traffic is coming from.
- Tables telling you about user retention.
- Pie charts detailing which devices a user accessed your site from.
- A list of countries that bring the most visitors to your site.
- The most popular pages on your site.
- Live tracking allows you to view a user’s journey in real-time.
There are all sorts of debates surrounding the topic of analytics. Some want to further advance capabilities to analyse user data. Others think analytics goes too far. Some believe that it is too intrusive and lacking in transparency about what is being done with user data.
Regardless of your opinion towards analytics, however, if you’re a business owner you must accept that data is an essential part of marketing in the digital age. With 30-50 million websites using GA, it’s best not to be the odd one out.
What is Enhanced Ecommerce?
Before we go into setting up Enhanced Ecommerce, we’ll spend some time talking about the software and exactly what it does. In the simplest terms possible, Enhanced ecommerce helps you collect behavioural data from your users. This includes details about user interactions with onsite marketing, product pages and the checkout process.
At a more complex level, Enhanced Ecommerce allows you to collect very specific data. This includes:
- Clicks on a link to a product.
- How many views a product details page has had.
- The number of impressions and clicks related to an internal promotion.
- Adding or removing a product from a shopping cart.
The list goes on and on. It’s easy to see how all this data can be transformational for a business. With this information, we can improve the overall user experience and improve our marketing.
What’s the difference between standard and Enhanced Ecommerce?
If you’re setting up Ecommerce for the first time, what benefit is there for going with Enhanced Ecommerce? Well, the most compelling argument for choosing Enhanced Ecommerce over the standard package, is the lack of limitations. Standard Ecommerce has lots of functionalities, such as tracking sales and conversions, but it also has restrictions. With Enhanced Ecommerce you create more reports and receive more data. For example, with standard ecommerce you can track a transaction on an order confirmed page.
Enhanced Ecommerce allows you to track a customer adding a product to their cart, choosing their payment method, basically every interaction they complete whilst buying a product.
The only real downside to Enhanced Ecommerce is the amount of time and effort involved in the set up. You’ll hear us say this more than once throughout this article but, it’s really important to get professional help when installing the software.
Setting up Enhanced Ecommerce
There are numerous steps to setting up Enhanced Ecommerce and at times some may seem confusing. Not to worry though! We’ll detail each step, from initial set up, to make the most of Ecommerce, below.
Step 1: Head over to Google Analytics
To begin, we need to head to Google Analytics (GA) and activate Enhanced Ecommerce. Don’t have Google Analytics set up yet? We have a step by step guide for installing GA on your site.
Step 2: Go to admin
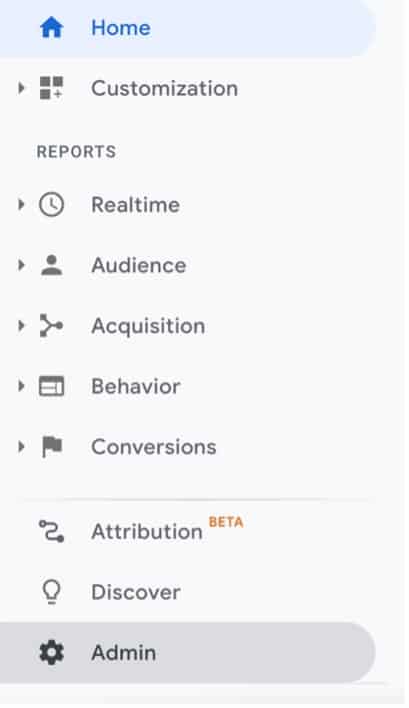
From your Google Analytics dashboard, head to your toolbar at the left of your screen and select ‘Admin’.
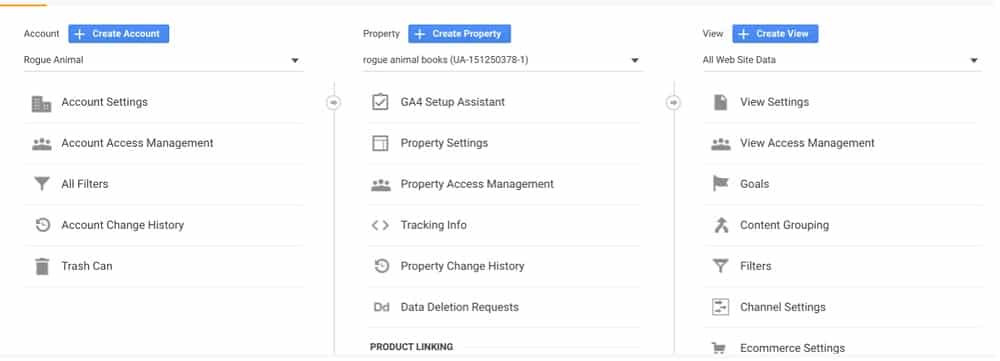
You’ll now see three columns. For this, you’ll need to head to the third column and select ‘Ecommerce Settings’.
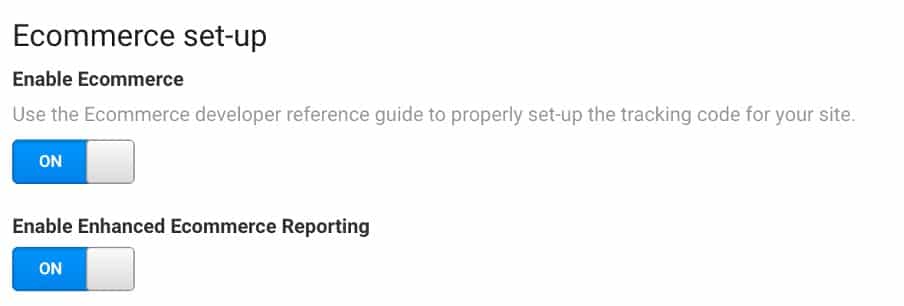
Step 3: Enable enhanced ecommerce reporting
This brings up a screen with a switch that allows us to enable Ecommerce. Select it. An option will now appear for ‘Enable Enhanced Ecommerce Reporting’, again select it.
What’s the difference? With standard ecommerce, you can track several metrics such as traffic channel revenue and bestselling products. This version has limits, however, and enhanced ecommerce you receive much more detailed reports. If you want to get the most out of customer data, you’ll want to select Enhanced Ecommerce reporting.
Step 4: Create checkout labeling
After you’ve clicked to ‘Enable Ecommerce’ an additional option will appear
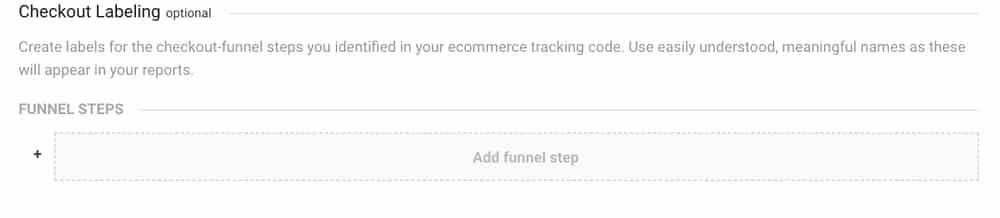
This is an optional step that allows you to create labels for each of the checkout steps that you want to track. Essentially, this makes it easier for you to find out when a user abandons a checkout and at what point they drop out of the process. For this tutorial, we’ll keep things simple and leave this blank.
This is the initial setup of Enhanced Ecommerce setup complete.
Ecommerce Reports
With Enhanced Ecommerce, there are numerous different metrics you can track through a variety of reports. We’ve detailed each report in the paragraphs below, as well as what you can learn from them:
Shopping and purchasing behaviour
For businesses that deal with selling products online, this feature alone makes Enhanced Ecommerce a must-have. The program gives users access to shopping and analysis reports, allowing you to track key buying behaviours. This means you can track information like product page views and initiated, abandoned and completed transactions.
Economic Performance
One handy feature of Enhanced Ecommerce is the ability to track the economic performance of individual products using the ‘Overview and Product Performance’ report. This report includes lots of useful information that will make your life a lot easier. This includes:
- Information about the revenue and conversion rates generated by your products.
- The number of products that are included in an average transaction.
- The average value of each order.
- Information about refunds that you’ve had to issue.
- How often a customer adds a product to their cart after viewing product details.
Merchandising Success
Obviously, as well as being able to measure the performance of your products, you need to know how well they are being marketed. Enhanced Ecommerce introduces four reports to help deal with this.
The first, the ‘Affiliate Code’ allows for the tracking of revenue, transactions, and average order value. This helps you to gain an understanding of how affiliate sites are driving customers to you.
The second report is the ‘Order Coupon’ report. This allows you to track the same metrics as those listed above, this time for order-level coupons.
Next, there is the ‘Product Coupon’ report. This provides an insight into the effectiveness of product-level coupons in terms of producing revenue, driving unique purchases and the amount of product revenue you receive per purchase.
Finally, we have the ‘Internal Promotion’ report, which allows you to gauge the success of your internal promotions (when one page on your site is promoting another page). The report allows you to track views, clicks, and the click through rate for promotions.
Product Attribution
There are times when using Enhanced Ecommerce, where it’s important for a user to know which Product Lists are driving the most conversions, allowing you to drive sales by optimizing your marketing efforts. To help you find this information, Google have introduced the ‘Product List Performance’ report. The report can give you in depth information about your Product Lists.
One example is where a user triggers a conversion event by adding a product to their cart. This activates a ‘last action’ attribute which gives product-level credit to the Last Product List that a user interacted with.
The report also allows you to learn what led a user to purchase a product. Was it through selecting a merchandising block, clicking on a results page or finding it through search results?
Take a breather
Phew! That’s a lot to take in. You might need a few minutes to get your head around all this information. As you can see, there are numerous ways that Enhanced Ecommerce can improve your analytics reports, bringing better, more specific kinds of data.
Creating Ecommerce Reports
With Ecommerce enabled, you’ll now have access to various new reports.
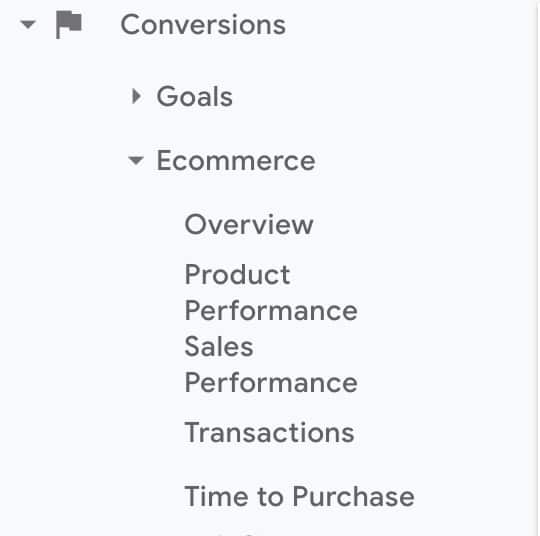
To see these reports, go back to your Google Analytics homepage and head to the toolbar on the left. Scroll down until you see ‘Conversions’, select it then click ‘Ecommerce’. This will bring up a list of the different kinds of reports found in Enhanced Ecommerce.
Unfortunately, this is where it gets complicated. To do this, we need to add JavaScript code to our website. Here’s how to add a script.
Adding JavaScript to your site
By adding JavaScript to your site, you’re activating the Enhanced Ecommerce plugin. This also lets you find out all sorts of information about your customers. Adding the code is complex, each section needs to be tailored to an individual impression and product. If you’re unsure, it might be an idea to bring in professional help. If you do want to give it a go, below you can find a template for adding code to your site. You can copy and paste this template as an example:
// … Your website
// … Standard analytics code
<script type=”text/javascript”>
// When initializing an Ecommerce plugin, it must be placed AFTER your Google Analytics code.
ga(‘require’, ‘ecommerce’);
// Create a transaction object
ga(‘ecommerce:addTransaction’, {
‘id’: ‘123456789’, // Unique transaction ID, in your system. Required.
‘affiliation’: ‘My Store’, // Store name.
‘revenue’: ‘55.5’, // Grand Total.
‘shipping’: ’10’, // Shipping cost.
‘tax’: ‘5.39’ // Tax amount.
});
// Attach individual items to transaction
ga(‘ecommerce:addItem’, {
‘id’: ‘123456789’, // Transaction ID specified previously. Required.
‘name’: ‘Socks’, // Product name. Required.
‘sku’: ‘SCKS0001’, // SKU/code.
‘category’: ‘Clothing’, // Category or variation.
‘price’: ‘5.55’, // Single item price.
‘quantity’: ’10’ // Quantity.
});
// Once you’ve added all items, send the transaction to Google Analytics
ga(‘ecommerce:send’);
</script>
Implementing Enhanced Ecommerce
Now that you’ve implemented the code for ecommerce on your site, does it mean you’ll start receiving enhanced Ecommerce reports? Well, unfortunately not. Sadly, coding-related headaches don’t end here. For Enhanced Ecommerce to work, you’ll need to add additional code to your website’s scripts to call the methods you wish to use. Once again, it’s important to stress the importance of finding professional help if you’re unsure about coding.
As before, if you’d like to have a go with coding, we’ve included an example script template that you copy into your JavaScript.
// … Your website
// … Standard analytics code, but WITHOUT ga(‘send’, ‘pageview’);
<script type=”text/javascript”>
// Example 1: Create a product impression
ga(‘ec:addImpression’, { // Provide product details in an impressionFieldObject.
‘id’: ‘123456789’, // Product ID (string). Required ID, or name.
‘name’: ‘Black Socks’, // Product name (string). Required ID, or name.
‘category’: ‘Clothing’, // Product category (string).
‘brand’: ‘Acme’, // Product brand (string).
‘variant’: ‘Black’, // Product variant (string).
‘list’: ‘Search Results’, // Product list (string).
‘position’: 1, // Product position (number).
‘dimension1’: ‘ExistingCustomer’ // Custom dimension (string).
});
// Example 2: Log a click, happened on a product in a list of search results
ga(‘ec:addProduct’, { // Provide product details in a productFieldObject.
‘id’: ‘123456789’, // Product ID (string). Required ID, or name.
‘name’: ‘Black Socks’, // Product name (string). Required ID, or name.
‘category’: ‘Clothing’, // Product category (string).
‘brand’: ‘Acme’, // Product brand (string).
‘variant’: ‘Black’, // Product variant (string).
‘position’: 1, // Product position (number).
‘dimension1’: ‘ExistingCustomer’ // Custom dimension (string).
});
ga(‘ec:setAction’, ‘click’, { // click action.
‘list’: ‘Search Results’ // Product list (string).
});
// Example 3: Combining impression, and a click (Examples 1 and 2 combined)
// The impression from a Related Products section.
ga(‘ec:addImpression’, { // Provide product details in an impressionFieldObject.
‘id’: ‘987654321’, // Product ID (string). Required ID, or name.
‘name’: ‘White Socks’, // Product name (string). Required ID, or name.
‘category’: ‘Clothing’, // Product category (string).
‘brand’: ‘Acme’, // Product brand (string).
‘variant’: ‘White’, // Product variant (string).
‘list’: ‘Related Products’, // Product list (string).
‘position’: 1, // Product position (number).
});
ga(‘ec:addProduct’, { // Provide product details in a productFieldObject.
‘id’: ‘123456789’, // Product ID (string). Required ID, or name.
‘name’: ‘Black Socks’, // Product name (string). Required ID, or name.
‘category’: ‘Clothing’, // Product category (string).
‘brand’: ‘Acme’, // Product brand (string).
‘variant’: ‘Black’, // Product variant (string).
‘position’: 2, // Product position (number).
});
ga(‘ec:setAction’, ‘click’, { // click action.
‘list’: ‘Search Results’ // Product list (string).
});
// Example 4: Measure a transaction
ga(‘ec:addProduct’, { // Provide product details in a productFieldObject.
‘id’: ‘123456789’, // Product ID (string). Required ID, or name.
‘name’: ‘Black Socks’, // Product name (string). Required ID, or name.
‘category’: ‘Clothing’, // Product category (string).
‘brand’: ‘Acme’, // Product brand (string).
‘variant’: ‘Black’, // Product variant (string).
‘price’: ‘5.50’, // Product price (number).
‘coupon’: ‘SOCKSFTW’, // Product coupon (string).
‘quantity’: 1 // Product quantity (number).
});
ga(‘ec:setAction’, ‘purchase’, { // Transaction details are provided in an actionFieldObject.
‘id’: ‘T12345’, // (Required if it’s purchase, or refund) Transaction id (string).
‘affiliation’: ‘My Store’, // Store name.
‘revenue’: ‘7.50’, // Revenue (number).
‘tax’: ‘0.50’, // Tax (number).
‘shipping’: ‘1.5’, // Shipping (number).
‘coupon’: ‘SALE2021’ // Transaction coupon (string).
});
// Example 5: Refund an entire transaction
ga(‘ec:setAction’, ‘refund’, {
‘id’: ‘T12345’ // Transaction ID is only required field for full refund.
});
// Example 6: Refund a single product
ga(‘ec:addProduct’, {
‘id’: ‘123456789’, // Product ID is required for partial refund.
‘quantity’: 1 // Quantity is required for partial refund.
});
ga(‘ec:setAction’, ‘refund’, {
‘id’: ‘T12345’, // Transaction ID is required for partial refund.
});
// Final notes
// Once you’ve added all items, send the pageview together with all Ecommerce data to Google Analytics
ga(‘send’, ‘pageview’);
// Note, if you performed some of these actions (like refund), instead of a user, you should send a non-interaction event before the pageview
ga(‘send’, ‘event’, ‘Ecommerce’, ‘Refund’, {‘nonInteraction’: 1});
</script>
Once your code is implemented, you should start receiving information within your reports. Well done for getting through this tricky set-up stage. You might want to have a quick lie down before moving on.
Viewing your reports
So Enhanced Ecommerce is now successfully set up. Great! You’re now on your way to receiving detailed reports. But how do you access them?
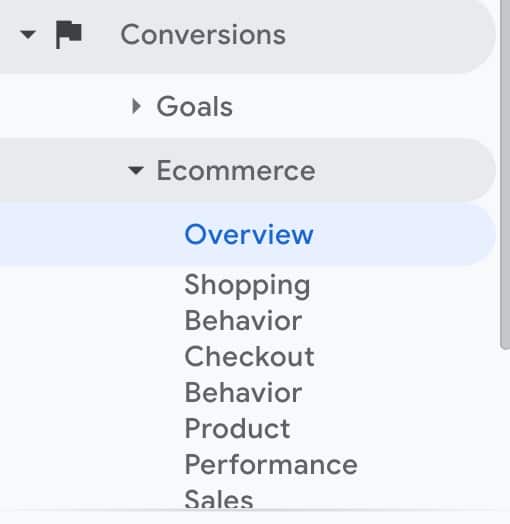
Once again, you need to go to your Google Analytics toolbar select ‘Conversions’ and then ‘Ecommerce’. This produces a list of all the different kinds of reports found in Ecommerce. Let’s go through each one.
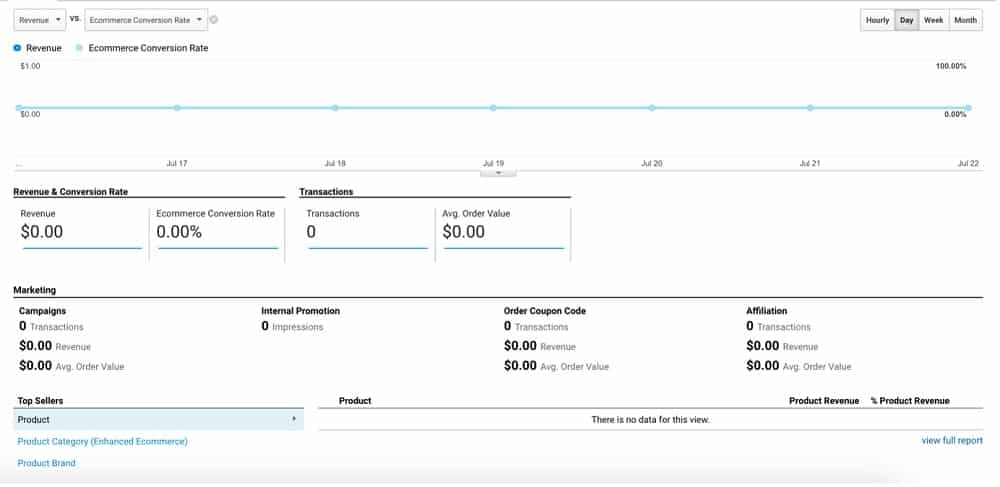
Overview
Okay, so strictly speaking, this isn’t a report. The ‘Overview’ section, as the name suggests, compiles the statistics from your different Ecommerce related activities into one interface. It’s handy for getting a sense of what’s performing well and what areas need improvement.
It can’t be understated how useful it is for a business to have all this information at the click of a button. You can better structure your marketing campaigns, saving money and resources, which allows for the creation of higher quality content.
Revenue & Conversion Rate
From the top, we have a graph displaying revenue vs the Ecommerce Conversion rate. The latter basically tracks the percentage of people that buy products on your site.
This information is also found below the graph in the ‘Revenue & Conversion Rate’ section. This section also tracks the number of transactions on your site and the average order value.
Marketing
Next, we have the ‘Marketing’ section. This is probably the most helpful part of the Overview interface. It allows us to see how effective our marketing campaigns our at achieving various metrics. It tells us how many transactions and how much revenue has been produced as a result of marketing.
Additionally, we can measure the effectiveness of internal promotions – i.e., those found within a site. We can also track the success (or failure) of discount coupons and find out how much revenue affiliate sites are bringing.
Best-selling products & sorting by time
Finally, we can see a list of best-selling products and their associated revenue.
The overview interface allows a user to segment each area of the interface by hour, day, week or month.
Shopping Behaviour
The Shopping Behaviour Report provides multiple advantages. As the name suggests, we can learn about the actions of customers during the buying process. This is one of the reasons why you should choose enhanced Ecommerce over the standard software. This report is not for standard Ecommerce.
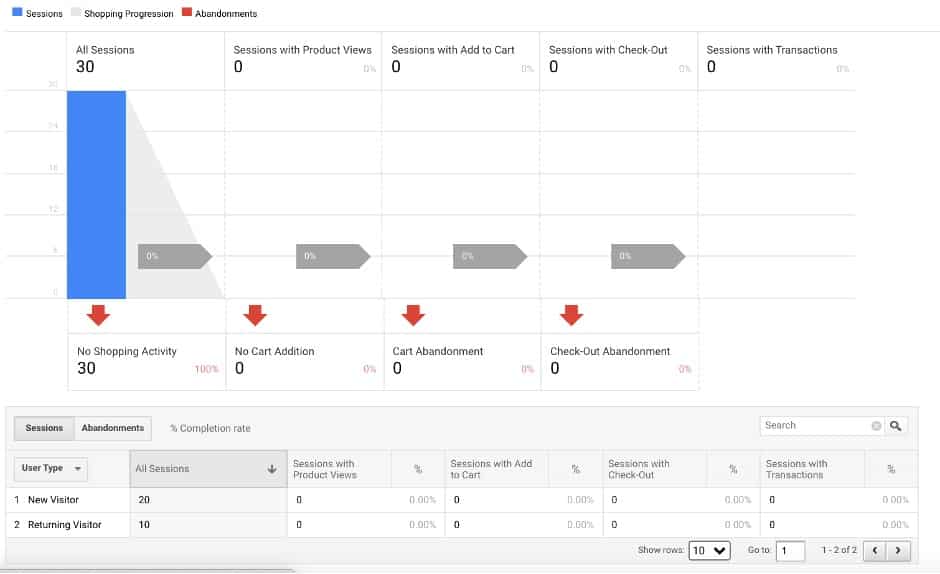
Shopping activity chart
This report presents us with a useful bar chart that tells us about sessions on our site. This information includes the percentage of sessions:
- Where customers added products to their cart.
- That included views of a product.
- Where customers checked out.
- Where a transaction was completed.
The chart also separates this information in sections by showing individual sessions, shopping progression and abandonments.
Measuring shopping activity by individual customers
The Shopping Behaviour Report also inserts this information into a table. Here you find out the number of sessions that included new customers, as well as sessions with returning customers. The table can also be formatted to display the percentage of abandonments for each metric. When viewing the table, you can also choose the kind of user that you want to find information about. You can filter a user by:
- Browser
- Marketing Campaign
- City of origin
- Country of origin
- Device Category
- Keyword
- Region
- Source
- Source/Medium
- Medium
- User Type
Checkout Behaviour
Next, we have the Checkout Behaviour Report. This tells us the actions of customers during the checkout funnel. If there’s an issue during the checkout process, such as payment not going through properly, it’s crucial that you know exactly what’s going wrong. This report allows us to identify problems before they become too widespread.
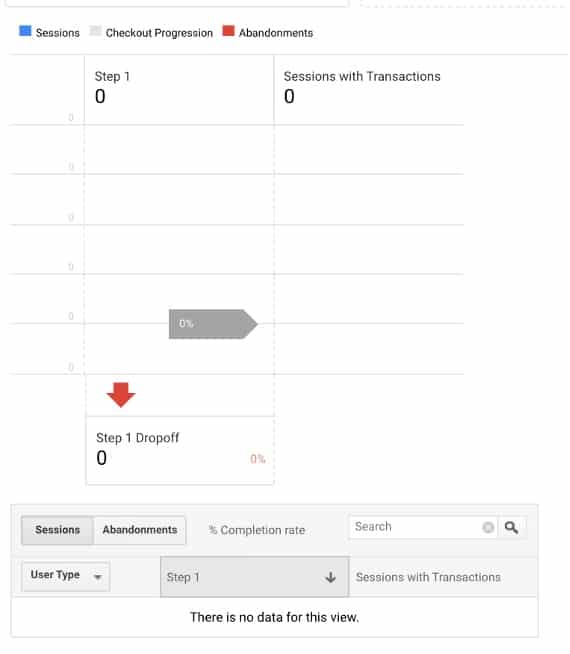
As with the previous report, this data is split into both a chart and table, allowing for the clear visualisation of data.
Product Performance
Next on the list is the Product Performance Report. This is probably the most important of all the different Ecommerce reports. By using Enhanced Ecommerce this section also provides additional information about shopping behaviour.
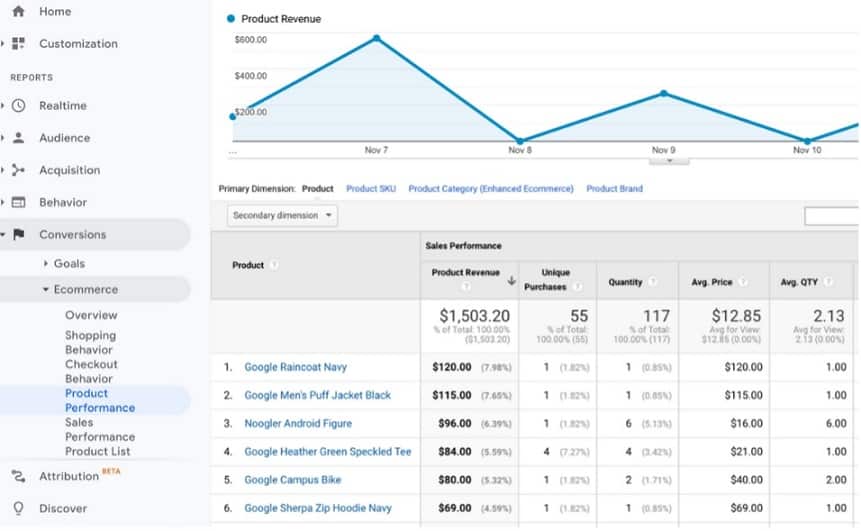
Revenue Chart
As with other Ecommerce reports, the Product Performance Report provides us with a chart, this time to help us track product revenue over time. The chart can be broken into numerous different categories to help you track very specific areas of product performance:
- Average price of a product
- Average number of products sold per transaction
- Buy to detail rate (unique purchases divided by views of product pages)
- Cart to detail rate
- Product refund amounts
- Number of products
- Number of unique purchases
Product Table
As with other reports we have access to a detailed table. This time listing all the different products available on our site. We can track each product by revenue, quantity, number of unique purchases, average price and average quantity. And, you guessed it, this information can be broken down even further. We can find out:
- Information about product acquisition.
- Sales that were achieved through advertising.
- How user behaviour affected sales.
- Any Custom variables that drove sales.
- More detailed ecommerce results.
- The social background of users.
- The time zone of a user.
- Other detailed information about users.
With the Product Performance Report, you can be on top of pretty much every detail regarding sales. You can know which products are and aren’t working. You can then make the decision to change how you market or simply discontinue a product. This can also inform your product strategy, allowing you to consider where product modification or even new products might be appropriate.
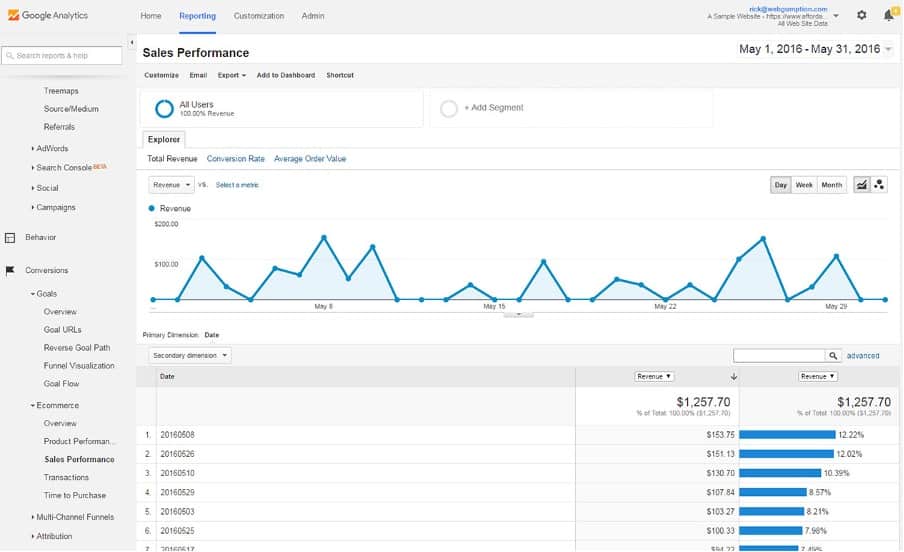
Sales Performance
Like the Product Performance Report, the Sales Performance Report is split into two sections. A bar chart, showing overall revenue over a specified period. We also have a table, this time filled with information regarding revenue, tax, shipping costs, refund amounts and the quantity of products sold.
Product list performance
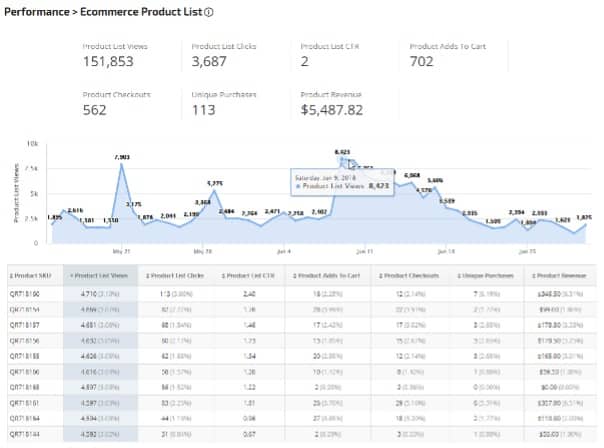
The final report (yes, really) displays the performance of product lists. i.e., a list of products based on a specific category. As usual, this information is presented through both a chart and a table.
The Product list performance table contains lots of information. This includes:
- The stock keeping unit for each product
- The number of clicks on products lists
- The product list click-through rate
- The number of times a product has been added to a cart
- Product list views
- The number of times a product has been checked out
- The number of unique purchases attributed to each product.
- The revenue for each product.
If that wasn’t enough, the primary dimension for this table can be changed to show product list name, product list position, and individual product names.
And there you have it, all the different reports that present your Ecommerce data. Yes, it’s a mind-blowing amount of information but it’s also extremely useful. With enhanced ecommerce it’s unlikely you’ll ever be stuck trying to find a specific piece of information regarding sales on your site.
But what about custom reports?
In the event that you do look through each of your ecommerce reports and find that you still don’t have the information that you are looking for, what do you do? Well, luckily, Google has a solution for this. Enhanced Ecommerce also allows for the creation of custom reports. Here are some step-by-step instructions for creating custom reports in ecommerce.
Step 1: Choose a template from the Google library
First things first, it’s good to have a template when creating your custom report. It makes things a lot simpler, and Google has a huge library of custom reports to choose from. For this example, we’ll go with a Customer Acquisition Report. This can help you to easily identify which sources are contributing the most revenue to your business.
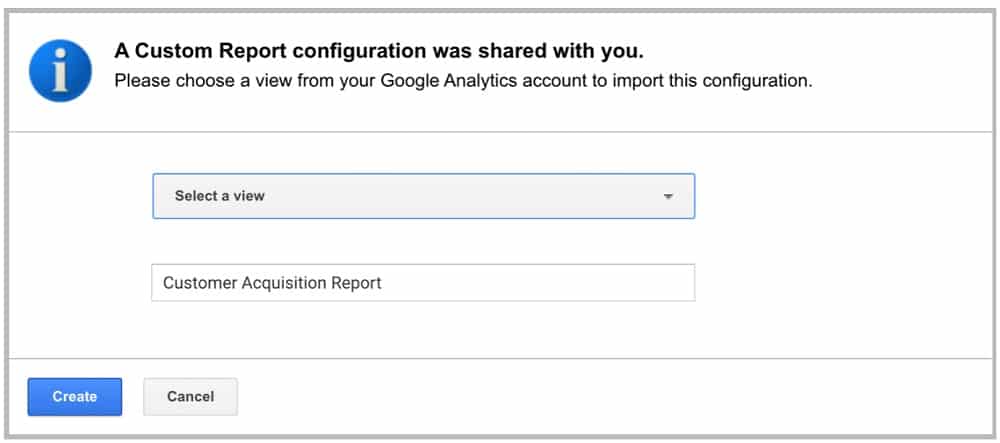
Step 2: Create a view
If you follow the above link, you’ll be taken to the page pictured below, to download the Customer Acquisition Report. From the top box labelled ‘Select a view’, choose the Google Analytics property that you would like to import your report to. After that, hit ‘Create’.
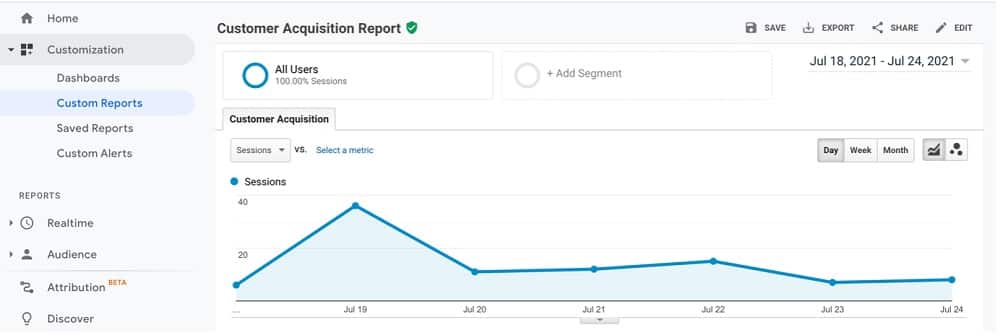
Step 3: View your report
You will then be brought to your new custom report within Google Analytics. If you’re happy that the report covers the metrics you want, you don’t have to do anything else. If you’d like to edit the report further, read on.
Step 4: Edit your view
To make changes to the report, select ‘Edit’ in the top right of your screen.

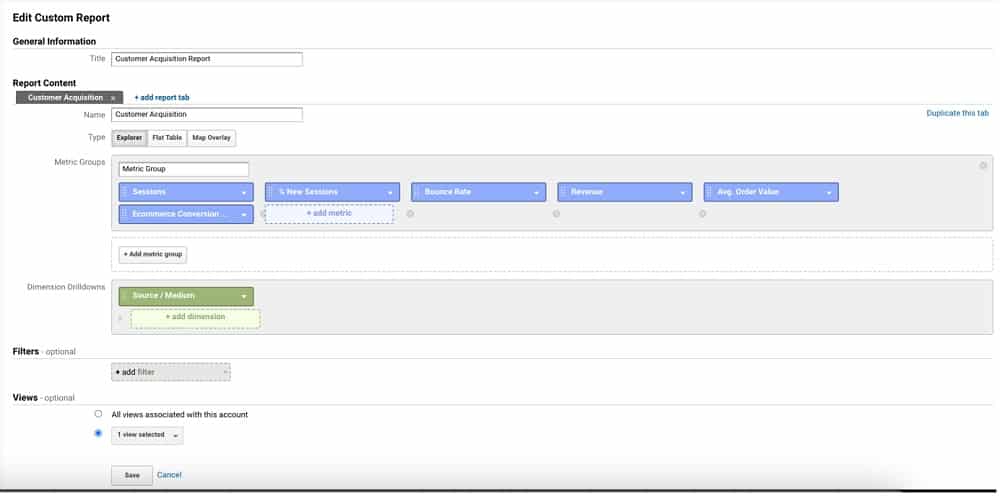
Step 5: Customize your report
You’re then directed to another page titled ‘Edit Custom Report’. From here, you can customize pretty much every aspect of your report. Let’s go through each section and describe how it can affect your reports.
Report Type
This start of this section lists the various types of reports that you can create. The options are ‘Explorer’, ‘Flat Table’ and ‘Map Overlay’.
Explorer
This is the standard method of reporting in ecommerce. An explorer report includes a line graph and a data table. The table allows you to sort and search through data so that you can find the information that you need.
Flat Table
This option includes a static, sortable table that presents data in rows.
Map Overlay
With this option, data is presented via a world map. The different countries and regions that bring the most traffic is displayed in darker colours. Therefore, this option is particularly useful for measuring the effectiveness of global marketing campaigns.
Metric Groups
Once we’ve chosen a type of report we can then select the metric groups that we want our report to measure. Select ‘+ add metric’ to add an additional metric to the list. There are lots to choose from and a useful way to start is by compiling a list of areas that you want your report to measure. What are you trying to achieve? By knowing exactly what you want to measure you can create useful and effective reports from the outset.
To give you an idea of how these options work, here is a list of all the different metrics being used in this custom report.
Sessions
This report measures every individual session that takes place on your site. A session is a group of user interactions that take place within a given time. One session could involve views of multiple pages, transactions, and events.
New sessions
What’s the difference between and the metric provided by the report above? Well, with this option, the metric covers data from new users, whilst the above option combines new and returning users. Both can be extremely useful.
Bounce Rate
You’ve probably heard this term used a lot in analytics. The bounce rate is the percentage of users that load onto your site and leave after viewing only one page. The lower the bounce rate, the better!
Revenue
This kind of goes without saying, but the Revenue Report will present everything you need to measure revenue collected from user transactions.
Average Order Value
Again, this is largely self-explanatory. This option measures the combined average value of all transactions on your site.
Ecommerce Conversion Rate
This option calculates the conversion rate as the ratio of transactions to sessions, expressed as a percentage. This is a critical stat for any digital business. At Measure Minds, we place a lot of importance on optimising our client’s Conversion Rate.
Dimension Drilldowns
You can also specify ‘Dimension Drilldowns’. By adding more dimensions, you can dive into specific data, such as identifying keywords that are driving traffic.
Filters
This is an optional step. If you want to limit your report to specific dimensions, you can do so here.
Views
Again, this section is optional. Here, you can choose which Google Analytics property that you want to send your report data to. You can use the dropdown menu to find specific views and select ‘All views associated with this account’ to allow this report on all views you have access to.
Once you’re happy with your selections, you can hit ‘Save’.
For your Infomation, You will not be able to find views in GA4 dashboard like you can in UA.
Examining a custom report
Now that our custom report is all set up with the metrics that we want to measure, we can look at our report.
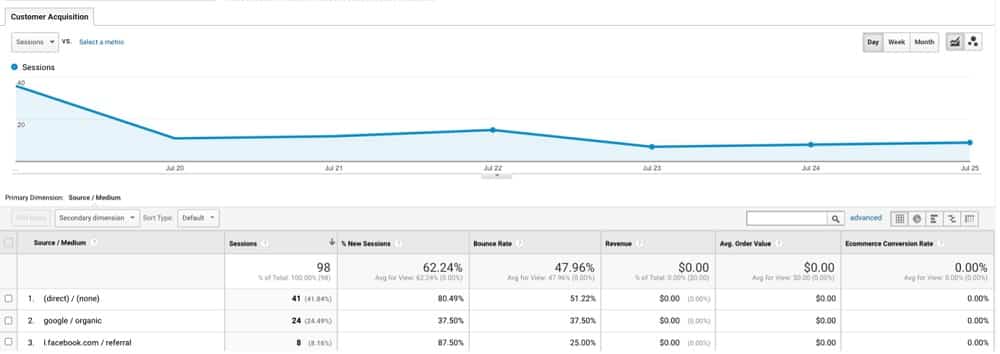
As with standard reports, you’ll see all the data from your custom report laid out in a table.
If you’ve added any of your own custom metrics to a report, you will be able to filter through them here.
As this is an acquisition report, we can see the sources that are bringing traffic to our site listed in order of sessions. Moreover, we can also see the revenue associated with each source alongside the average order value. This information is extremely valuable, allowing us to expend more of our energy and resources towards successful sources.
These kinds of insights can really improve your revenue and profit, so make sure you act on them! Measure Minds are leaders when it comes to data use if you could use expert support.
Enhanced Ecommerce will take your business to new heights
If you’re selling products online, Enhanced Ecommerce is a much-needed addition to your analytics program. All this information might feel like a bit of a headache, but without the software, you’ll be getting less detailed data than your competitors. And in a world where data is everything, that puts you at a massive disadvantage.
With advanced Ecommerce you can learn everything about the buying behaviours of customers and can track an order from being added to a basket, through to payment and completion. You can learn where customers are connecting from, detailed information about your marketing and the most successful products on your site.
Your knowledge of customer demographics, geographical reach and the effectiveness of your own website will improve dramatically. The value of such information cannot be understated.
Don’t be held back by outdated and incomplete analytics. Get started with Enhanced Ecommerce today.
Data is the future
As time goes on, data is only going to become more and more important. New ways of analysing and utilising data are constantly appearing. The only way to get ahead of the curve is to keep up with technology like Google Analytics and Enhanced Ecommerce.
It is easy to see how important all of this is. However, It would be understandable if this still seems quite daunting. We have helped many businesses, in sectors from banking and Local Government through to healthcare and education. With our help, our clients have made the most of their data and delivered real benefits to their organisations. We would love to help your business to thrive.
Further Reading
Want more? Check out our blog for more tips on Google Analytics, as well as a whole host of other Google packages.
- Top 24 Google Analytics Chrome Extensions & Sheets Add-ons - 21/05/2026
- Best Consent Management Platforms (CMP) - 19/05/2026
- Google Signals and Consent Mode: What This GA4 Change Really Means - 23/04/2026