How Much Does Google Analytics Cost? Pricing & Features

How much does Google Analytics cost?
Google Analytics is completely free, like many of Google’s digital products. And the majority of GA users stick with the free version. There is a premium version available though: Google Analytics 360 (GA360).
GA360 has a minimum cost of $50,000 per year which equates to just under $4,200 per month. But depending on the requirements of your analytics setup, it can go up to $150,000 per year or $12,500 per month or more.
Even the baseline version of GA360 is only recommended for large enterprises. But does come with a lot of additional analytical capability. The more expensive versions of GA360 should only be considered by extremely large enterprises getting 500 million or billions of events each month.
It’s worth mentioning that GA360 is still the cheapest web analytics tool when compared to other major players in the market.
What other costs are associated with Google Analytics?
Google products are typically free, with some exceptions like GA360. But there can also be costs you may find yourself paying elsewhere when using products with Google Analytics.
Google Ads
It is free to use the Google Ads interface and set up an account. But as you already know, Google Ads is a paid advertising platform. It costs money to run campaigns.
GTM Server-side
Google Tag Manager (GTM) is also free to use and is highly recommended to run alongside your Google Analytics implementation. It’s also recommended to use Google Tag Manager Server-side. Doing so has many benefits, but it does cost money.
You’ll need to set up Google Cloud Platform and a tagging server. Google recommends that you set up two or three servers, and one Cloud Run instance will cost you around $45 USD a month. So you’ll need to spend $90 to $135 per month on running servers. Larger companies may require more servers, and this will incur additional costs.
- Under 100k sessions/month: 2-3 servers = $90 to $135 per month.
- 100k to 1 million sessions/month: 2-4 servers = $90 to $180 per month.
- 1 million to 5 million sessions/month: 4-8 servers = $180 to $360 per month.
- 5 million to 20+ million sessions/month: 8-20 servers = $360 to $900 per month.
Google BigQuery
Google BigQuery previously was only available to GA360 users. But one of the greatest features of GA4 is that it is now available for free users too. However, it does incur costs of its own.
It’s a complicated pricing model; you have to pay for queries (based on the amount of data queries scanned). You also pay for storage, streaming, updating queries and more. This should, however, be free for the majority of smaller businesses as there is 10GB of storage and 1TB of queries per month for free.
Google Analytics support
If you’re going to use Google Analytics in any instance, paid or not. You should pay for specialist support so you can make the most informed decisions backed by data and to ensure you avoid being fined for breaking data privacy compliance. If you’re buying GA360 you will definitely need to purchase support.
The average salary for a Google Analytics consultant is £73K to £89K per year. Or for a much lower price, you can purchase the services of a Google Analytics agency like us, MeasureMinds. Then you’ll have the combined support of many consultants who have worked on some of the biggest enterprises.
Contact us for a free analytics audit.
The top features of Google Analytics free version
Real-time report
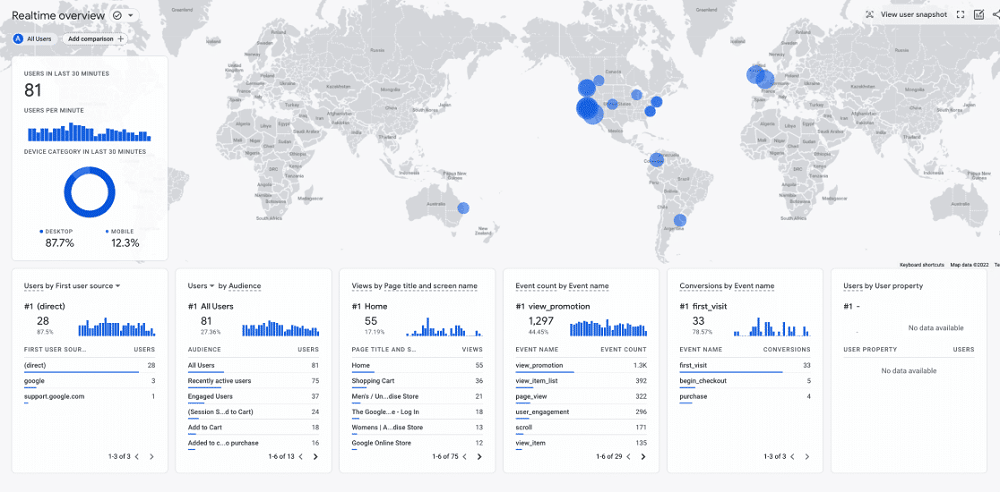
As the name suggests, real-time reports let you monitor activity on your site as it is happening. Almost like CCTV, you can find out what visitors are doing on your site. With this report, you can discover the following information:
- The number of website users during the last 30 minutes.
- Identify users or new users by their audience.
- Identify users by page title or screen name, and find out the content they engage with.
- Find the sources of your traffic. Which medium or campaign did a user come from?
- A list of conversions completed by a user.
- A list of events triggered by a user.
These features can help you to weed out any issues with your site. Are people struggling to navigate your property? Is a promotion driving traffic in the way you want it to? Have you implemented the tracking code correctly? Website owners can spend hours agonizing over these questions. GA means you can find answers in a matter of minutes.
Events
It’s fair to say that GA4 has shaken things up a bit. Of all the changes in the latest update, the most significant is events. It comes with a new data model, and user interactions in GA4 are now measured through events.
What exactly constitutes an event is up to you, although there are some preset events within GA4. For example, page_view and session_start events can be found within GA4 from the getgo.
But when it comes to custom events, ask yourself what important interactions you want to measure. Some examples include:
- Adding an item to a basket.
- Signing up for your mailing list.
- Viewing a specific page.
- A purchase being made.
Enhanced measurement
For more detailed event information, you’ll want to enable enhanced measurement. This lets you measure interactions with the content on your site. Enhanced measurement allows you to track the following actions:
- Scroll tracking to find out how much of a webpage has been viewed.
- The number of outbound clicks to other websites.
- The amount of time a user spent watching an embedded video.
- The number of files being downloaded from your website.
- The queries entered into your website search bar.
Report customization
You’ll use GA reports a lot to visualize and understand your data. But what if there is a specific piece of information that you want to acquire? This is where report customization comes in handy. GA’s ‘report builder’ lets you customize reports to your heart’s content.
Wondering how exactly you can customize reports? Below are some of the top features within the report builder.
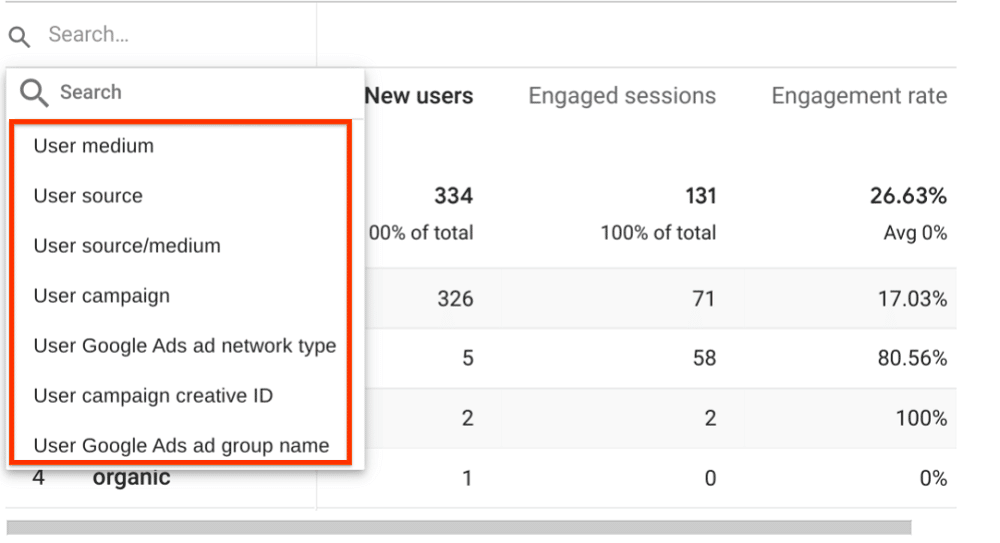
Report data
Here you’ll decide upon dimensions and metrics that will be displayed within your report. Below are some examples of dimensions that you can choose from:
- User
- Source
- Campaign Creative ID
- Google Ads group name
Metrics include new users, engaged sessions, engagement rate, bounce rate, and more.
Report filter
Sometimes, you might want to filter data to find individual subsets of data. For example, you might want data that applies specifically to mobile data. The report filter allows you to dig deep and find this information. Filters can be temporarily removed when you want to see reports in broader detail. The filter will be reapplied when a user exits a report.
Charts
Every report comes with two handy visualizations. Of course, you have the option of turning one or both visualizations off. There are a variety of visualization options to choose from. This includes:
- Geo Charts
- Donut Charts
- Bar Charts
- Line Charts
- Data Tables
- Ven Diagrams
Report templates
By linking with Google templates, your reports receive updates from Google. This means you’ll gain access to new dimensions that are released. Reports can be unlinked but be warned, you cannot relink a report.
Mobile device tracking
Research shows that a majority of internet users (nearly 60%) are on mobile. If you want your website to have mass appeal, it needs to be mobile-friendly. But even if you’ve taken steps to transform your website, it might miss the mark in some areas.
Google Analytics allows you to learn what mobile devices are being used by visitors. You can find out about the kinds of content that they are viewing. Are there any pages they are avoiding? You can work to improve the content and keep your users happy.
Tracking across devices
User journeys can be complicated. Today, most people own more than one device. What’s more, they like to switch between them. A user might begin on their phone and switch to their laptop. Tracking these cross-device journeys is key to improving the overall experience on your website.
Luckily, in the latest update to GA, you can track users regardless of their device. This way, you can get a 360 overview of your user journeys.
Tracking mobile apps
In the past, gaining data from mobile apps was a bit messy. You couldn’t view website and app data in the same GA property. This meant that you needed multiple GA properties to get accurate data. But in GA4 this has been centralized, and you can now easily view data from mobile apps.
Audience segmentation
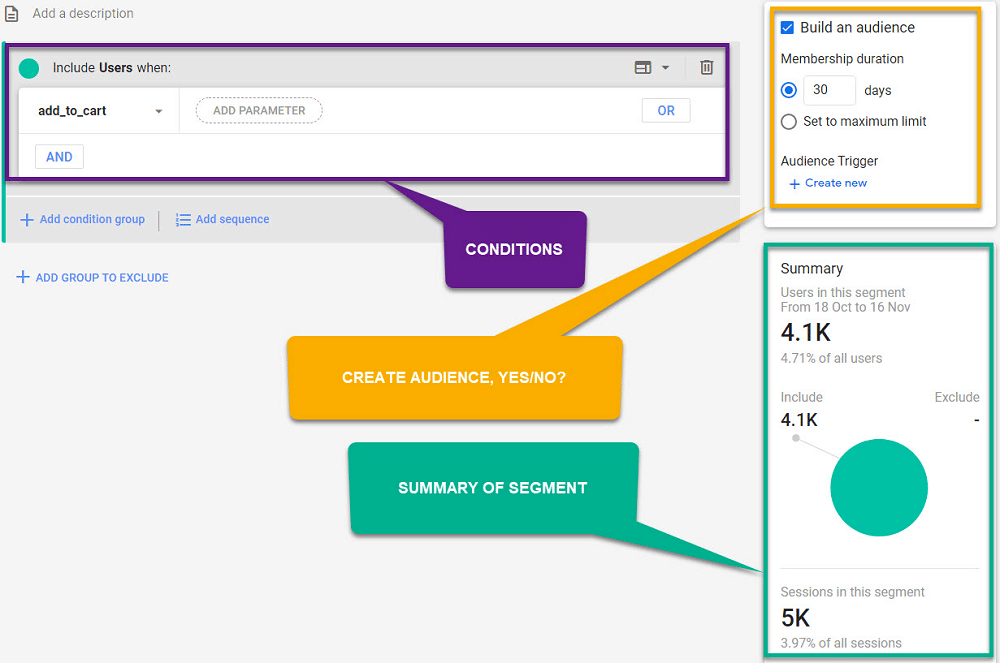
Sometimes data is too broad to be helpful. You might feel like you’re looking for a needle in a haystack. But what’s the solution? Well, luckily GA comes with a feature called audience segmentation. This is the process of breaking data down into smaller groups.
For example, let’s imagine that you only want to learn about users that come from the United States. GA4 segments allows you to filter data so you can drill down and get the information that you need.
The GA segment builder allows you to easily create three types of segments. These are user segments, event segments, and session segments.
Features of Google Analytics 360
You can probably tell why many business owners stick with the free version of GA. It covers many different areas of data analytics and can provide massive amounts of data. With all that said, what does GA360 bring to the table?
Fewer data limits
In the free version of GA, there is a limit on the amount of data that you can collect. GA360 massively increases this limit. To put it in a nutshell, you basically get more of everything.
Google lists the following differences between data limits.
| Feature | Google Analytics 4 properties (standard) | Google Analytics 4 properties under Analytics 360 |
| Event parameters | 25 per event 50 event-scoped custom dimensions per property 50 event-scoped custom metrics per property | 100 per event 125 event-scoped custom dimensions per property 125 event-scoped custom metrics per property |
| User-scoped custom dimensions | 25 per property | 100 per property |
| Conversions | 30 | 50 |
| Audiences | 100 | 400 |
| Explorations | 200 created per user per property 500 shared per property | 200 created per user per property 1000 shared per property |
| Explore sampling limits | 10M events per query | 1B events per query |
| Unsampled explorations | Not available | Unsampled results up to 50B events per day per property |
| API quotas Most requests consume fewer than 10 tokens. | 25,000 tokens per day | 250,000 tokens per day |
| Data retention | Up to 14 months Options: 2, 14 months Large and XL properties are limited to 2 months | Up to 50 months Options: 2, 14, 26, 38, and 50 months XL properties: 2 months |
| BigQuery Export | Daily export: 1 M events Streaming export: unlimited | Daily export: Billions of events Streaming export: unlimited |
| Google Analytics Pricing | Free | $150,000 per year |
Custom funnels
There will be times when you want website visitors to complete actions in a specific order. For example, you’ll probably have a mailing list. But as all website owners know, getting a user to sign up is easier said than done. A user usually needs to complete some of the following steps:
- Step 1 – Landing on your site and browsing.
- Step 2 – Reading a piece of content.
- Step 3 – Select ‘Sign up to be notified about future content.’
- Step 4 – Inputting contact details.
- Step 5 – Submitting a form.
But how can you make sure that customers are acting in the way that you want them to? With custom funnels in GA 360, you can monitor customer behaviour against your predefined goals. Is a customer failing to complete a certain step? If so, what changes can you make to your site to avoid the problem?
Funnel steps can be easily defined, and can be linked with cross-session behaviour.
GA4 did bring a lot of the funnels that were previously only accessible to UA360 users. But there are still a few only available to GA360 users.
Segment overlap
We’ve already talked about the usefulness of segments in GA. But what if you want to go deeper? The segment overlap tool within GA360 allows you to better understand the relationships between different segments.
You can compare up to three segments at once. With the information you’ve gleaned from overlap, you can then go on to create new segments. What’s more, you can properly get to grips with your data. The overlap tool lets you mouse over specific segments, and see specific numbers that relate to them.
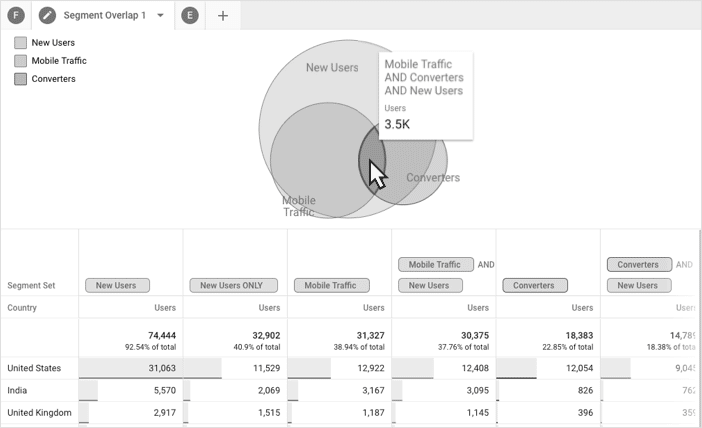
The image above shows a segment overlap containing New Users, Mobile Traffic, and Converters segments. You’ll notice that in the image, the user has hovered over the area of overlap and gained additional insights.
Which should you choose?
So, how much does Google Analytics cost? The answer is either ‘nothing at all’ or ‘a lot’. But which version of GA should you choose?
The free version of GA will probably do everything you need. From real-time reports to audience segmentation, GA can provide a world of information.
But GA360 does all that and more. With features like segment overlap, you can really go the extra mile with your data. And data is only going to become more important for businesses – you can never have too much of it. There’s no denying that GA 360 puts you a step ahead of the competition.
The question really comes down to resources. Can you invest in 360 without breaking the bank? Will the benefit of upgrading pay for the cost? One thing that is certain is that GA is key to understanding your audience. So, don’t delay. Set up your Google Analytics account today!
Google Analytics Pricing FAQs
What is Google Analytics?
55.8% of all websites use Google Analytics (GA). It’s by far the most popular web analytics tool, favoured by 85.8% of websites that monitor traffic analysis.
GA is crammed with all the features you need to properly understand how people interact with your website. You can gain huge insights into your visitors. This includes their demographic, geographic location, and even the TV shows they watch.
Moreover, since its inception in 2007, GA has received constant updates. This means that it is now bigger and better than ever. The most recent version of GA, Google Analytics 4 gives even more in-depth data.
Is it hard to setup Google Analytics?
Setting up Google Analytics is quite straightforward. The difficult part comes in knowing how to use the reports and the plethora of features available to you. You must also be cautious of data privacy compliance. Data privacy laws are constantly changing and can incur very large fines if not followed properly.
We are experts in Google Analytics, Google Tag Manager and data privacy compliance. Contact us to get a free audit and understand how we can help you make better business decisions using data.
- Top 24 Google Analytics Chrome Extensions & Sheets Add-ons - 21/05/2026
- Best Consent Management Platforms (CMP) - 19/05/2026
- Google Signals and Consent Mode: What This GA4 Change Really Means - 23/04/2026