Introduction to Google Analytics 4 (GA4) | GA4 FTW!

In this article, we’ll be delving into the transformative power of Google Analytics 4 (GA4) and the shift from Universal Analytics, exploring how GA4 is reshaping digital analytics for businesses.
This article is a comprehensive write-up of Krista’s enlightening talk titled “GA4 FTW!”. Krista highlighted its advantages over Universal Analytics (GA3) and addressed common misconceptions. Here you can find her slides. You can watch her talk on our youtube channel:
Universal Analytics (GA3) vs. Google Analytics 4 (GA4)
Over the years, Google Analytics has undergone significant transformations, each iteration aiming to provide better insights and a more user-friendly experience. Transitioning from UA to GA4 is a pivotal shift in that direction.
GA3 (Universal Analytics)
Universal Analytics, also known as analytics.js or gtag.js, was launched in October 2012. A fun fact to note is that it’s based on classic analytics, which was introduced in 2007. That means it has its roots in Urchin analytics, which Google acquired in 2005.
GA3 provides a solid understanding of how users interact with a website. It allows you to track events and conversions and generate detailed reports to improve your online presence.
Urchin’s code originates from around 1998, underscoring its long-standing role in web analytics. GA3 remained valuable for businesses in understanding online performance until its transition to Google Analytics 4 (GA4).

Key features and limitations of UA
The architecture of Universal Analytics is centred around the concept of sessions. It primarily focuses on metrics such as page views, sessions, and bounce rates. While it was highly customisable, it lacked a structured approach to events.
Key features:
- Data Tracking:
UA tracked various data points, including pageviews, events, and e-commerce transactions, providing comprehensive insights into user interactions. - Custom Dimensions and Metrics:
Users could define custom dimensions and metrics to capture specific data relevant to their business, allowing for more tailored analysis. - Multi-Platform Tracking:
It supported tracking across websites, mobile apps, and other digital properties, providing a holistic view of user journeys. - Goal Tracking:
Businesses could set up and track specific conversion goals, such as form submissions or product purchases, to measure website effectiveness. - Traffic Sources Analysis:
GA3 offered detailed information on the sources of website traffic, helping users understand where their visitors came from.
Many might recall the Category-Action-Label hierarchy in Universal Analytics. It’s essential to note that while this structure provided flexibility, it also required consistency.
Without it, data could quickly become muddled, especially when multiple individuals were implementing events with varying interpretations.
Limitations of Universal Analytics (GA3):
- Cookie-Based Tracking: GA3 primarily relied on cookies to track user interactions, which could be limited by browser settings and privacy concerns.
- Limited Cross-Device Tracking: It struggled to provide a complete picture of user behaviour across multiple devices, making it challenging to understand the complete customer journey.
- Session-Based Data: Data was organised into sessions, which could be problematic when analysing user interactions that spanned multiple sessions.
- Sampling: For websites with high traffic volumes, GA3 often used sampled data in reports, potentially leading to inaccuracies in analysis.
- Limited User-Level Data: GA3 provided aggregated data rather than granular user-level data, limiting the ability to track individual user journeys.
As of July 1st, 2023, Universal Analytics was deprecated.

GA4 (Google Analytics 4)
GA4 is designed to meet the needs of modern businesses with a more holistic view of user interactions and a flexible, event-driven model.
Introduction and evolution of GA4
When GA4 was introduced as “App plus Web” in its beta phase in 2019, it signalled Google’s ambition to bridge the gap between website and mobile app analytics.
GA4 is a major leap from Universal Analytics (GA3), embracing user-centric tracking, cross-platform analysis, and event-based insights.
It addresses privacy concerns and equips businesses with more robust tools for understanding user behaviour and compliance with data privacy regulations.
Businesses also sought a platform that could seamlessly track and interpret cross-platform interactions.
Focus on events and parameters
The shift to an event-driven model is way more transformative than people think.
Unlike the traditional session-based approach of GA3, where interactions were often bucketed into broader categories, GA4’s emphasis on events and parameters offers a fine look into user behaviour.
Every interaction on your GA4 properties, whether a button click, a form submission, or even a simple page view, is treated as an event.
Parameters further enhance this granularity. For each event, additional data can be attached as parameters, providing context and depth to the interaction.
For instance, an e-commerce website can track a ‘product added to cart’ event and use parameters to specify which product, its price, colour, size, and more.
This event-centric approach allows businesses to craft optimised user journeys. By understanding the specific actions users take and the context behind them, marketers and developers can tailor their strategies and designs to better align with user needs and preferences.
This not only enhances the user experience but also maximises the likelihood of achieving specific conversion goals and driving overall website performance.
For those seeking a more detailed breakdown, we recommend checking out Krista’s GA3 vs GA4 Comparison Guide, which offers an in-depth comparison of the two platforms.
Five reasons to love GA4
GA4 has become the top choice for businesses due to its advanced machine learning and cross-device tracking capabilities, as well as enhanced data privacy features. Let’s explore why GA4 has the potential to become the go-to choice for businesses and analysts.
1. Easier data analysis
Enhanced measurement for content analysis
Enhanced measurement is a standout feature of GA4. Activated by default for new properties, it automatically tracks a variety of user interactions, including:
- Scrolls: Gauge the depth of user engagement with their content.
- Outbound links: Understand which external resources resonate with their audience.
- Site searches: Provides insights into user queries, helping businesses refine their content strategy.
- Video engagement: Understand user interaction with videos to guide content creation.
- File downloads: Monitor resource downloads to understand which materials are most valuable to users.
- Form interactions: Provide insights into user interactions.
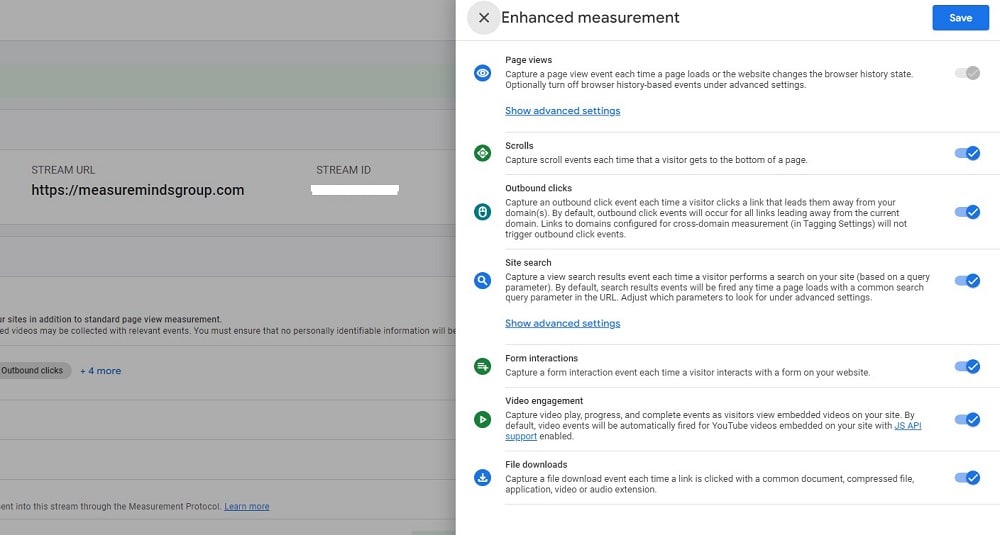
Previously, tracking such interactions required intricate setups. With GA4, it’s now streamlined, democratising data access, especially for smaller organisations.
New default channel grouping
Channel groupings play a pivotal role in understanding the origin of your traffic, helping businesses identify which marketing channels are most effective.
This allows businesses to allocate resources and optimise their strategies to maximise their ROI and drive more targeted traffic to their websites.
In GA4, the default channel groupings have been expanded and refined to reflect the evolving digital landscape. While the previous version had 11 default channels, GA4 offers a more granular breakdown with 18 channels.
This includes new channels such as:
- Paid Video: Track traffic coming from paid video advertisements.
- Organic Social: Understand the impact of organic social media activities.
- Paid Shopping: Measure the effectiveness of paid shopping campaigns.
- Organic Video: Gain insights into traffic from organic video sources.
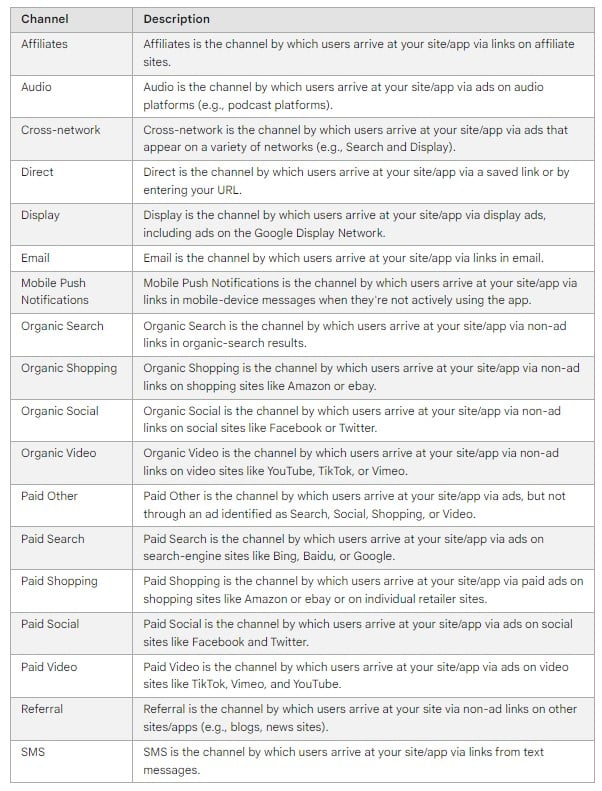
Introducing these new channels ensures businesses can differentiate between various traffic sources more effectively. The Google Analytics Help Center provides a detailed list of these channel groupings for a comprehensive understanding.
We’d recommend using this to help your business identify which channels are driving the most valuable traffic, allowing businesses to optimise their marketing efforts accordingly.
Creating custom channel groups
GA4 provides default channel groupings but also supports custom channel groups for businesses with unique needs. This feature is particularly useful for those running niche campaigns or using unconventional traffic sources outside the default channels.
For example, a business running a podcast marketing campaign can create a custom channel to track podcast-related traffic. Likewise, traffic from influencer collaborations or affiliate marketing can be grouped into custom channels for precise analysis.
Here’s a step-by-step walkthrough to set up custom channel groups seamlessly.
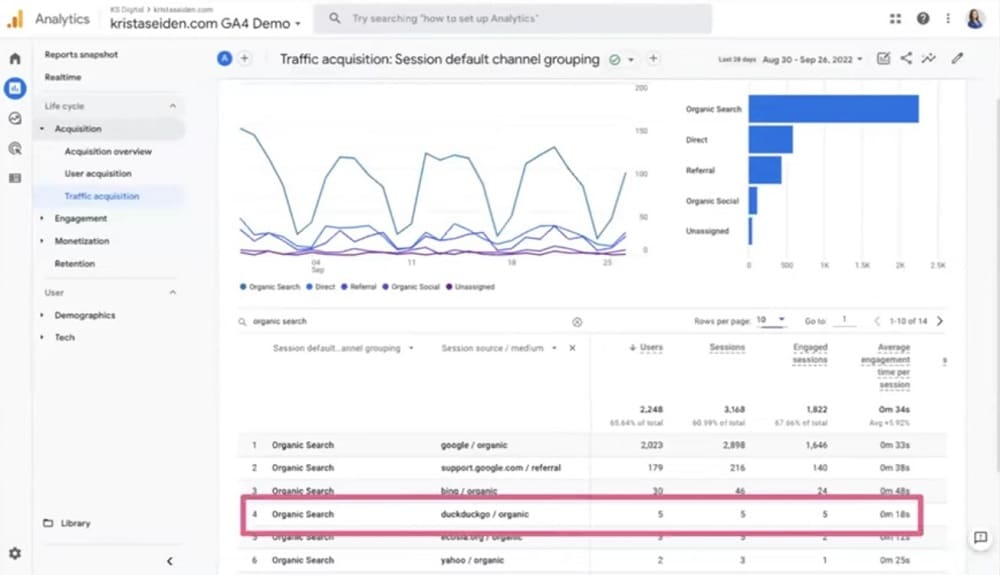
More search engines included natively
GA4 recognises diverse search engines beyond Google, including DuckDuckGo, providing a comprehensive view of organic search performance. This is essential as privacy-focused search engines gain popularity, helping businesses adjust their SEO strategies to align with user preferences.
Improvement to real-time
GA4’s improved real-time reporting provides actionable insights, such as the Event count by event name card, allowing users to see event breakdowns as they happen and access associated parameters with a click. This feature supports agile decision-making for businesses.
Clicking on a parameter reveals the specific values that have been collected. This granular view gives businesses a real-time snapshot of user interactions, from the type of events being triggered to the specific details of each interaction.
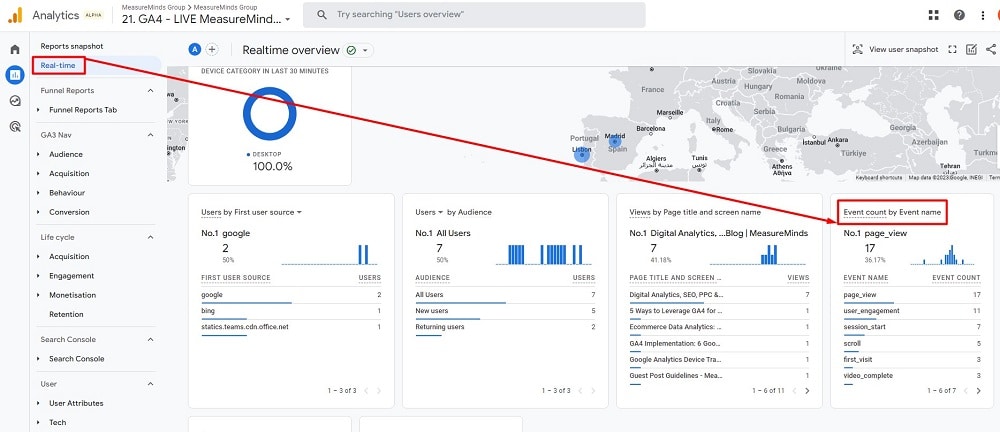
For example, if a business tracks video plays, the Event count card in real-time reveals play counts and associated details like video duration and user engagement. This instant access empowers businesses to optimise strategies in response to real-time user behaviour.
Confusion with pages & screens
GA4 merges website “pages” and mobile app “screens” into one metric, recognising the importance of both in user engagement. Users can easily toggle between Page title, Screen class, or page path for comprehensive reporting.
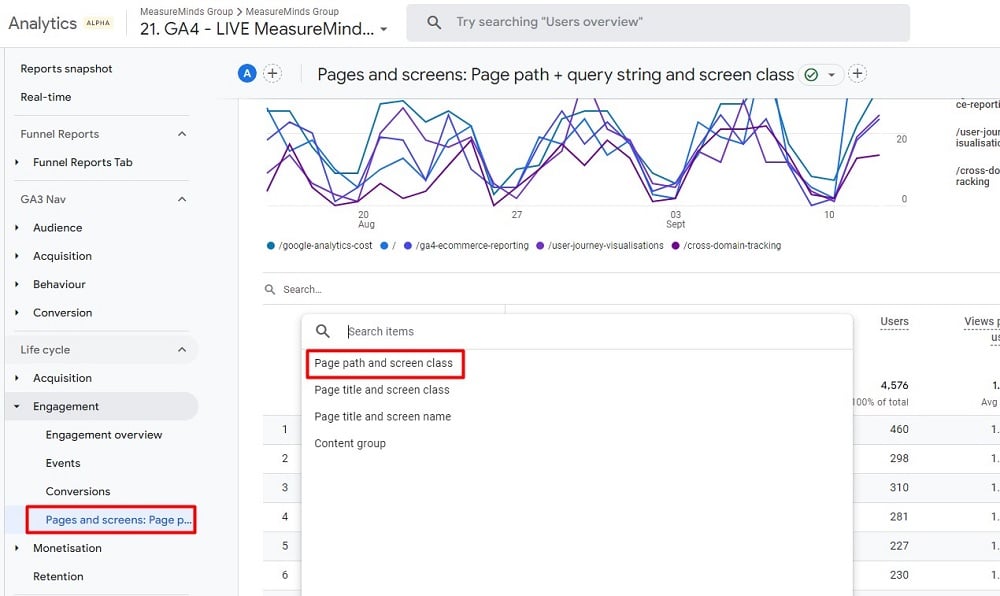
This unified approach ensures consistent reporting across platforms, making it easier for businesses with web and app presences to derive insights. However, users must know this change to interpret their data accurately.
2. Report customisations
The introduction of GA4 has ushered in a new era of flexibility and customisation in web analytics. One of the standout features of GA4 is its enhanced report customisation capabilities, allowing users to tailor their analytics data to suit their specific needs better.
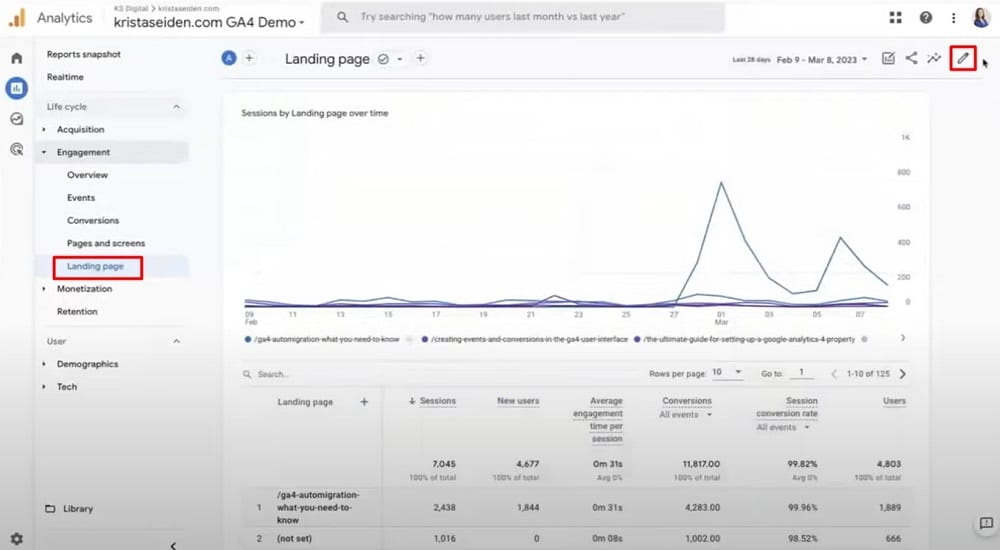
Landing page report in GA4
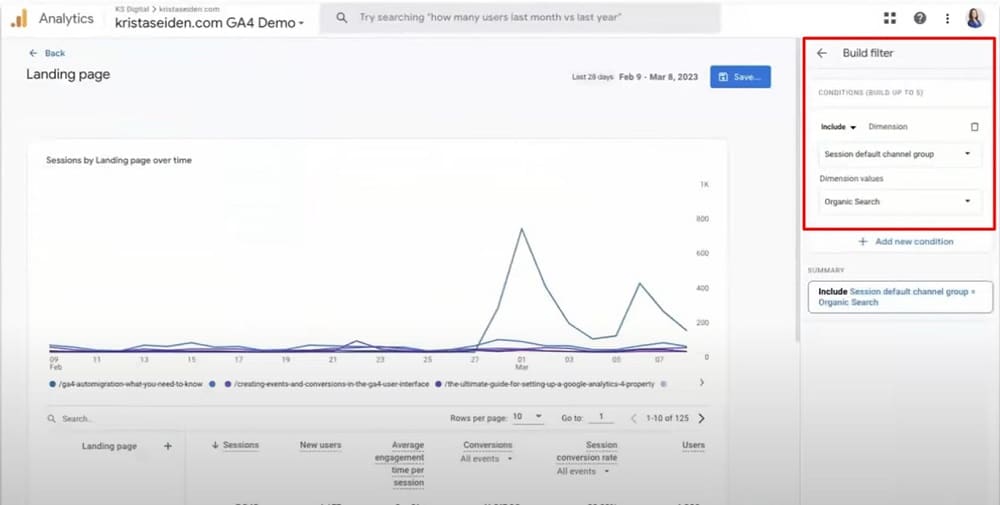
GA4 has introduced a native Landing Page Report, a notably absent feature during its initial launch. This report can be easily accessed and customised, which is located within the engagement section.
With the ability to modify dimensions, metrics, and filters, businesses can gain valuable insights to optimise their landing page strategies and improve conversion rates.
Users are presented with a customisation screen by clicking on the pencil icon in the upper right-hand corner. Here, they can modify various aspects of the report, including dimensions, metrics, and filters.
Users can quickly filter data to focus on organic search, turning a general landing page report into an SEO-specific view, highlighting GA4’s user-friendly interface.
Benefits of custom filters
Custom filters in GA4 offer enhanced granularity and dual-dimension analysis, enabling users to delve deeper into user behaviour patterns. These benefits are detailed in the list below.
- Granularity enhancement: Custom filters allow users to refine the level of detail in their reports.
- Dual dimension analysis: Users can apply a primary filter and add a secondary dimension, such as country, for in-depth insights.
- Comprehensive user behaviour analysis: Custom filters enable a thorough examination of user behaviour patterns.
Custom dimensions and metrics
GA4 goes further by allowing users to incorporate custom dimensions into their reports. Users can select from a range of custom dimensions through the dimension picker, such as article title, article tag, or article date.
These custom dimensions provide businesses with the flexibility to analyse their data based on specific parameters that are relevant to their unique needs and goals.
These custom dimensions can be set as primary dimensions, offering a tailored reporting experience.
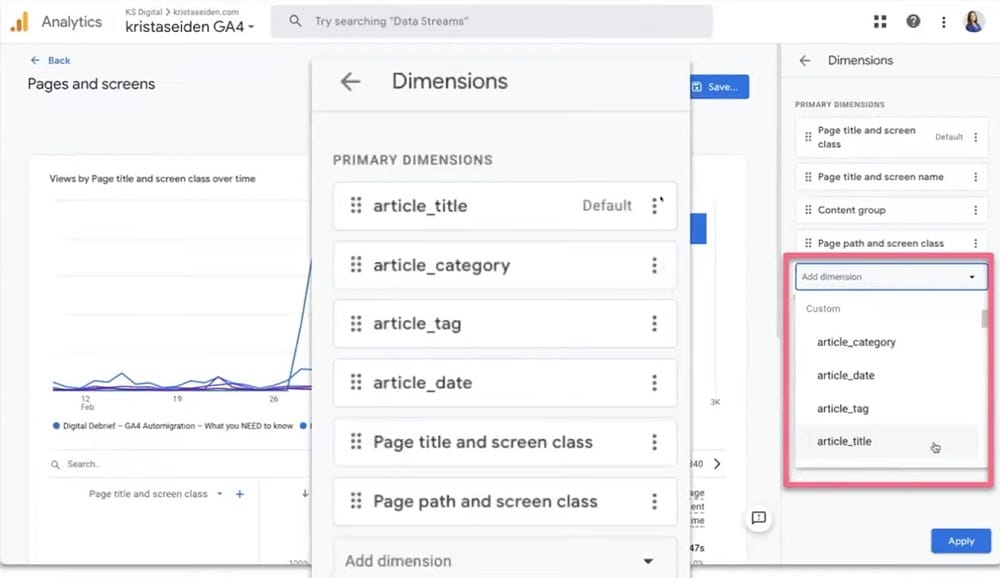
For instance, users can create a report titled “Log Pages Clicked from the Home Page,” where the primary dimension is the article title.
The report library
To enhance organisation and accessibility, GA4 introduces the Report Library. This feature enables users to organise and categorise their most frequently used reports.
With the GA4 library, users can create new reports, such as overview reports that summarise key metrics or detailed reports that provide in-depth insights.
For example, a user can create a collection named “Krista’s Faves” and populate it with their favourite reports.
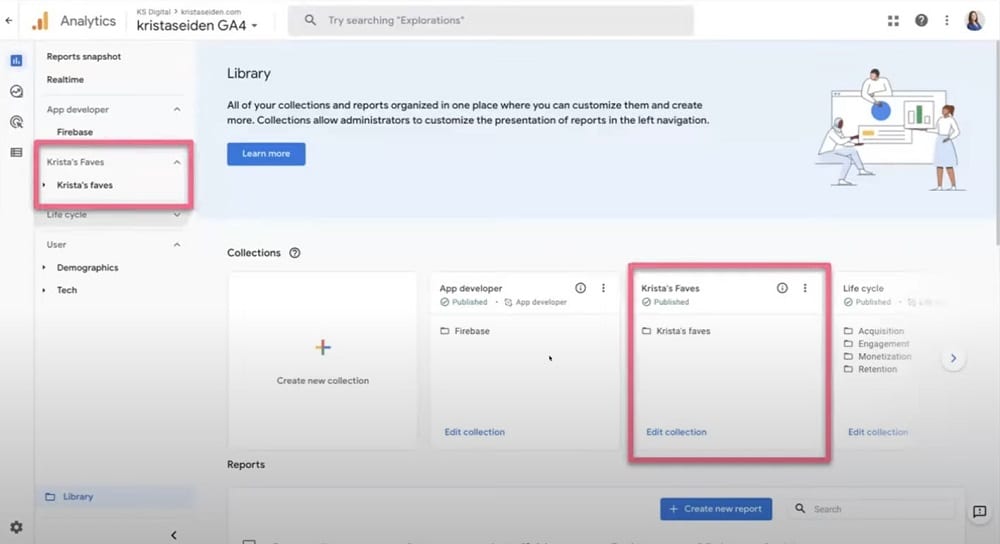
This organisational tool is especially beneficial for larger teams or businesses with multiple departments. Custom collections, such as “Marketing Team” or “US Reports,” ensure that relevant stakeholders can quickly access the needed data.
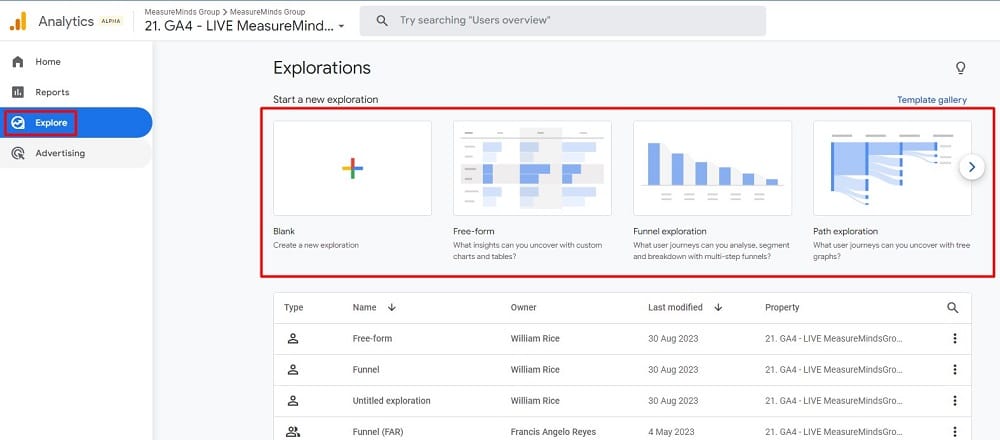
3. Explore reports
Explore is a comprehensive analysis tool available in GA4 that offers deeper insights than the standard reporting UI. This tool is equipped with a range of techniques that allow users to delve into their data, uncovering patterns, trends, and actionable insights.
Some techniques include:
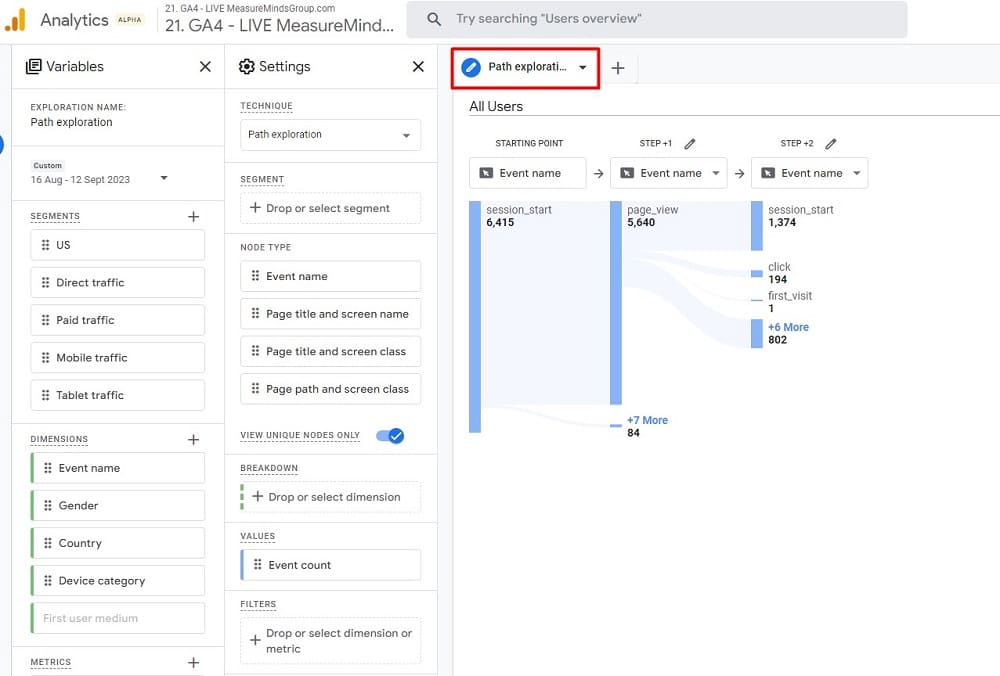
- Path Analysis: Allows users to visualise the most common paths users take on their websites or apps.
- Segment Overlap: Helps identify how different user segments interact with content and offers insights into potential overlap.
- Funnel Analysis: Enables tracking of user conversions step-by-step to identify drop-off points in the conversion process.
- Pathing Reports: Provides detailed reports on user interactions, helping to analyse the sequences of actions taken.
- Segmentation: Allows for the creation of custom segments to analyse specific user groups or behaviours.
Analysis techniques
The Explore tool offers many analytics techniques that are not available in standard reporting UI. It provides features such as ad hoc queries, visualisation styles, segmentation, filtering, exporting data, and sharing analyses with others.
Unlike the standard table reports, this enhanced version allows users to add multiple dimensions and metrics, segment data, and break it down in various ways. This flexibility ensures that users can tailor their reports to capture the exact insights they’re after.
Funnels
Funnels are a powerful feature within Explore, allowing users to visualise the user journey through a series of steps. For instance, a funnel could track a user’s path from landing on a homepage, navigating to a product page, adding a product to their cart, and finally making a purchase.
A standout feature of GA4 funnels is creating audiences from specific funnel steps. For instance, users dropping off after adding to the cart can be retargeted to encourage completing their purchase.
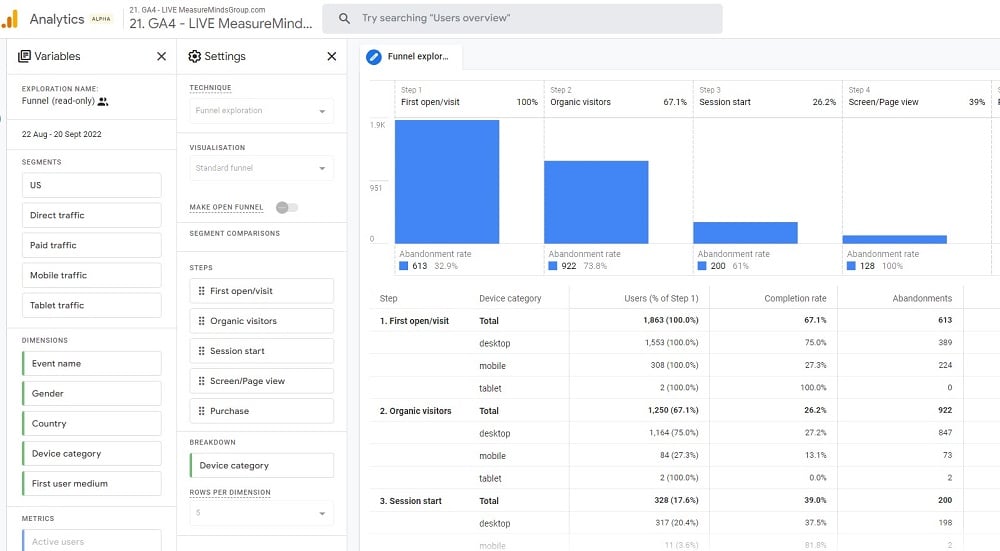
Funnels can be segmented to compare different user groups side by side. Businesses can gain insights into how different traffic sources or user segments interact with their site by segmenting funnels.
Path reports
Path reports in GA4 offer insights into user routes through a website. Initially, they didn’t include page paths, but after feedback, GA4 introduced this addition for better user navigation analysis.
Path reports in GA4 allow users to analyse backward paths by using the “start over” button. This reverse analysis aids in optimising the user journey and boosting conversion rates.
GA4’s explore tool demonstrates Google’s commitment to empowering businesses with in-depth data analysis for informed decision-making.
4. Integrations make GA4 stronger
One of the standout features that sets Google Analytics 4 (GA4) apart from its predecessor, Universal Analytics (UA), is its robust integration capabilities. These integrations enhance the functionality of GA4 and make it a more versatile tool for businesses of all sizes.
Free integrations for all
In Universal Analytics, only Google Ads and Search Console were free integrations, while others required GA360 subscription. GA4 democratises access by offering a wide range of integrations at no extra cost for all users, free or premium.
Expanded integration options
GA4 offers integrations with a plethora of platforms; here are a few of them:
BigQuery Integration
The most significant integration offered by GA4 is with BigQuery. BigQuery is a fully managed, serverless data warehouse that enables super-fast SQL queries using the processing power of Google’s infrastructure.
With its high-speed querying capabilities and advanced analytics features, BigQuery enables businesses to derive valuable insights from their data, make data-driven decisions, and unlock new growth opportunities.
Google Merchant Store
Google Merchant Center helps businesses showcase products on multiple Google platforms, driving online sales. By adding products to the Merchant Center, businesses can have listings on Google Search, Maps, YouTube, and other Google sites and apps. This boosts visibility, attracts customers, and offers full control over inventory.
Best of all, it’s free to sign up, making it a cost-effective solution for businesses of any size.
5. A Brand New Data Model
Google Analytics 4 introduces a highly customisable, event-based data model, revolutionising data capture and analysis for users’ specific needs.
Fully Events-Based Model
GA4 operates on an entirely events-based model, categorising events into four distinct types:
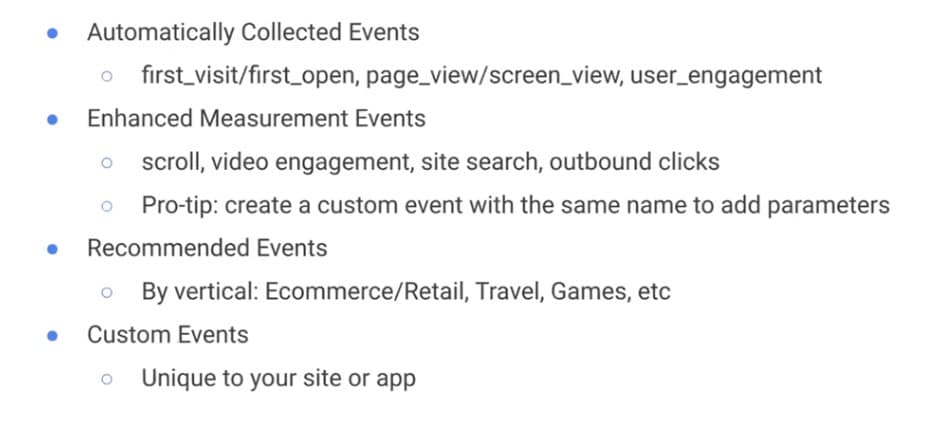
Automatically collected events
These are events that GA4 captures right out of the box as soon as the tracking code is installed. Examples include first visits, page views, and screen views.
Automatically collected events in GA4 are triggered by basic interactions with a website or mobile application. They offer critical details in reports, including visitor information and content views.
Enhanced measurement events
Enhanced measurement events in Google Analytics 4 are automatically triggered and logged on specific user activities, providing valuable insights into user engagement and behaviour.
These events can be toggled on or off based on user preferences. They encompass actions like scrolling, video engagement, site searches, and outbound clicks.
Recommended events
GA4 offers event recommendations based on industry verticals such as e-commerce, travel, or gaming. Users can unlock additional reporting features tailored to their industry using these standardised event names. For instance, e-commerce sites must use the specific e-commerce syntax provided by GA4 to access specialised reports.
These events are helpful because they provide businesses with pre-configured event tracking options, allowing them to quickly and easily track important interactions and behaviours on their website or app without the need for manual setup, saving time and effort.
Custom events
For actions that don’t fit into the predefined categories, GA4 allows users to create their own custom events, ensuring that all user interactions, no matter how niche, can be tracked and analysed.
This allows businesses to measure and analyse specific actions, such as button clicks, form submissions, or video interactions, providing deeper insights into user behaviour and enabling more targeted optimization strategies.
Real-world application: blog interaction
In GA4, when a reader clicks “continue reading” on a blog post summary, it triggers an event called “select content” capturing parameters like button title, article details, and link URL for practical insights.
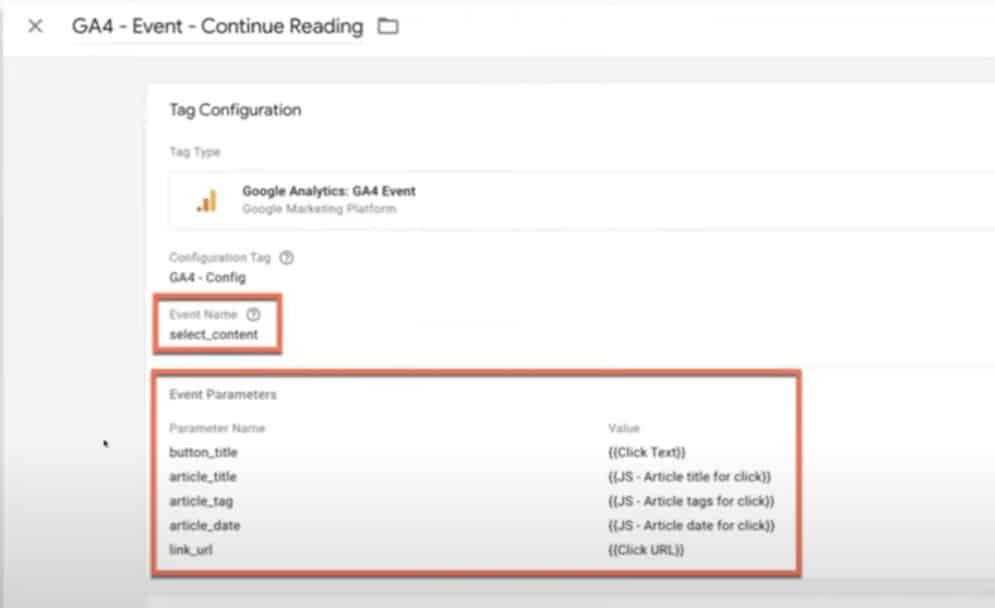
For instance, on a blog, you can track which articles are being clicked on the most. Adding the article title as a secondary dimension in the event’s report lets you gain insights into reader preferences. If an article tag is missing, this can be easily identified and rectified.
A/B testing and data collection
GA4’s flexible data model is evident in A/B testing. When testing newsletter sign-up box headlines, you can track the “newsletter sign-up” event with parameters like subscription type, location, experiment name, and variant ID.
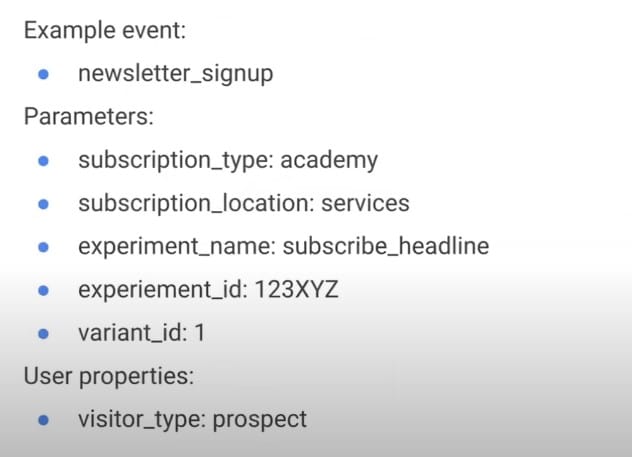
This granular data allows for a detailed analysis of which headline variant performs best, providing actionable insights for optimisation.
Common Google Analytics 4 reporting mistakes
Transitioning from UA to GA4 can be challenging due to interface and data presentation shifts. Here, we’ll explore common GA4 reporting mistakes and misconceptions, and learn how to navigate them.
GA4 interface is too simple
One of the initial reactions from many users transitioning from UA to GA4 is the perceived simplicity of the GA4 interface. The left-hand navigation was populated in UA with numerous links leading to specific reports. For instance, there was a distinct link for the “browser and OS report.”
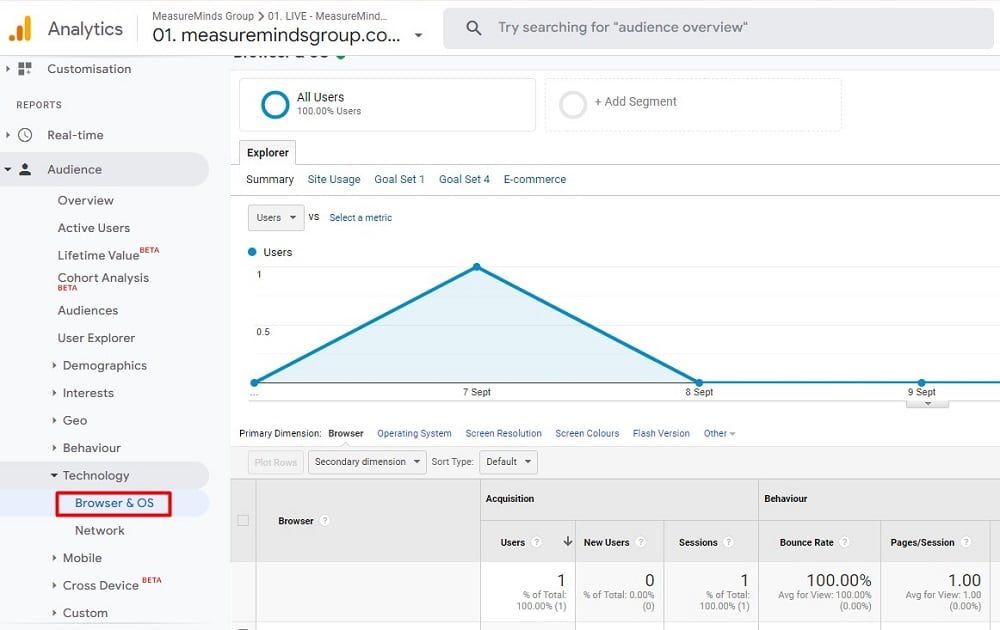
GA4 features a streamlined left-hand navigation with fewer links under categories like “Tech.” Despite this, it doesn’t necessarily require more detailed reporting like UA, dispelling a common misconception.
GA4 has taken a more consolidated approach. Instead of having separate reports for each category, GA4 combines multiple dimensions into single reports. For instance, the “Tech Details” report in GA4 encompasses 10 dimensions in one table.
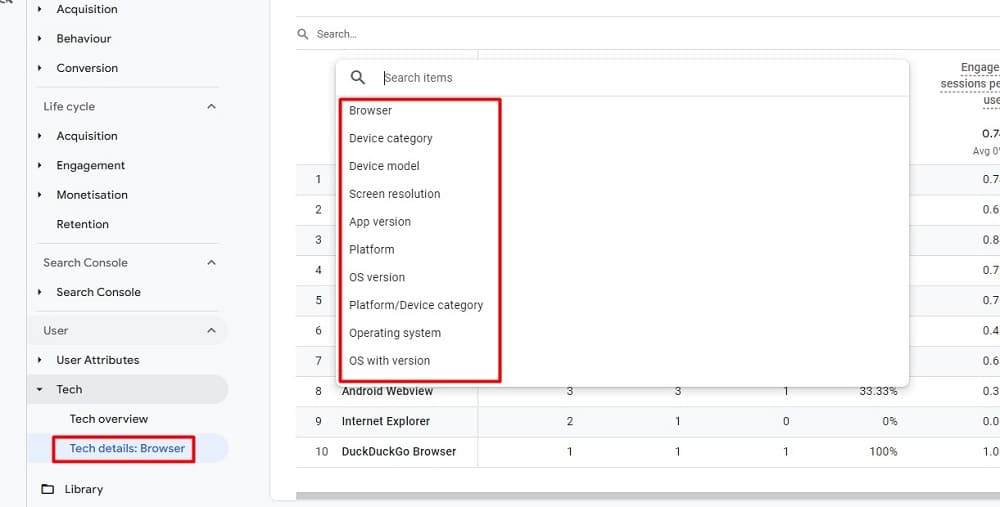
Users can easily toggle between dimensions like screen resolution, device category, browser, OS, and more, all within the same report. This design reduces clutter and allows users to access multiple data points without navigating to different sections.
GA4’s seemingly simplified interface prioritises efficiency and user-friendliness, consolidating reports for a streamlined experience. Familiarising yourself with this approach is key to harnessing GA4’s full potential.
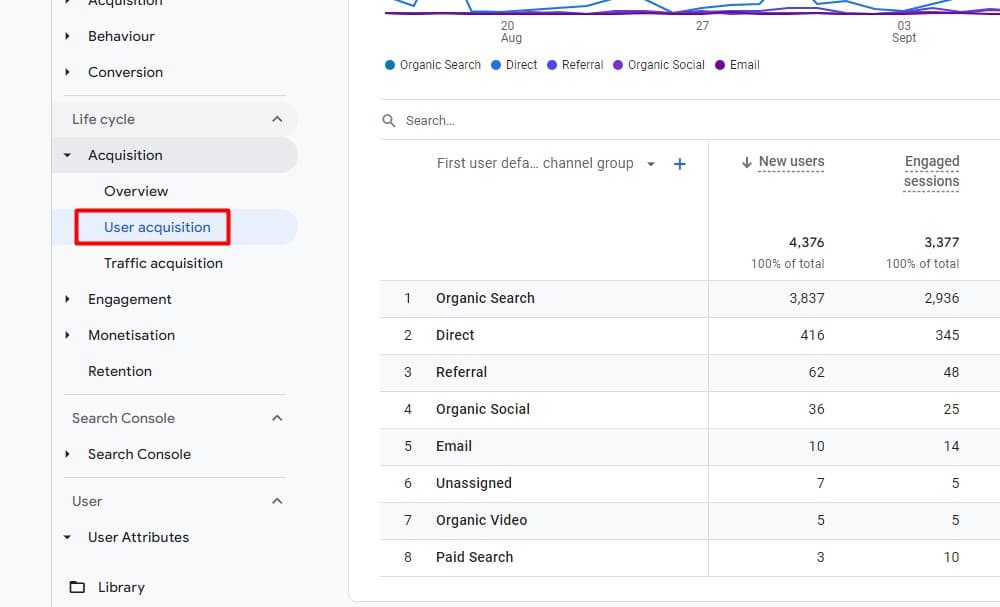
Confusion between acquisition reports
In the realm of GA4, understanding acquisition reports is crucial. However, a common point of confusion arises due to the presence of two distinct types of acquisition reports: the User Acquisition Report and the Traffic Acquisition Report. Let’s break down the differences and purposes of each:
User acquisition report
The User Acquisition Report focuses on the very first interaction a user has with your website. Specifically, it highlights the initial campaign, source, or medium that directed a user (or cookie) to your site. This report provides insights into the “first touch” attribution. It answers the question: “How did this user first discover our website?”
Traffic acquisition report
On the other hand, the Traffic Acquisition Report is centred around the campaign, source, and medium that initiated a specific session. This is termed as “session attribution.”
It ultimately helps businesses understand the effectiveness of their marketing efforts and make informed decisions to optimise traffic acquisition strategies.
For those familiar with Universal Analytics, this report’s approach will resonate, as Universal Analytics was also session-based.

Using both reports for comprehensive insights
By leveraging both the User and Traffic Acquisition Reports, you can gain a holistic understanding of your audience’s journey. For instance, you can discern how users initially find your site and subsequently how they return.
Let’s say you observe that the primary session source is “Google organic,” but the first user source is a referral from a specific website, say “MeasureMinds Group’s blog.” This indicates that while users initially discovered your site through a referral, they later returned via organic search on Google.
GA4 uses the “last non-direct click” for traffic attribution, where sessions return to the last known non-direct source. While not explicitly stated in the interface, it’s a foundational aspect of GA4’s attribution model to understand.
GA4’s acquisition reports, though initially complex, provide valuable insights into user behaviour. Marketers and analysts can harness this data to craft effective strategies and better understand their audience’s journey.
Lack of views
One of the more chanted concerns regarding GA4 is the apparent absence of views. In the previous UA setup, views played a pivotal role in data organisation, allowing users to segment data for different user groups, purposes, or geographical regions.
For instance, in UA, it was common to have separate views for different regions, like a “US view” or a “UK view.” Similarly, specific teams might have their dedicated views, such as a “Marketing view” or a “Product view.”
GA4’s approach: Properties over views
In GA4, the traditional “views” from Universal Analytics (UA) have been replaced with a focus on “properties.” This change reflects GA4’s aim to simplify data organisation while offering more comprehensive insights.
Properties in GA4 are versatile, capturing data across websites, mobile apps, and other digital touchpoints. This ensures a unified data collection, allowing analysts to see a broader picture of user interactions across platforms.
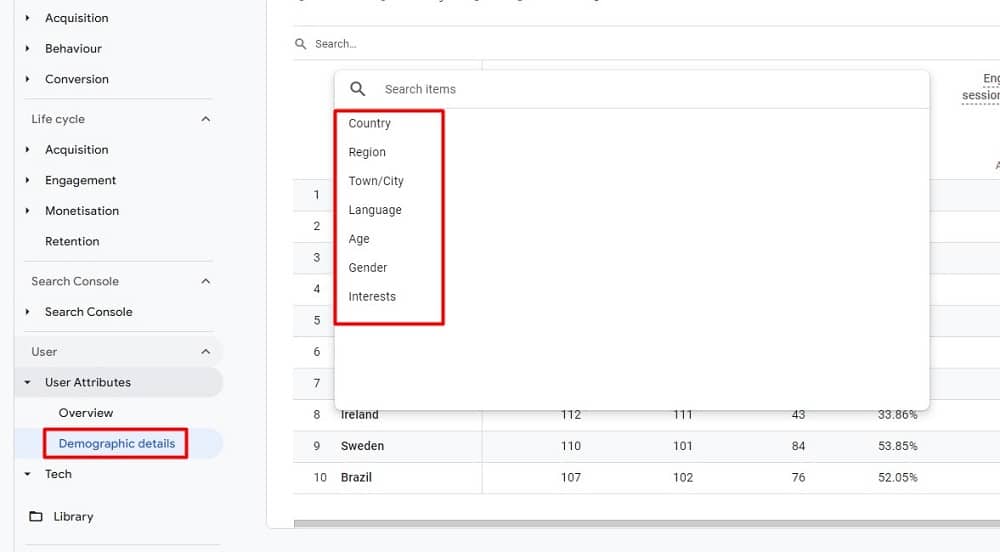
Using report filters for data segmentation
Though GA4 lacks the granularity of views, it compensates with report filters. Filters help create specific groupings and reports similar to what was achieved with views. For example, segmenting data by users from the UK can be done by adding a country filter to reports.
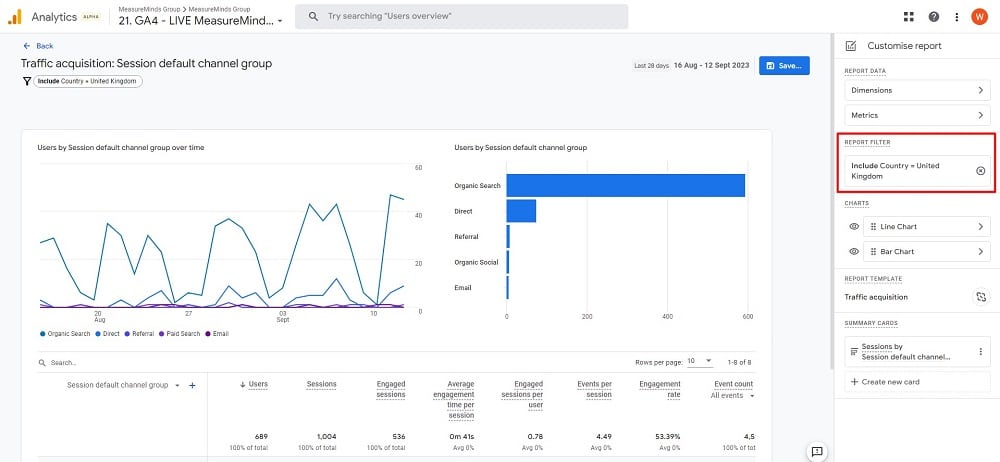
By saving these filtered reports under new names, such as “UK Page Path,” you essentially craft a tailored report collection.
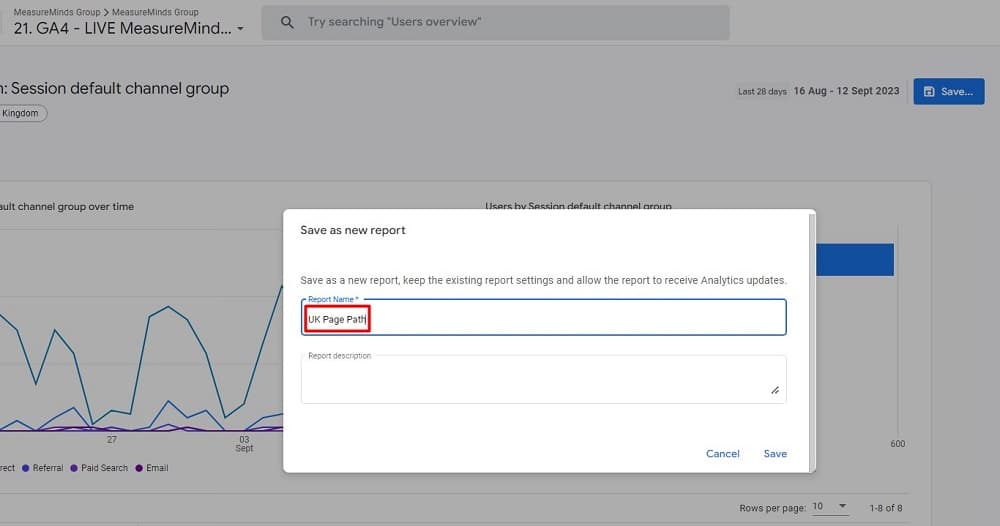
In the example, after filtering reports for UK traffic, you can add them to a “United Kingdom Reporting” section in the left-hand navigation, mimicking the convenience of “views” in UA.
Collections: The organisational tool
Collections in GA4 group and modify filtered reports, but they lack user-specific access restrictions. So, while you can create a US data collection, anyone with property access can view it. Still, collections help organise data for easy access.
GA4 has moved away from “views” but provides flexibility through report filters and collections, allowing users to achieve the same data segmentation and organisation as in Universal Analytics.
Explore is complex & overwhelming
The “Explore” feature in GA4, while powerful, can often be perceived as intricate and daunting, especially for those new to the platform. Here’s a breakdown of common concerns and how to navigate them:
One of the primary concerns is the inability to share explorations directly. They are sharable within a property, but when shared, they are view-only.
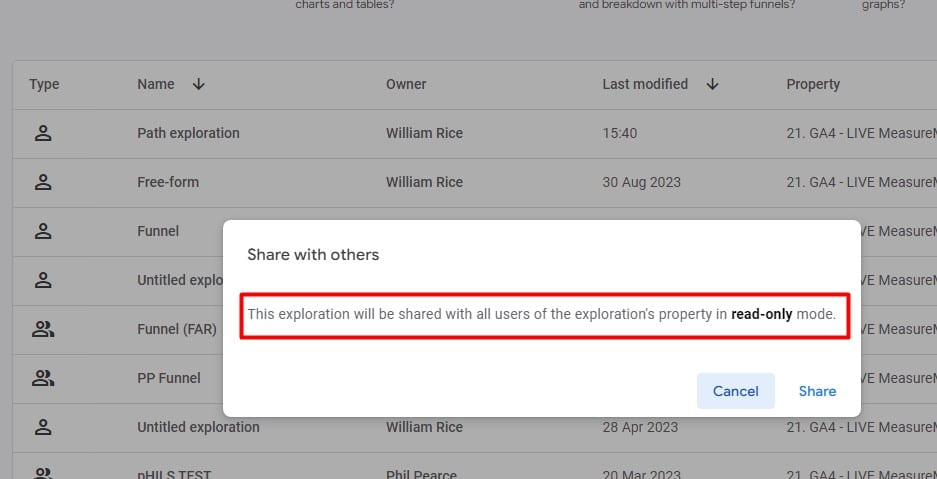
So, here’s a workaround:
On the exploration overview section, locate the three dots on the right-hand side.
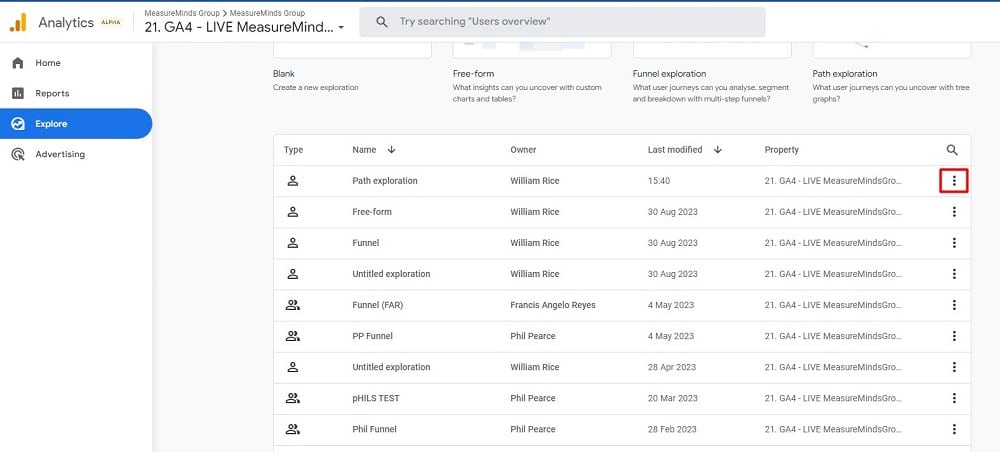
Click and select “Duplicate” to create a personal copy of the report.

Remember, any edits made to this duplicated report won’t affect the original.
Using the wrong dimensions
Avoid pitfalls by choosing dimensions carefully in Explore, as inappropriate selections can distort data. Familiarise yourself with each dimension’s nuances and implications for accurate reporting.
For example – The “Traffic Source” category in GA4 houses dimensions related to initial user interactions and session data.
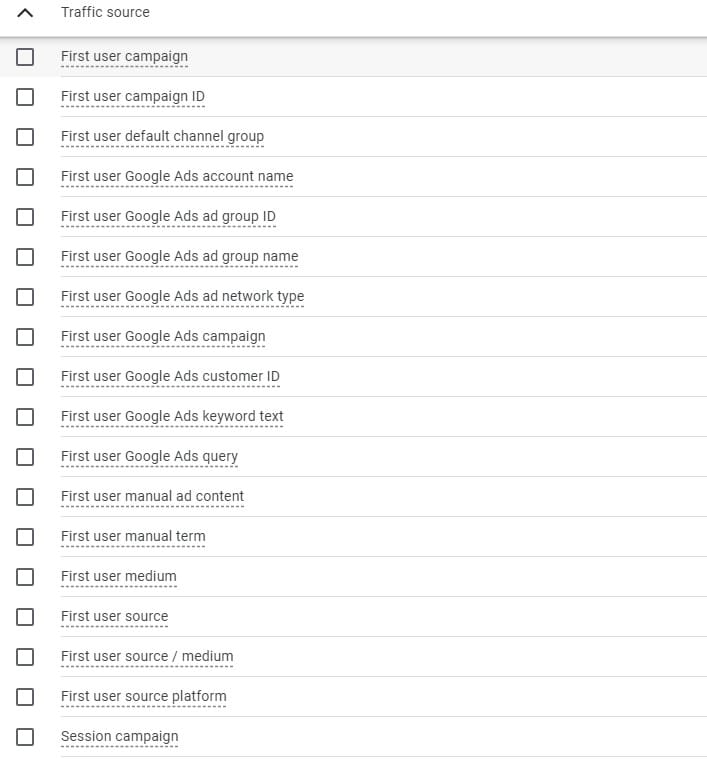
And the “Attribution” category, though seemingly familiar, is event-scoped. This means that using dimensions from the “Attribution” category might lead to misrepresentative data.
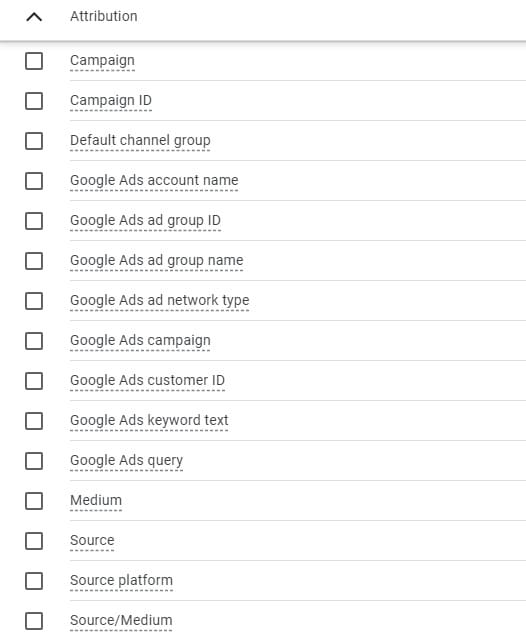
It’s always advisable to lean toward the “Traffic Source” dimensions for more accurate insights.
Sampling concerns in explore
Sampling can be a significant concern, especially when dealing with vast amounts of data:
Free user
If you have more than 10 million events within a selected time period, you’ll encounter sampling. To avoid this, consider reducing the time frame of your report. This allows you to analyse your data more accurately and comprehensively, especially if you have a large volume of events.
GA360 users
The threshold is higher, with up to 1 billion events in the time period before sampling kicks in.
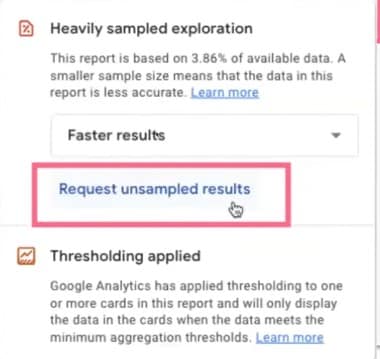
Precision options
All users can choose between “Faster results” or “More detailed results”. The latter provides a 10x version of the former. These precision options allow users to customise their data processing and reporting according to their specific needs, striking a balance between speed and detail in order to optimise their analytics experience.
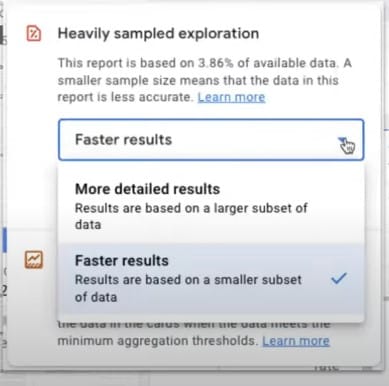
For instance, if the faster result is based on 3.86% of the data, the more detailed one would be based on 38% of the data. 360 customers have an added advantage: they can request an unsampled report in Explore.
Time period and precision adjustments
If you’re hitting sampling limits, there are two primary strategies to consider:
- Reduce the time period: By narrowing down the time frame, you can stay below the sampling threshold.
- Change the precision: Depending on your needs, you can opt for faster results or more detailed insights. Remember, the more detailed option provides a denser data sample.
While GA4’s “Explore” feature may seem overwhelming at first, understanding its nuances and functionalities is key to unlocking its full potential. It’s about knowing where to look and how to adjust settings for the insights you need.
Registering custom dimensions in GA4
During the transition to Google Analytics 4 (GA4), users often wonder about the location of custom dimensions. They may send many parameters to GA4 but find their desired dimensions missing from reports.
In GA4, custom dimensions require registration, unlike Universal Analytics, which automatically recognises them. This explicit registration is necessary to make custom dimensions available in reporting.
How to register custom dimensions
Accessing the admin section: Begin by navigating to the admin section of your GA4 property.
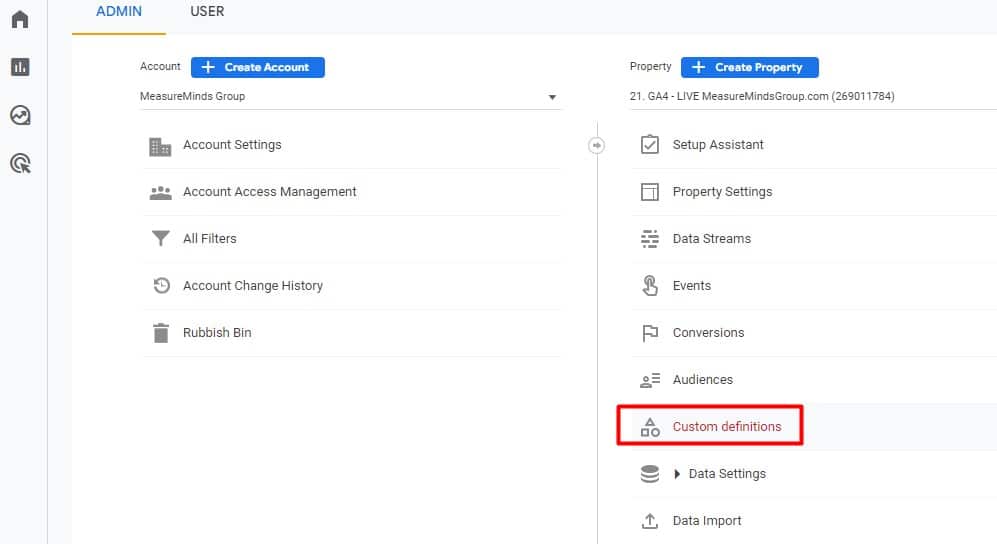
Heading to custom definitions: Under the Property column, you’ll find an option labelled ‘Custom Definitions.’ Click on it.
Selecting custom dimensions: Here, you’ll see a button, ‘Create custom dimension.’ Click on this button.
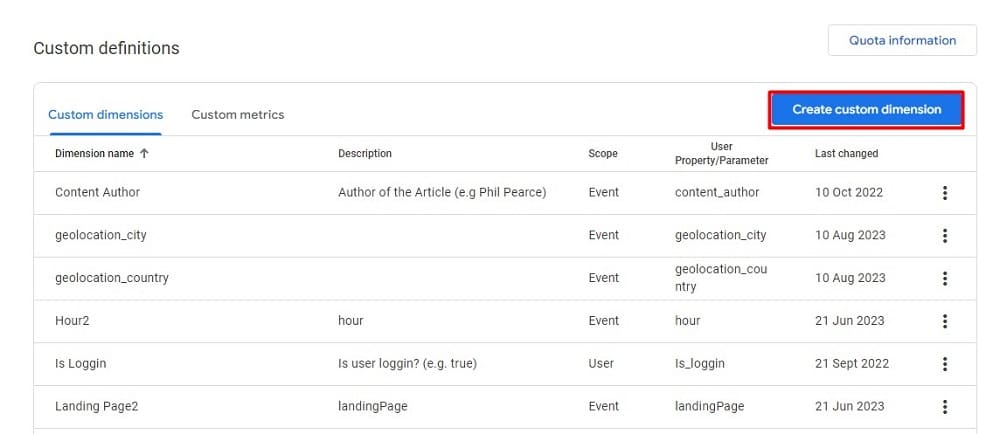
Choosing the event parameter: For the custom dimension you wish to register, select the corresponding event parameter. Then fill in the name & then click on the “Save’ button.
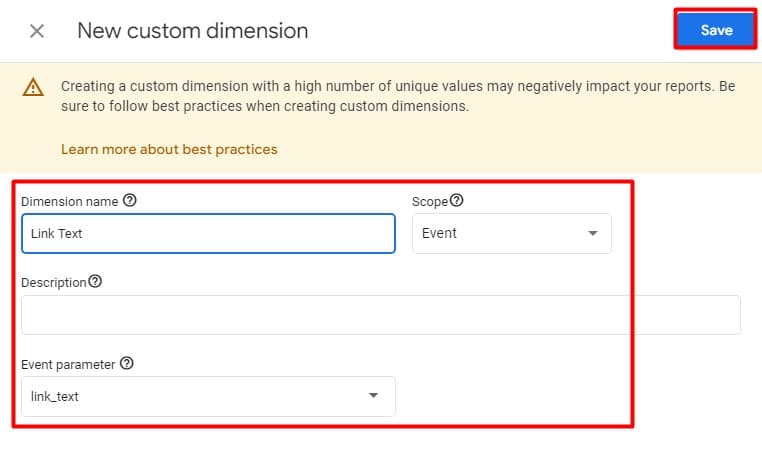
Note: It’s a best practice to name the dimension identically to the event parameter. This ensures clarity and avoids confusion in the future.
Once registered, these custom dimensions will be available for use in your reports. If you’ve registered dimensions like ‘article title,’ ‘article tag,’ or ‘article date,’ you can now easily incorporate them into your ‘select content’ event reports.
Embarking on the GA4 journey: Steps and resources
Google Analytics 4 is the next step in this evolution, and if you haven’t made the transition yet, now is the time. Here’s a guide to help you navigate this transition smoothly.
Setting up your GA4 property
The first step in embracing GA4 is setting up a new GA4 property. While Google offers a “Jumpstart” feature that automatically creates a GA4 property based on your Universal Analytics settings, it’s recommended to set this up manually.
Why? There are some issues with GA4 auto migration like it might carry over “dirty” data from your UA setup or might not be structured optimally for GA4’s capabilities. For instance, the event category, action, and label from UA might be transformed in a way that doesn’t align with your analytics goals in GA4.
If you’ve been auto-migrated, you’ll recognise the migrated property in your list by the “-GA4” suffix in its name. However, for a cleaner and more controlled setup, it’s best to create your own GA4 property.
Resources to guide you
The journey to mastering GA4 doesn’t have to be a solo one. The digital analytics community is rich with resources:
MeasureMinds’ Blog: An excellent resource for all things GA and GTM.
Krista’s Blog: A treasure trove of GA4 setup guides and insights. Visit here.
And there are countless more experts and resources out there waiting to be discovered. When in doubt, a quick Google search can lead you to a wealth of knowledge.
Learning Opportunities
For those keen on structured learning, there are courses specifically tailored for GA4. Krista offers courses on GA4, which can be found at academy.ksdigital.com. As a token of appreciation for the community, there’s a special offer: use the code “GA4Ward” to get a discount on any full course or bundle.
About Krista Seiden
Krista Seiden is the Principal Digital Analytics Consultant & Chief Instructor with KS Digital, an analytics consultancy she founded in 2019, helping businesses make the most of their investments in digital marketing and analytics. Previously, Krista was at Google for nearly 7 years, where she led Product Management efforts across the Google Marketing Platform and served as the external evangelist for Google Analytics.

- Top 24 Google Analytics Chrome Extensions & Sheets Add-ons - 21/05/2026
- Best Consent Management Platforms (CMP) - 19/05/2026
- Google Signals and Consent Mode: What This GA4 Change Really Means - 23/04/2026